Automatic Extraction Method for Impervious Surface Area by Integrating Nighttime light Data and Landsat TM Images

  • CHENG Xi , 1, * ,
  • WU Wei 2 ,
  • XIA Liegang 2 ,
  • LUO Rui 1 ,
  • SHEN Zhanfeng 3
Expand
  • 1. College of Geophysics, Chengdu University of Technology, Chengdu 610059, China
  • 2. College of Computer Science and Technology, Zhejiang University of Technology, Hangzhou 310014, China
  • 3. Institute of Remote Sensing and Digital Earth, Chinese Academy of Sciences, Beijing 100101, China
  • 4. University of Chinese Academy of Sciences, Beijing 100101, China
*Corresponding author: CHENG Xi, E-mail:

Received date: 2017-06-30

  Request revised date: 2017-08-31

  Online published: 2017-10-20

Copyright

《地球信息科学学报》编辑部 所有

Abstract

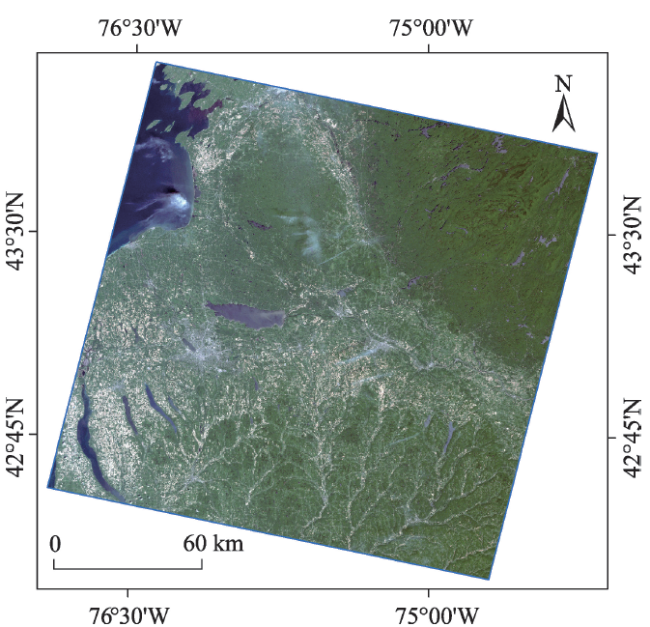
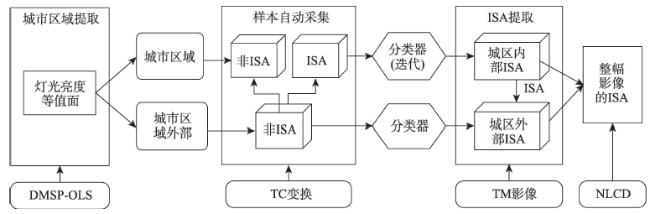
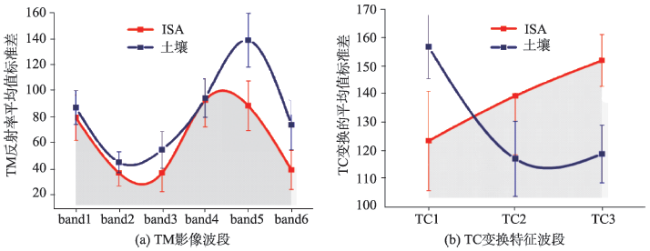
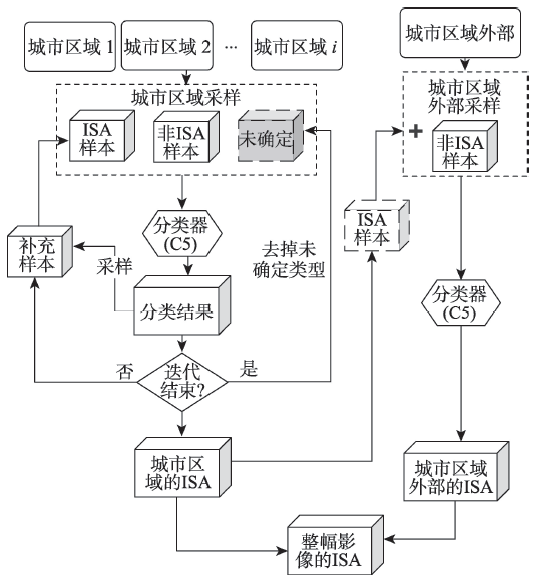
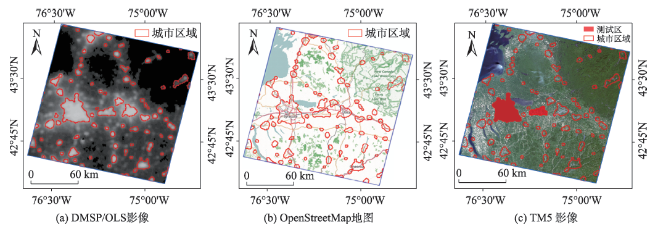
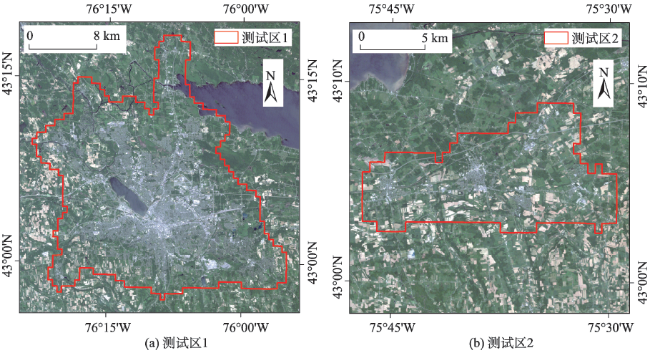
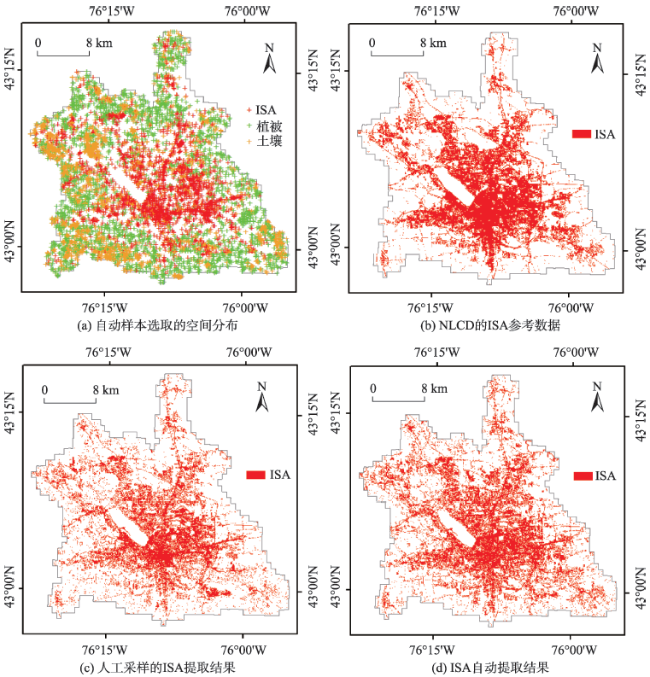
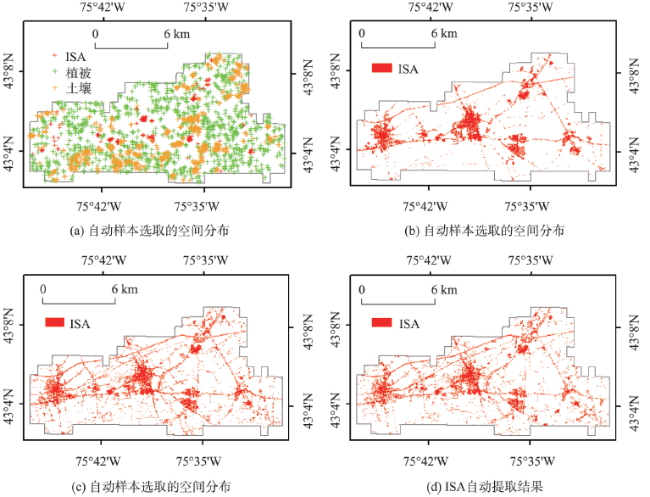
Using multi-source remote sensing data to extract impervious surface information is an important and active research direction. The present study integrated spatial and spectral information from nighttime light data and Landsat TM remote sensing images to automatically extract the coverage information of Impervious Surface Area (ISA), given that in the previous studies, manual selection of impervious surface samples was usually needed for model training. In the present method, firstly, ISA concentrated urban areas were located according to the distribution of nighttime lights. Thus, the ISA spectral characteristics of the local scale in the urban area parts were more clear and obvious compared to the whole-image scene scale. Meanwhile, for the urban exterior, there were mostly non-ISA pixels, therefore the soil samples which were easily confused with ISA were extracted from the urban exterior, and the general spectral features of these samples on this image were calculated. These features could be utilized to distinguish ISA pixels from urban areas. Thus, highly reliable ISA and non-ISA samples were automatically selected from urban area and urban exterior, respectively. Secondly, ISA from urban areas was extracted by an iterative classification process. For the iterative classification process, new samples from the previous extraction results were collected and then added to the following classification process, to make the features of the ISA samples more representative of different types of ISA coverage. Then, ISA samples of urban area were selected from the extraction results, combined with the non-ISA samples of the urban exterior. A sample set was formed to classify the urban exterior. Lastly, the classification results were integrated to complete the whole image. An experiment with this method was completed. DMSP/OLS nighttime light images and Landsat5 TM images of the Syracuse, USA were chosed. 84 urban areas were extracted and the detection accuracy rate was above 95% compared to the Openstreet map. Two urban areas with high and low ISA density from the detection results were selected as the test areas. Automatic selection of ISA and non-ISA samples were performed to the TC transform feature bands of the Landsat5 TM images. The overall accuracy and kappa coefficients of sample selection in urban areas were 92.45% and 0.76, respectively, and 96.52% and 0.85 in urban exterior. For the results extracted by decision tree classifier, the average overall accuracy and Kappa coefficient were 88.23% and 0.63 in the urban areas; 78.6% and 0.54 in the urban exterior. These results are superior to manual methods. This is because the approach of automatic samples selection was more capable of obtaining samples of mixed pixel types compared to manual samples selection. Moreover, the representativeness of samples in spatial distribution and spectral characteristics was better since the iterative classification process was introduced. It suggests an automated classifcaltion workflow is achieved by the proposed method, and this method is reliable and effective for both urban area and urban exterior. In further researches, it could be expected that the ISA extraction accuracy could be improved by optimizing classification characteristics (e.g. adding space features) and improving classification algorithms.

Cite this article

CHENG Xi , WU Wei , XIA Liegang , LUO Rui , SHEN Zhanfeng . Automatic Extraction Method for Impervious Surface Area by Integrating Nighttime light Data and Landsat TM Images[J]. Journal of Geo-information Science, 2017 , 19(10) : 1364 -1374 . DOI: 10.3724/SP.J.1047.2017.01364

1 引言

不透水面是可以阻止水和空气向地下渗透的特殊土地覆盖类型,其通常由人工材料构成,包括道路、建筑屋顶和停车场等。地表不透水面的扩展可以视为城市化发展程度的直观指示因子,其同时又对区域环境质量有重要的影响。例如,在流域上,不透水面的增长与城市地表径流、非点源污染相关联而对流域水质产生影响[1-2];在城市中,不透水面增长的空间模式会改变城市冠层和边界层的潜热通量状态进而影响城市气候[3]。因此,利用遥感数据对不透水面进行监测成为一个重要且活跃的研究方向[4]
不透水面所聚集的城市区域空间结构复杂,且在遥感影像上多表现为多混合像元。大多研究是在多光谱影像的亚像元尺度上对不透水面覆盖率(Impervious Surface Percentage,ISP)进行定量描述。研究方法主要分为以下2类:① 混合像元分解模型[5-7]。根据“V-I-S”模型[5],将异质性的城市土地覆盖简化为植被、不透水面和土壤3种地物类型组成。其中不透水面可被定义为一种独立的端元或视为高反射率端元和低反射率端元之和[8],从而根据最小二乘法等混合像元分解方法来求解。② 统计模型。通过对高分辨率遥感影像进行分类得到地面真实的不透水面参考数据,然后建立其与多光谱遥感影像特征波段之间的统计回归模型来求解像元内包含不透水面的比例[9]。其中,常用的模型主要有多元回归模型、分类决策树、人工神经网络及支持向量机等[10]。此外,多源遥感数据与多类型特征集成的分析方法也被应用于不透水面提取研究[11-14]。例如,美国国家土地覆盖数据库(National Land Cover Database,NLCD)利用专题数据辅助进行不透水面产品的提取[15-16]
综合而言,已有研究大多需要在以人工方法获取一定数量的不透水面样本来对提取模型进行训练。这主要是由于不透水面本身的光谱复杂,与其他地物(如土壤等)存在较大的光谱混淆,因此针对较大范围的提取研究,难以通过光谱指数[17]等方法实现自动化的提取流程。为提高不透水面的提取效率,本文集成了夜间灯光遥感与多光谱遥感数据,提出一种针对像元级不透水面覆盖范围(Impervious Surface Area,ISA)的自动化提取方法。整个自动化提取流程的实现主要基于以下考虑:① 夜间灯光数据直接地指示了城市区域的位置,并且包含了这些城市区域之间的空间信息;② 在城市区域内部,聚集了大部分的ISA像元,因此其在局部尺度上的光谱特征较在整幅影像局部上更明显和明确;③ 在城市区域外部主要以非ISA类型的像元为主,可以利用其光谱特征辅助提取ISA。因此,本方法将整幅影像划分为不同的区域,并在各区域内部进行针对性的处理,最终实现整幅影像ISA信息的自动提取流程。

2 研究区概况与数据源

本文研究区位于美国纽约上州中部的雪城(Syracuse city)(图1),包含中等规模的城市区域,覆盖了从低密度到高密度的ISA表面,是一个具有代表性的不透水面提取区域[13]。以美国国防气象卫星计划 (Defense Meteorological Satellite Program's Operational Line Scan System, DMSP/OLS)所提供的夜间灯光数据和中等分辨率的Landsat 5 TM多光谱遥感影像为实验数据进行ISA自动提取 研究。
实验TM影像的获取时间为2011年6月3日,选用除热红外波段以外的其他6个波段(可见光波段、近红外波段及2个中红外波段)合成。由于大气效应对于Landsat影像分类等操作影响不大[18],因此仅将影像的DN值校订为大气表观反射率。对于夜间灯光数据,选用DMSP/OLS提供的稳定灯光数据,该产品去除了闪光与云层的干扰,在以往的研究中常被用于估计人类活动区域的指示因子[19]。因为DMSP/OLS影像的空间分辨率为30 弧秒(约1 km),为了与TM影像的分辨率匹配,将其重新投影到UTM坐标系重采样为30 m,并裁剪为与TM影像一致的大小。
实验的验证数据集采用研究区2011年NLCD的不透水面产品来进行精度评价。NLCD的产品精度在90%左右[16],并且在空间上具有连续性,能够有效地对ISA提取结果进行精度评价。本文实验仅关注像元级的ISA信息提取,在预处理中将NLCD不透水面产品中ISP大于1的像元划分为ISA类别,同时将ISP值等于0的像元划分为非ISA类别。此外,实验还采用了OpenStreetMap提供的地图数据来对DMSP/OLS灯光影像提取城市区域的结果进行验证。
Fig. 1 Location of the study area and the Landsat 5 TM image

图1 研究区位置与实验TM影像

3 研究方法

本文通过整合DSMP/OLS夜间灯光遥感数据和Landsat 5 TM多光谱遥感数据,根据夜间灯光的分布来定位ISA聚集的城市区域的位置来作为ISA提取的指示信息。自动化ISA提取方法流程如图2所示,由3个连续的计算步骤组成:① 城市区域提取,在夜间灯光影像上分析夜光的强度与空间关系,提取出一系列ISA聚集的城市区域;② 样本自动选取,在TM影像上分别对城市区域内部和外部进行光谱分析,自动地提取出一定数量的ISA及非ISA样本;③ ISA信息提取,首先选择适当的分类器进行样本训练,通过迭代分类在城市区域内部提取ISA信息,然后从提取结果中采集ISA样本对城市区域外部进行分类,最后将分类结果整合完成ISA的提取流程。本方法将整幅影像划分为具有空间意义的区域,并进行针对性处理,有效地挖掘和利用上一步分类结果中所蕴含的信息,从而实现自动化流程。
Fig. 2 The automatic workflow of ISA extraction

图2 不透水面信息自动提取流程图

3.1 城市区域提取

在DMSP/OLS影像上,灯光的强度指示了ISA聚集区域的位置信息。然而,不同规模的城市区域在夜光影像上的强度与范围不尽相同,加上灯光本身的发散性,使不同城市区域间的灯光亮度也会相互干扰,难以通过一个固定阈值进行提取。因此,本文通过分析不同强度灯光区域间的空间关系来提取城市区域。首先,在夜光影像亮度值大于0的灯光区域中,根据灯光亮度值将其转换为不同亮度的等值面对象;然后,在此基础上将城市区域定义为空间相互独立的等值面对象,即要求其满足以下条件:
(1)该等值面对象中不包含其他等值面对象;
(2)该等值面对象若包含其它的等值面对象,则被包含的对象之间只存在包含或被包含的空间关系。
具体检测算法是将所有灯光等值面对象按面积大小排序,然后从面积最大的灯光等值面开始计算,得到其包含的其他等值面对象;如果这些被包含的等值面对象之间不存在互不相交的空间关系,则把该等值面指定为城市区域;再重复以上流程对所有的等值面进行检查,得到本幅影像上的城市区域。
在灯光区域中除去所提取的城市区域,将这部分范围定义为城市区域外部,对应了城市的外围区域和城市对象之间过渡的区域。经过对DMSP/OLS影像的处理,整幅影像被划分为城市区域、城市区域外部和非灯光区域3部分。因非灯光区域中ISA覆盖比例相对较少,因此本文将其与城市区域外部合并,即将二者均视为城市外部区域。在后续处理中,将分别在城市内外2个区域中进行处理来提取ISA。

3.2 样本自动选取

根据不透水面提取中普遍采用的“V-I-S”模型[5],需采集的样本包括植被、ISA和土壤3类。其中,植被光谱特征明确,易于采用植被指数等方法进行区分;而ISA与土壤之间则存在较为严重的光谱混淆。在TM影像上分别选取5000个ISA和土壤的样本点,统计其在TM影像各波段上的反射率值的均值与标准差,如图3(a)所示。可见,ISA与土壤像元的光谱曲线非常相似,在多数波段上均存在较大的交叉混淆。在此基础上,对TM影像进行缨帽变换(Tasselled Cap Transformation,TC变换)后再统计这些样本点在TC变换的3个波段上的特征,如图3(b)所示。可见,ISA与土壤的样本TC变换特征波段上的特征体现了更大的差异性,尤其是在亮度分量(TC1)与湿度分量(TC3)之间呈现相反的特征。因此,本文采用TC变换的特征分量作为样本采集的特征波段,通过统计不同区域内的像元在TC波段上的特征值来确定不同类型样本的分割阈值。
Fig. 3 Statistics of ISA and soil samples between Landsat 5 TM image bands and TC-Transform bands

图3 ISA与土壤样本在TM波段与TC变换波段上特征曲线

在3.1节得到的城市区域内部聚集了大部分ISA像元,同时也包含相当的非ISA像元(植被和土壤);而城市区域外部虽然包含有少部分的ISA像元,但主要以非ISA像元为主。因此,本文方法先在城市区域外部分析非ISA像元的光谱特征,尤其是提取出易与ISA混淆的土壤样本,再根据其特征统计对城市区域内部的ISA样本加以区分。
(1)城市区域外部的样本选取
ISA与土壤均具有高反射的特征(图3),但在城市区域外部中已经排除了大部分的ISA像元,并且土壤与ISA像元在TC变换的亮度分量与湿度分量上呈现反差,由此可根据式(1)来划分土壤与植被样本的样本区:
Sampl e i = Veg , TC 2 i > G T veg Soil , TC 1 i > B T soil T C 3 < W T soil N / A , 其他 (1)
式中:、和分别为该像元在TC变换波段上的特征值,当像元对应的值大于土壤样本的亮度分割阈值 B T soil 并且其对应的小于土壤样本的湿度分割阈值 W T soil ,将其划为土壤类型的样本区;同样,当像元对应的值大于植被类型的绿度分割阈值,将其划为植被类型的样本区;若均不满足则暂不作处理。其中, B T soi l W T soil 和可根据具体情况(如统计偏差程度等)采用不同的密度分割算法来指定。最后,在划分出的土壤/植被样本区中选取一定数量的样本组成非ISA样本集,并统计土壤样本在这些特征波段上的分布,作为在城市区域中选取ISA样本的参考。
(2)城市区域的样本选取
3.1节中通过提取城市区域划定了影像中ISA的聚集区域,与在整幅影像全局尺度上相比,ISA在城市区域内部局部尺度上的光谱特性更为明显,并且可以通过统计城市区域外部的土壤样本特征来对城市区域内部的ISA进一步区分。与城市区域外部样本采集类似,根据式(2)对每个城市区域内部进行阈值分割得到不同类型样本的样本区。
Sampl e i = Veg , TC 2 i > G T veg ISA , TC 2 i < G T veg TC 1 i > B T isa TC 1 i < B T soil Soil , TC 1 i > B T soil T C 3 < W T soil N / A , 其他 (2)
式中:、和分别为像元在TC变换波段上的特征值。、分别为该城市区域在TC2波段上的植被分割阈值及其在TC1波段上的ISA分割阈值,而 B T soil W T soil 为上一步城市区域外部统计的土壤样本在TC1波段和TC3波段上的分割阈值。具体算法先将 TC 2 i 大于的像元划为植被类型样本区;在小于的像元中,通过 B T soil W T soil 两个城市区域外部的阈值来检查该城市区域内是否可能包含土壤类型;再以 B T soil 与该城市区域内部的阈值来区分ISA与土壤的混淆,将值在二者之间的像元划为ISA类型的样本区。
最后,对于每个城市区域,在各类型的样本区中分别选取一定数量的分类样本用于ISA信息提取。根据式(1)、(2)可见,采用不同分割算法所产生的阈值也不一样,在具体实验中可以采用相对严格的阈值保证样本选取的精度。

3.3 ISA信息提取

根据3.2节中采集到的样本集,选择适合的分类器进行训练后对TM影像进行分类。整个分类的过程,分别在城市区域内部与城市区域外部进行,最后整合得到整幅影像的ISA提取结果。具体流程如图4所示。
(1)城市区域的ISA提取
根据3.2节,在每个城市区域中内自动选取ISA/非ISA样本,随后引入一个迭代分类的过程来提取该区域内的ISA。在迭代分类中不断地从上次的提取结果中采集新的样本加入下一次分类过程,使ISA样本的特征更多样,更能代表不同类型的ISA覆盖。由式(2)可知,在未满足ISA或非ISA采样要求的区域中随机选取一些“未确定”类型的样本,加入样本集进行训练。根据此策略,在迭代分类产生的ISA/非ISA的数量会逐渐增多,而“未确定”像元的数量会逐渐减少,直到ISA提取结果达到一个相对稳定的状态(前后2次提取结果面积变化较小)时迭代停止。此时已达到样本的最大提取效果,而可以考虑加入新的分类特征完善提取流程;或直接在下一次分类中仅使用ISA/非ISA样本完成分类。
Fig. 4 The workflow of ISA extraction

图4 ISA提取流程

(2)城市区域外部ISA提取
通过上一步完成对各个城市区域的分类后,可以得到影像上大部分的ISA分布信息。从这些城市区域的提取结果中选取一定数量的ISA样本,与3.2节中在城市区域外部得到的土壤/植被样本组合形成样本集,再通过分类器进行训练后对城市区域外部的TM影像进行ISA提取。
最后,将土壤和植被的分类结果合并为非ISA类型,并将城市区域内部和外部的ISA提取结果整合完成对整幅影像的ISA提取。整个流程均由算法自动完成,不需要人工加入样本。

4 实验结果与分析

4.1 城市区域提取的实验结果

城市区域提取主要依赖于DMSP/OLS影像中灯光强度的等值面信息。实验将亮度间距设为10来提取等值线,并与灯光区域的边界线合并(阈值为1),并将这些等值线转化为等值面。将最小检测面积设为9 km2(对应30个TM影像像元面积),然后在这些等值面中进行城市区域提取,结果如图5(a)所示。在研究区内总共检测出84个城市区域,因为DMSP/OLS影像本身空间分辨率较低及灯光的发散特性,检测结果的边界与TM影像上城市的边界不能完全匹配,较TM影像上的边界更大,所以难以通过边界形态上的定量比较来评价检测精度。本文通过目视检查将检测结果与OpenStreetMap地图和TM影像(图5(b)、(c))进行对比,若检测区域中包含地图上的城市点则说明检测结果正确。实验结果表明,本文的城市区域提取算法检测精度大于95%,并且能够检测到规模相对较小的城市区域。
在检测得到的这些城市区域中,分别选择了一个ISA密度较高的测试区和一个ISA密度较低的测试区(图5(c))用于对后续算法进行精度验证,以评价方法在不同城市建成区密度区域中的ISA提取精度,测试区对应的TM影像如图6(a)、(b)所示。
Fig. 5 The results of urban area detection with DMSP/OLS, TM image and Openstreet map

图5 城市区域检测结果在不同影像中的空间分布

Fig. 6 The selected urban area for accuracy test

图6 用于精度评价的城市区域与对应的TM影像

4.2 样本自动选取的实验结果

根据3.2节对TM影像进行TC变换后进行样本选取。首先在城市区域外部划分非ISA样本的样本区,然后在城市区域内部划分ISA/非ISA样本的样本区。根据式(1)、(2),实验采用Otsu算法[20]分别计算了城市区域外部和各个城市区域内部对应TC特征波段的分割阈值。为了保证样本选取具有较高的精度,将对应波段Otsu阈值增加了15%作为 B T soil G T veg W T soil 等阈值进行分割。在城市区域外部,对应的分割结果中由随机采样法选取了10 000个土壤类型的样本和10 000个植被类型的样本用于后续分类;在城市区域内部,根据城市区域的面积来确定在样本采集的数量,同样通过随机采样方法进行样本选取。将样本采集结果与对应的NLCD数据进行逐个对比后,得到精度统计如 表1所示。
Tab. 1 Parameters and statistics of sampling within external urban area

表1 城市区域外部采样精度表

各类样本数量/个 ISA/% 土壤/% 植被/% 总体精度/% Kappa系数
城区外部 10 000 - 93.77 98.21 96.52 0.85
城区1 1000 86.25 91.74 98.91 92.3 0.74
城区2 400 87.16 94.21 96.27 92.55 0.78
实验结果表明,在城市区域外部对于非ISA类型的样本采集精度整体大于95%,尤其在排除城市区域内所包含的大部分ISA像元后,易于混淆的土壤样本也在该区域内体现出明确的光谱特征,采样能够达到较高的精度而为后续分类提供高质量的样本数据。在城市区域内部,本方法在测试区的平均采样精度大于92%。通过对城市区域外部土壤样本特征的统计,能够将城市区域内部的土壤样本与ISA样本加以区分,从而获得更准确的ISA样本选取精度(平均精度大于85%)。需要注意的是,为了下一步在城市区域内部实现迭代分类的过程,在城市区域内根据该区域的面积同时选取了一定比例的“未确定”样本(式(2))加入样本集。

4.3 ISA提取的实验结果

应用上述过程中所得到的样本,选用决策树分类器,将TM影像的6个波段与TC变化的3个特征波段合并作为分类的特征影像,分别对各城市区域及城市区域外部进行ISA提取实验。为了说明方法的有效性,同时用人工样本选取的方法对实验数据集进行了ISA提取,最后应用测试集比较了2种方法的提取精度。
4.3.1 城市区域的ISA提取结果
根据图4方法,对各个城市区域所对应的ISA、土壤、植被和未确定4种类型的训练样本进行训练,并从上一次ISA提取结果中选取300个样本添加至训练集,直至满足前后2次ISA提取结果的面积之差小于10%后停止迭代,得到该区域的ISA提取结果。对测试区的ISA提取结果分别如图7(d)和图8(d)所示。同时,分别对2个测试区进行人工选取样本,再通过决策树分类器提取的ISA结果如图7(c)和图8(c)所示。
Fig. 7 Results of ISA automatic extraction within urban area

图7 测试区1的ISA提取结果

Fig. 8 Results of ISA automatic extraction within urban area

图8 测试区2的ISA自动提取结果

在测试区ISA提取结果中随机选择5000个测试点与对应的测试集进行点对点的检验,其提取精度如表2所示。
Tab. 2 Statistics of ISA extraction results within test urban areas

表2 城市区域ISA提取结果的精度统计

迭代次数 ISA制图精度/% ISA用户精度/% 非ISA制图精度/% 非ISA用户精度/% 总体精度/% Kappa系数
城区1 5 79.13 73.31 83.05 83.53 87.95 0.62
城区1-人工采样 - 70.22 80.62 92.25 87.09 85.32 0.64
城区2 3 73.61 65.12 82.32 95.7 88.56 0.64
城区2-人工采样 - 66.80 61.19 95.39 96.35 92.58 0.60
通过与测试区的NLCD数据(图7(b)和图 8(b))对比,可见本方法与人工采样方法的ISA提取结果的空间形态与测试数据基本一致,只是在ISA密度较低的地方存在误差。误差的来源一方面是样本采集引入的误差,即此区域内的ISA和土壤无法通过光谱特征来进行区分;另一方面,因为本文完全以TM影像为基础进行提取,而没有参考其他的辅助数据,因此在低密度的ISA区域提取误差相对较大。
从精度检验上,本方法在2个测试区上的总体分类精度大于85%,ISA提取精度约为75%,优于人工采样方法的提取精度。这是因为人工采样方法得到的样本大部分为光谱特征明确的样本,缺少对混合像元类型样本的采集,因此容易产生对ISA的漏分误差。本方法通过随机采样和迭代过程,使样本在空间分布和光谱特征上的代表性更好。实验结果表明本方法能够实现较高精度的ISA自动提取,并且对高、低密度ISA城市测试区的提取精度均较稳定。
4.3.2 城市区域外部ISA提取结果
在城市区域采集到的ISA样本集中,根据其所在城市区域的大小和空间分布总共选取了5000个ISA样本与4.2节中城市区域外部的非ISA样本合并组成城市区域外部的训练样本集,其空间分布如图8(a)。因为在4.3.1中已提取出大部分的ISA信息,而城市区域外部范围较大且包含的ISA像元相对较少,实验中仅采用决策树分类器进行一次分类流程完成本区域的ISA提取,再与4.3.1的提取结果合并,得到整幅影像范围的ISA提取结果如图9(b)所示。最后在城市区域外部提取结果中随机选取了5000个测试样本与NLCD数据进行对比,统计ISA提取精度如表3所示。
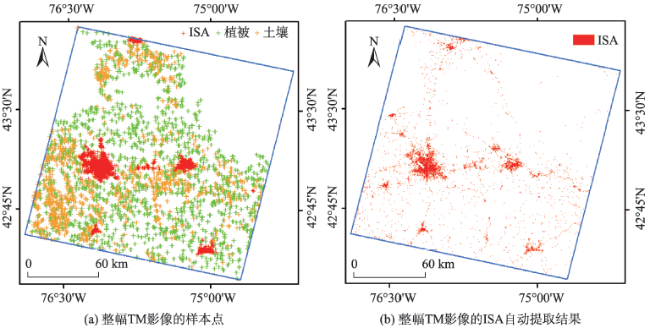
Fig. 9 The result of ISA automatic extraction within entire Landsat 5 TM image

图9 整幅TM影像范围的ISA自动提取结果

Tab. 3 Statistics of ISA extraction results within external urban areas

表3 城市区域外部ISA提取结果的精度统计(%)

ISA制图精度 ISA用户精度 非ISA制图精度 非ISA用户精度 总体
精度
Kappa
系数
城区外部 72.09 68.43 82.11 84.54 78.6 0.54
城区外部-人工采样 72.86 64.43 81.38 86.63 78.69 0.52
实验结果表明本方法利用城市区域内部的ISA样本能够实现对城市区域外部的ISA提取,并达到与人工采样方法相似的提取精度。提取结果具备较为完善的空间形态,但在部分非ISA密度较高区域的ISA提取结果形态不连续,并且存在一定程度的ISA误提取,这类误分是由于在城市区域外部地表覆盖类型更为复杂,需要增加样本的类别和引入其他的参考数据来优化提取精度。

5 结论与讨论

本文提出的方法整合夜间灯光影像和Landsat TM影像中的空间和光谱信息,实现了对整幅影像范围内的ISA自动化提取,这是相对于以往研究依赖于人工选取样本的一个重要改进。实验结果证明,本方法较好地解决了ISA与土壤存在光谱混淆的问题,提取精度较高且稳定;通过与NLCD测试数据进行比较,在城市区域的平均总体精度与kappa系数分别为88.23%和0.63;在城市区域外部为78.6%和0.54,均优于采样人工采样方法的提取精度。由于本文研究目标偏重针对ISA自动提取流程的实现而非提升提取精度,在进一步的研究中可通过优化分类特征(如加入空间特征)及改进分类算法来提高ISA提取精度。
从方法本身角度,后续的改进主要可以从以下角度考虑:① 通过建立一个全局尺度上样本库优化ISA样本的选取;② 引入更多的参考数据来提高分类的精度,如整合Openstreet的道路数据将有助于得到更完整的不透水面的空间结构,整合DEM数据可以对城市区域的分布范围进行区分等;③ 此外,本方法也可以选用更高分辨率的数据及选择面向对象的分类方法来进行。总之,本文对于实现不透水面自动提取流程已实现了具有创新性的研究,但对于建立能够实用化生产的具体方法还需进一步研究。

The authors have declared that no competing interests exist.

[1]
王浩,吴炳方,李晓松,等.流域尺度的不透水面遥感提取[J].遥感学报,2011,15(2):388-400.一个地区的不透水面覆盖度不仅是该地区城镇化程度重要指示因子,也是该地区生态环境状况的重要指示因子。现有的不透水面遥感提取方法,多集中在城区尺度上。而流域尺度上快速、准确的不透水面遥感提取方法在国内外还鲜有研究。本研究以覆盖海河流域同一季节的Landsat影像为数据源,利用已有土地利用数据集中的道路、城市、农村和工业用地对非不透水区进行掩膜,通过选取亮暗植被、高低反照度不透水面、干湿土壤端元,采用多端元光谱混合分解模型提取了流域尺度上的不透水面。精度评价结果显示,该方法估算的不透水面与真实结果之间的平均相对误差为12.1%,相关系数为0.83,精度较高,适合于流域尺度的不透水面提取。

DOI

[ Wang H, Wu B F, Li X S, et al.Extraction of impervious surface in Hai Basin using remote sensing[J]. Journal of Remote Sensing, 2011,15(2):388-400. ]

[2]
匡文慧,刘纪远,陆灯盛.京津唐城市群不透水地表增长格局以及水环境效应[J].地理学报,2011,66(11):1486-1496.

[ Kuang W H, Liu J Y, Lu D S.Pattern of impervious surface changes and its effect on water environment in the Beijing-Tianjin-Tangshan metropolitan area[J]. Acta Geographica Sinica, 2011,66(11):1486-1496. ]

[3]
王靓,孟庆岩,吴俊,等.2005-2014年北京市主要城建区热岛强度时空格局分析[J].地球信息科学学报,2015,17(9):1047-1054.本文利用LANDSAT-8数据计算距离加权不透水面聚集密度,以城市聚类算法提取北京市主要城建区范围。并用2005-2014年MODIS 8天合成地表温度产品,以主要城建区面积150%的周边区域作为边缘区,计算城建区与边缘区平均温度差值为热岛强度;分析北京市主要城建区热岛强度年内时序变化;依据地表温度与当月平均热岛强度对热岛强度进行等级划分,统计不同热岛强度等级出现频率,分析其空间分布特征及与不透水面聚集密度的相关性。结果表明:(1)年内1-12月热岛强度随边缘区平均温度变化显示较好的规律性,白天为逆时针分布,夜间为顺时针分布;(2)白天热岛强度等级以2、3级为主,春、夏季中南部为三级热岛强度高发区;夜间呈现由外围向中心的&#x0201c;环状递增&#x0201d;特征,高等级热岛强度出现的频率由外围向中心不断递增;(3)不透水面聚集密度对白天不同等级热岛强度出现频率影响显著,1-4级热岛强度出现频率,随不透水面聚集密度增加而增加,不透水面聚集密度达到50%后的影响趋于减弱。

DOI

[ Wang L, Meng Q Y, Wu J, et al.Monitoring and analyzing spatiotemporal changes of heat island intensity in Beijing main urban construction area from 2005 to 2014[J]. Journal of Geo-Information Science, 2015,17(9):1047-1054. ]

[4]
李德仁,罗晖,邵振峰.遥感技术在不透水层提取中的应用与展望[J].武汉大学学报·信息科学版,2016,41(5):569-577,703.

[ Li D R, Luo H, Shao Z F.Review of impervious surface mapping using remote sensing technology and its application[J]. Geomatics and Information Science of Wuhan University, 2016,41(5):569-577,703. ]

[5]
Wu C, Murray A T.Normalized spectral mixture analysis for monitoring urban composition using ETM+ imagery[J]. Remote Sensing of Environment, 2004,93(4):480-492.

[6]
Weng Q, Lu D.A sub-pixel analysis of urbanization effect on land surface temperature and its interplay with impervious surface and vegetation coverage in Indianapolis, United States[J]. International Journal of Applied Earth Observation and Geoinformation, 2008,10(1):68-83.This study developed an analytical procedure based upon a spectral unmixing model for characterizing and quantifying urban landscape changes in Indianapolis, Indiana, the United States, and for examining the environmental impact of such changes on land surface temperatures (LST). Three dates of Landsat TM/ETM+ images, acquired in 1991, 1995, and 2000, respectively, were utilized to document the historical morphological changes in impervious surface and vegetation coverage and to analyze the relationship between these changes and those occurred in LST. Three fraction endmembers, i.e., impervious surface, green vegetation, and shade, were derived with an unconstrained least-squares solution. A hybrid classification procedure, which combined maximum-likelihood and decision-tree algorithms, was developed to classify the fraction images into land use and land cover classes. Correlation analyses were conducted to investigate the changing relationships of LST with impervious surface and vegetation coverage. Results indicate that multi-temporal fraction images were effective for quantifying the dynamics of urban morphology and for deriving a reliable measurement of environmental variables such as vegetation abundance and impervious surface coverage. Urbanization created an evolved inverse relationship between impervious and vegetation coverage, and brought about new LST patterns because of LST's correlations with both impervious and vegetation coverage. Further researches should be directed to refine spectral mixture modeling by stratification, and by the use of multiple endmembers and hyperspectral imagery.

DOI

[7]
Powell S L, Cohen W B, Yang Z, et al.Quantification of impervious surface in the Snohomish Water Resources Inventory Area of Western Washington from 1972-2006[J]. Remote Sensing of Environment, 2008,112(4):1895-1908.A 3402year time series (1972–2006) of Landsat imagery for a portion of Snohomish and King Counties, Washington (the Snohomish Water Resource Inventory Area (WRIA)) was analyzed to estimate the amount of land that was converted into impervious surface as a result of urban and residential development. Spectral unmixing was used to determine the fractional composition of vegetation, open, and shadow for each pixel. Unsupervised and supervised classification techniques were then used to derive preliminary land cover maps for each time period. Digital orthophotos were used to create agricultural, forest management, high elevation, and riparian masks. In conjunction with established Urban Growth Areas (UGAs), these masks were utilized for the application of spatial rules that identified impervious surface as a surrogate for urban and residential development. Temporal rules, that minimized classification error, were developed based on each pixel's classified trajectory over the time series of imagery. Overall cross-date classification accuracy for impervious v. non-impervious surface was 95%. The results of the analysis indicate that the area of impervious surface in the Snohomish WRIA increased by 255% over 3402years, from 328502ha in 1972 to 11,65202ha in 2006. This approach demonstrates the unique value of the 3502year Landsat archive for monitoring impervious surface trends in rapidly urbanizing areas.

DOI

[8]
Wu C, Normalized spectral mixture analysis for monitoring urban composition using ETM+ imagery[J]. Remote Sensing of Environment, 2004,93(4):480-492.

[9]
Yang L, Huang C, Homer C, et al.An approach for mapping large-area impervious surfaces: synergistic use of Landsat-7 ETM+ and high spatial resolution imagery[J]. Canadian Journal of Remote Sensing, Canadian Aeronautics and Space Institute, 2003,29(2):230-240.A wide range of urban ecosystem studies, including urban hydrology, urban climate, land use planning, and resource management, require current and accurate geospatial data of urban impervious surfaces. We developed an approach to quantify urban impervious surfaces as a continuous variable by using multisensor and multisource datasets. Subpixel percent impervious surfaces at 30-m resolution were mapped using a regression tree model. The utility, practicality, and affordability of the proposed method for large-area imperviousness mapping were tested over three spatial scales (Sioux Falls, South Dakota, Richmond, Virginia, and the Chesapeake Bay areas of the United States). Average error of predicted versus actual percent impervious surface ranged from 8.8 to 11.4%, with correlation coefficients from 0.82 to 0.91. The approach is being implemented to map impervious surfaces for the entire United States as one of the major components of the circa 2000 national land cover database.

DOI

[10]
高志宏,张路,李新延,等.城市土地利用变化的不透水面覆盖度检测方法[J].遥感学报, 2010,14(3):593-606. ]通过分析城市中不透水面数量和分布的变化与城市土地利用变化之间的对应关系,综合中、高分辨率遥感数据各自的优势,运用CART算法进行城市不透水面覆盖度(ISP)遥感估算,基于ISP制图结果对城市土地利用变化进行检测.以山东省泰安市为例开展实验研究,结果表明,与传统的变化检测方法相比,基于ISP的变化检测方法,不仅能够反映土地利用类型转换的潜在信息,而且可以灵活地量化定义和解释城市用地变化情况.这种方法为城市土地利用变化信息的提取和分析提供了一种新的思路,可以作为现有变化检测方法的有益补充.

DOI

[ Gao Z H, Zhang L, Li X Y, et al. Detection and analysis of urban land use changes through multi-temporal impervious surface mapping[J]. Journal of Remote Sensing, 2010,14(3):593-606. ]

[11]
Esch T, Himmler V, Schorcht G, et al.Large-area assessment of impervious surface based on integrated analysis of single-date Landsat-7 images and geospatial vector data[J]. Remote Sensing of Environment, 2009,113(8):1678-1690.Driven by a constantly accelerating increase of urban population in recent decades urban sprawl has become one of the most dynamic processes in the context of global land use transformations. The expansion of urban agglomerations is closely associated with a substantial increase of impervious surface. In Europe, methods for an accurate, fast and cost-effective mapping and assessment of impervious surface on a state-wide or national scale have not been established so far. This study presents an approach for estimating the impervious surface based on a combined analysis of single-date Landsat images and road network and railway vector data using Support Vector Machines and functionalities of geographic information processing. The modeling aims at the provision of data on the impervious surface for the total of residential, industrial and transportation-related areas. The derived information is provided for the administrative units of communities. The output of the procedure is a vector data file providing the ‘percent impervious surface of built-up areas’ (PIS B ) and the ‘percent impervious surface of the total of built-up and transportation-related areas’ (PIS BT ) for the administrative units of communities. The developed method is tested for a study area covering almost one third of the German territory. The results prove the suitability of the approach for a widely automated and area-wide mapping of impervious surfaces. Using reference data sets of three cities (Leipzig, Ludwigshafen, Passau) we realized a mean absolute error of 19.8% and an average error of 6.4% for the percent impervious surface modeled on the basis of the Landsat images. The final product resulting from a combination of the imperviousness raster derived from the satellite images with the transportation-related vector information showed a mean difference of 1% to 4% compared to corresponding reference data and results of previous studies. For the year 2000 our research shows that 45.3% of the area occupied by settlements and transport infrastructure in the German federal state of Bavaria, 44.6% in the state of Baden-Württemberg and 42.6% in the state of Saxony was covered by impervious surface.

DOI

[12]
Luo L, Mountrakis G.Integrating intermediate inputs from partially classified images within a hybrid classification framework: An impervious surface estimation example[J]. Remote Sensing of Environment, 2010,114(6):1220-1229.With the constant proliferation of computational power, our ability to develop hybrid classifiers has improved. Hybrid classifiers integrate results from multiple algorithms and often improve classification accuracy. In this paper, a hybrid classification framework was used to evaluate two research hypotheses: i) can manipulated results from prior classifiers (鈥渋ntermediate inputs鈥 (IIs)) improve classification accuracy in subsequent classification steps. and ii) is there an optimal dataset proportion for creation and usage of intermediate inputs. These additional intermediate inputs were based on spatial and texture statistics calculated on a partially classified image. The implementation of intermediate inputs on an impervious surface classification task using a 2001 Landsat ETM+ image from central New York was demonstrated. The results suggested that there was an average accuracy improvement of 3.6% (maximum 6.6%) by using intermediate inputs. These improvements were proved statistically significant by a Z-test and tended to increase as classification difficulty increased. The experiments in this paper also showed that there was an optimal point that balanced the number of pixels and pixel classification accuracy from prior steps used to produce intermediate inputs. Additionally, some traditional problems such as separation of impervious surfaces and soil were successfully tackled through intermediate inputs. The concept of the intermediate inputs may easily apply to other sensors and/or ground features.

DOI

[13]
Mountrakis G, Luo L.Enhancing and replacing spectral information with intermediate structural inputs: A case study on impervious surface detection[J]. Remote Sensing of Environment, 2011,115(5):1162-1170.This paper assessed the incorporation of road structural information in the classification process of impervious surface areas. A multi-process classification model was adopted and it consisted of an a priori classifier and an a posteriori classifier. The role of the a priori classifier was to classify the relatively simple portions of the image. This partial classification acted as the basis for the production of linear features using an iterative Radon transform. Spatial statistics derived from the linear features led to road structural intermediate inputs (RSIIs) (for example, distance to the closest segment endpoint). RSIIs were integrated with spectral information on the remaining unclassified pixels and an assessment was done to evaluate whether they would improve a binary impervious classification task. The experimental results on a 2006 Landsat ETM+ image suggested that classification accuracy improved by 8.4% for the portion of the dataset classified with the a posteriori classifier and led to an improvement of 3.2% over the entire dataset. In addition, a more challenging and wide-reaching hypothesis was tested, namely whether RSIIs could completely replace spectral information in portions of the image instead of complementing it. Exclusive use of RSIIs matched or improved classification accuracy obtained solely from spectral information, even when more than half of the validation dataset was forwarded to the a posteriori classifier. This finding offers an important contribution to the remote sensing community, since the proposed methodology handles the missing spectral information problem through exclusive analysis of the given degraded image; no external information, such as spectral information from other times and/or vector data, is needed.

DOI

[14]
邵振峰,张源,周伟琪,等.基于测绘卫星影像的城市不透水面提取[J].地理空间信息,2016,14(7):1-5.

[ Shao Z F, Zhang Y, Zhou W Q, et al.Urban imperviousness extraction method based on cartographic satellite image[J]. Geospatial Information, 2011,115(5):1162-1170. ]

[15]
Xian G, Homer C, Dewitz J, et al.The change of impervious surface area between 2001 and 2006 in the conterminous United States[J]. Photogrammetric Engineering and Remote Sensing, 2011,77(8):758-762.No abstract available]

[16]
Xian G, Homer C.Updating the 2001 national land cover database impervious surface products to 2006 using landsat imagery change detection methods[J]. Remote Sensing of Environment, 2010,114(8):1676-1686.A prototype method was developed to update the U.S. Geological Survey (USGS) National Land Cover Database (NLCD) 2001 to a nominal date of 2006. NLCD 2001 is widely used as a baseline for national land cover and impervious cover conditions. To enable the updating of this database in an optimal manner, methods are designed to be accomplished by individual Landsat scene. Using conservative change thresholds based on land cover classes, areas of change and no-change were segregated from change vectors calculated from normalized Landsat scenes from 2001 and 2006. By sampling from NLCD 2001 impervious surface in unchanged areas, impervious surface predictions were estimated for changed areas within an urban extent defined by a companion land cover classification. Methods were developed and tested for national application across six study sites containing a variety of urban impervious surface. Results show the vast majority of impervious surface change associated with urban development was captured, with overall RMSE from 6.86 to 13.12% for these areas. Changes of urban development density were also evaluated by characterizing the categories of change by percentile for impervious surface. This prototype method provides a relatively low cost, flexible approach to generate updated impervious surface using NLCD 2001 as the baseline.

DOI

[17]
徐涵秋. 一种快速提取不透水面的新型遥感指数[J].武汉大学学报·信息科学版,2008,33(11):1150-1153.

[ Xu H Q.A new remote sensing index for fastly extracting impervious surface information[J]. Geomatics and Information Science of Wuhan University, 2008,33(11):1150-1153. ]

[18]
Song C, Woodcock C E, Seto K C, et al.Classification and Change Detection Using Landsat TM Data: When and How to Correct Atmospheric Effects?[J]. Remote Sensing of Environment, 2001,75(2):230-244.The electromagnetic radiation (EMR) signals collected by satellites in the solar spectrum are modified by scattering and absorption by gases and aerosols while traveling through the atmosphere from the Earth's surface to the sensor. When and how to correct the atmospheric effects depend on the remote sensing and atmospheric data available, the information desired, and the analytical methods used to extract the information. In many applications involving classification and change detection, atmospheric correction is unnecessary as long as the training data and the data to be classified are in the same relative scale. In other circumstances, corrections are mandatory to put multitemporal data on the same radiometric scale in order to monitor terrestrial surfaces over time. A multitemporal dataset consisting of seven Landsat 5 Thematic Mapper (TM) images from 1988 to 1996 of the Pearl River Delta, Guangdong Province, China was used to compare seven absolute and one relative atmospheric correction algorithms with uncorrected raw data. Based on classification and change detection results, all corrections improved the data analysis. The best overall results are achieved using a new method which adds the effect of Rayleigh scattering to conventional dark object subtraction. Though this method may not lead to accurate surface reflectance, it best minimizes the difference in reflectances within a land cover class through time as measured with the Jeffries鈥揗atusita distance. Contrary to expectations, the more complicated algorithms do not necessarily lead to improved performance of classification and change detection. Simple dark object subtraction, with or without the Rayleigh atmosphere correction, or relative atmospheric correction are recommended for classification and change detection applications.

DOI

[19]
范俊甫,马廷,周成虎,等. 1992-2010年基于DMSP-OLS图像的环渤海城市群空间格局变化分析[J].地球信息科学学报,2013,15(2):280-288.从DMSP-OLS数据提取城市区域的经验阈值法存在固有的缺陷, 经验阈值对不同的空间区域不具备通用性, 不适用的经验阈值, 将导致城区面积提取具有较大误差, 可采用统计数据对经验阈值进行修正以降低误差。本文在大时空尺度条件下以少量样本城市的统计数据对经验阈值方法进行了修正;另采用Elvidge二次多项式模型对DMSP-OLS时间序列数据进行了校正。在此基础上选取总斑块数量、景观总面积、平均斑块大小、最大斑块面积比、斑块密度、景观形状指数、总边界长度、平均边界密度和斑块平均回旋半径共9个景观生态学指标, 采用FRAGSTATS 3.3软件计算分析了1992-2010年环渤海区域城市发展的空间格局变化特征。结果表明:1992-2010年间, 环渤海区域城市化进程持续较快发展, 城市建成区总面积增加了2.14倍, 平均城市建成区面积增加了76%, 提取到的城市斑块平均回旋半径增加了约26.5%, 并且城市景观斑块的复杂度明显上升, 可检测到的城镇总个数增加了82%。但是, 每100km2内孤立的城市景观斑块数却降低了约76%;大城市持续扩张的相对速度慢于中小城市, 城市区域边界密度和整体城市分布景观格局破碎度逐渐降低, 核心城市与周围卫星城市的景观斑块的联通性逐步增加。

DOI

[ Fan J F, Ma T, Zhou C H, et al.Changes in spatial patterns of urban landscape in Bohai Rim from 1992 to 2010 using DMSP-OLS data[J]. Journal of Geo-Information Science, 2013,15(2):280-288. ]

[20]
Otsu N.A threshold selection method from gray-level histograms[J]. IEEE Transactions on Systems, Man and Cybernetics, 1979,9(1):62-66.

Outlines

/