A Comparative Study of Different Red Edge Indices for Remote Sensing Detection of Urban Grassland Health Status

  • FANG Canying , 1, 2 ,
  • WANG lin , 1, 3, * ,
  • XU Hanqiu 1, 2, 3
Expand
  • 1. College of Environment and Resources, Fuzhou University, Fuzhou 350116, China
  • 2. Key Laboratory of Spatial Data Mining & Information Sharing of Ministry of Education, Fuzhou University, Fuzhou 350116, China
  • 3. Institute of Remote Sensing Information Engineering, Fuzhou University, Fuzhou 350116, China
*Corresponding author: WANG Lin, E-mail:

Received date: 2017-05-24

  Request revised date: 2017-08-04

  Online published: 2017-10-20

Copyright

《地球信息科学学报》编辑部 所有

Abstract

Being an important part of the green space system, urban grassland has played a significant role in landscaping environment, regulating microclimate and preventing soil from erosion. Therefore, it is of great importance to monitor the health status of urban grassland timely and efficiently. Remote sensing technique has been widely used for assessing vegetation growth status for decades. Numerous studies have found that red edge indices are closely related to the important biochemical parameters of green plants. Thus, they can be regarded as important indicators for monitoring health status of vegetation. However, there is no explicit conclusion about which index is more suitable for monitoring the health status of urban grasslands among the existing red edge indices. The European Sentinel-2A satellite was successfully launched in late June 2015, aiming to replace and improve the old generation of satellite sensors of high resolution (i.e. Landsat and SPOT), with improved spectral capabilities. The multispectral instrument (MSI) of Sentinel-2 has made available a set of 13 spectral bands ranging from visible (VIS) and near infrared (NIR) to shortwave infrared (SWIR), featuring four bands at 10 m, six bands at 20 m, and three bands at 60 m of spatial resolution. In comparison to the previous sensors, Sentinel-2 incorporates three new spectral bands in the red-edge region centered at 705, 740 and 783 nm, providing an opportunity for assessing red-edge spectral indices for monitoring the health status of urban grasslands. For this reason, the main objective of this paper is to find a red edge index that is more suitable for evaluating the growth status of urban grassland based on Sentinel-2A sensor data. Taking the urban grasslands in Fuzhou and Xiamen cities, Southeastern China, as examples, we firstly investigated the spectral responsive characteristics of grasslands in different health status using Sentinel-2A images dated on June 23, 2016 and August 22, 2016, respectively for Fuzhou and Xiamen. On this basis, six red edge indices related to grassland chlorophyll content were then selected to test their efficiency in detecting grassland health status. These are the red edge position (REP), the terrestrial chlorophyll index (MTCI), the normalized difference red edge index (NDRE1), the novel inverted red-edge chlorophyll index (IRECI), the red-edge chlorophyll index (CIred-edge) and the modified chlorophyll absorption ratio index (MCARI2). Furthermore, independent sample T test and Euclidean distance methods were employed to evaluate the performance of the selected indices in the detection of grassland health status. Results showed that the six red edge indices had different performances. They have different degrees of sensitivity to the changes of grassland health status. In general, the IRECI was the most sensitive to the grassland health status among the six indices in the two study areas. The index can reveal significant differences in the numerical range and mean values between grasslands with different health status. The overall accuracy of the index is greater than 85% with a kappa coefficient exceeding 0.8 both in Fuzhou and Xiamen cases. The NDRE1 and MCARI2 indices ranked the second and third, while the other three indices were unable to effectively detect the health status of the grasslands. Accordingly, the IRECI is the optimal red edge index for evaluating the grassland health status using Sentinel-2A imagery.

Cite this article

FANG Canying , WANG lin , XU Hanqiu . A Comparative Study of Different Red Edge Indices for Remote Sensing Detection of Urban Grassland Health Status[J]. Journal of Geo-information Science, 2017 , 19(10) : 1382 -1392 . DOI: 10.3724/SP.J.1047.2017.01382

1 引言

城市草地具有美化环境、净化空气、保持水土、调节小气候等功能,是城市绿地系统的重要组成部分[1-2]。近年来,随着生态园林城市建设的推进,越来越多的草地分布于城市中心广场和居民社区间,成为了城市绿化的一大景观。然而,城市草地易种难养,后期养护成本高,一旦养护跟不上,很容易使草地荒废[3]。因此,快速、准确地监测草地的健康状况,对城市草地的科学养护具有重要的意义。
近年来,遥感信息技术以其实时、快速、宏观等优势,已成为监测植被生长状况的重要手段。绿色植物的光谱特性及其差异、变化是实现植被健康遥感判别的理论依据[4]。研究发现介于红光和近红外光谱范围内的红边区域,与表征绿色植物生长状况的重要生化参数之间有很好的相关关系,是指示绿色植物生长状况的敏感性波段[5-11]。为此,国内外学者相继提出了地面叶绿素指数 (Terrestrial Chlorophyll Index,MTCI)[12]、归一化差值红边指数(Normalized Difference Red Edge Index,NDRE)[13]、修正性叶绿素吸收指数(Modified Chlorophyll Absorption Ratio Index,MCARI2)[14]等多种红边指数(Red edge Index)来监测绿色植物的生长状况。但这些红边指数在城市草地生长状况监测中的适用性如何?哪个指数最能反映出草地的健康水平?迄今仍无明确的答案。此外,现有的多光谱卫星缺乏红边波段,因此难以应用这些红边指数来有效地监测植被的生长状况。近年来发射的RapidEye和Worldview系列卫星虽然设置有红边波段,但由于仅有1个波段,使这些红边指数在实际应用中受到很大的局限[15]。可喜的是,欧空局(ESA)新近发射了Sentinel-2A卫星,它除了传统的可见光、近红外、短波红外波段外还增设了3个红边波段,为红边指数的应用提供了重要的基础。目前,Sentinel-2A数据已在作物叶绿素反演、农作物分类、生物量估算等方面得到了成功的应用[16-18],如Vincini等[16]以Sentinel-2A影像为数据源,建立了冬小麦叶绿素含量的估算模型;Immitzer等[17]研究表明Sentinel-2A新增的红边波段有助于区分不同的农作物,在作物分类方面具有广阔的应用前景;郑阳等[18]基于Sentinel-2A数据,利用多种红边指数构建了冬小麦地上生物量反演模型。但在城市草地健康状况监测的应用研究还鲜有报道,而且在国内,对Sentinel-2A影像的应用研究也还很少。
鉴于此,本文基于Sentinel-2A遥感影像,以福州市和厦门市的城市草地为研究对象,旨在通过多种红边指数在草地健康状况判别的对比研究,寻找出最适用于城市草地生长状况监测的红边指数,以及时、快速、准确地监测草地健康状况;同时也为Sentinel-2A数据在城市生态方面的应用潜力提供科学的参考依据。

2 研究区概况及研究方法

2.1 研究区概况

本文选择福建省福州市和厦门市为试验区 (图1)。福州市是福建省省会,地处中国东部沿海,台湾海峡西岸,地理位置为25°15′~26°39′ N, 118°08′~120°31′ E。福州市为典型的亚热带季风气候,年平均降水量为900~2100 mm,年平均气温为16~20 ℃。厦门市是中国最早实行对外开放的4个经济特区之一,位于福建省东南部,九龙江入海口处,地理位置为24°26′~26°28′ N,118°03′~118°13′ E,同属于亚热带季风气候,年平均降水量在1200 mm左右,年平均气温约为21 ℃。2个研究区的地带性 植被均为南亚热带季风常绿阔叶林,区内城市绿化植被类型多以次生植物为主,包括乔木、灌丛和草地。
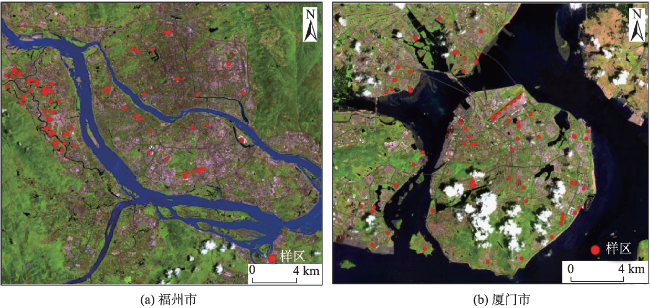
Fig. 1 Sentinel-2A images of Fuzhou and Xiamen (Red dots are the sample locations)

图1 福州市和厦门市Sentinel-2A影像(红点为草地样区)

2.2 数据源及影像预处理

本研究以Sentinel-2A作为遥感数据源。Sentinel-2A是Sentinels系列卫星之一,该卫星于2015年6月23日从法国圭亚那库鲁航天中心发射成功,同年起,数据向用户免费开放。该卫星搭载的多光谱成像仪(MSI)设有13个光谱波段,不同波段的空间分辨率略有不同,其中4个波段的空间分辨率为10 m,6个波段的分辨率为20 m,其余3个波段的分辨率为60 m(表1)。另外,它所具有的12 bit辐射分辨率,10 d重访周期,290 km幅宽及免费下载等优点,使其综合性能远超同为10 m分辨率的SPOT-5影像。
本文采用的Sentinel-2A影像下载于欧空局Sentinel科学数据中心(https://scihub.copernicus.eu)。福州市和厦门市2幅影像的成像时间分别为2016年6月23日和2016年8月22日,产品等级为1C级。
在影像预处理上,根据Sentinel-2A官方技术手册及相关的数据说明,1C级产品已经做过几何精校正,并通过辐射校正将影像的亮度值(DN)转为大气顶部反射率(TOA),但该过程并未消除大气的影响[19]。因此,用户获得1C级产品后可基于欧空局2016年发布的遥感影像处理软件SEN2COR (http://step.esa.int/main/third-party-plugins-2/sen2cor/),利用其内置的算法和参数将1C级产品转换为2A级,得到地表反射率,详细的步骤可见其用户手册[20]。为了数据的分发方便,Sentinel-2A 数据的1C和2A级产品都将所得到的反射率乘以一个固定的系数,并以16 bit整型保存,该系数的默认值为10 000 (可从头文件的QUANTIFICATTION_Value语句中查得)[21]。本次研究首先在SEN2COR平台上将 Sentinel-2A 1C级产品转为2A级,然后将其各波段的DN值除以10 000,还原为地表反射率。相应的计算公式如下:
ρ λ = Q cal / 10 000 (1)
式中:ρλ为λ波段的地表反射率;Qcal为影像以16 bit量化的DN值。
Tab. 1 The main parameters of multi-spectral bands of Sentinel-2A

表1 Sentinel-2A影像多光谱波段主要参数信息

波段号 波段 中心波长/nm 波段宽度/nm 空间分辨率/m
1 Coastal 443 20 60
2 Blue 490 65 10
3 Green 560 35 10
4 Red 665 30 10
5 Red edge 705 15 20
6 740 15 20
7 783 20 20
8 NIR-1 842 115 10
8b NIR-2 865 20 20
9 Water vapor 945 20 60
10 Cirrus 1375 30 60
11 MIR-1 1610 90 20
12 MIR-2 2190 180 20

2.3 研究方法

本研究结合近同期Google Earth高分辨率遥感影像,从福州市和厦门市各选取了89和75块较纯净、均一的草地作为研究对象。基于外业实地考察情况,将草地健康状况划分为好、中、差3个等级。选取各个健康等级的草地作为训练样本,研究其光谱响应特征;然后根据它们的特征差异选择与草地健康状况密切相关的红边指数作为评价因子。在此基础上,分别计算出所选取的红边指数在各健康等级草地的统计特征数据(均值、方差等)和欧式距离,以定量对比不同红边指数评价草地健康状况的准确性。
2.3.1 训练样本的选择
实地调查发现,健康草地生长旺盛,植株茂密,叶片以绿色为主,在影像上呈现鲜绿色;中等健康程度的草地,叶片绿度有所下降,植株较低,因而在影像上表现出暗绿色;而不健康的草地则表现为植株矮小稀疏、叶片枯黄,覆盖度低,在影像上显示出黄绿色(图2)。据此,按照代表性和均匀性原则,在所选取的草地样地中采集符合以上各健康等级特征、光谱均匀的草地作为训练样本,并通过实地考察或结合近同期Google Earth高分辨率影像逐一验证。其中,福州市好、中、差样本数分别为24、23和24个;厦门市分别为20、17和19个。
2.3.2 不同健康等级草地的光谱特征分析
研究表明,当植物衰老或遭受胁迫时,体内的生化参数会发生明显变化,进而使其光谱响应曲线发生改变[22]。在可见光范围内,健康植被的反射光谱特征主要取决于各种色素,其中叶绿素的吸收占主导地位;在红边范围内,健康植被的反射率急剧升高,形成一个明显的陡坡,这主要受叶绿素含量、冠层结构变化等的影响,陡坡斜率越大说明植被越健康;在近红外光谱范围内,由于海绵叶肉细胞的散射作用,健康植被表现出高反射;短波红外处,植被的反射率则与其叶片的含水量相关[23-24]
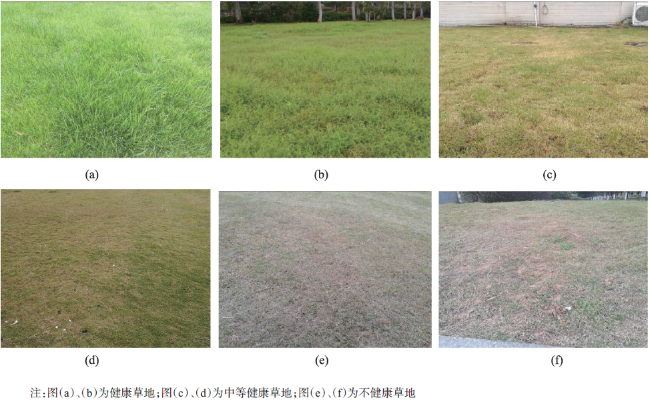
Fig. 2 Grasslands in different health status

图2 不同健康等级的草地

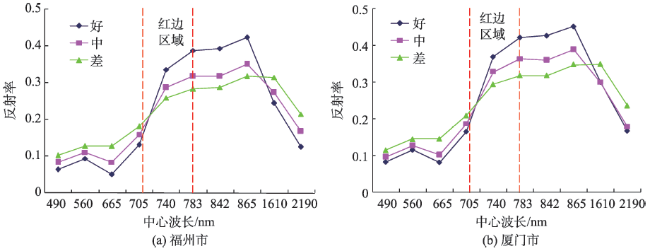
Fig. 3 Spectral signatures of grasslands in different health status

图3 不同健康等级草地的光谱曲线

分别统计各健康等级样本在Sentinel-2A影像各波段的均值,并绘制出它们的光谱曲线(图3)。从图中可以看出,不同健康等级草地的光谱响应特征差异明显,主要表现为:① 在可见光范围内,健康草地的光谱曲线有明显的“绿峰”和“红谷”,而中等和不健康的草地叶绿素含量降低,吸收减弱,导致在665 nm处红谷的谷底逐渐抬升。② 健康草地在红光到近红外范围内反射率急剧升高,红边陡坡效应明显;不健康草地叶片稀疏,叶绿素含量下降,使其在红边处不形成明显的陡坡,红边斜率较小,在近红外波段处的反射率也明显降低。③ 中红外波段处,不健康草地因叶片含水量降低,导致其反射率高于健康草地,与近红外波段的差距明显小于健康草地。
2.3.3 红边指数及其计算
以上分析表明,光谱特征的差异综合反映了不同健康水平草地在叶绿素和叶片水分含量等参数的不同,而这些参数又密切相关,其中一个参数的变化也将引起其他参数发生改变,从而影响草地的健康状况,因此,对植物叶绿素敏感度较高的红边指数可被用来作为判别草地生长状况的因子。本文结合Sentinel-2A影像的光谱波段特点,选取了6种红边指数进行草地健康判别,包括红边位置(red edge position,REP)[25]、地面叶绿素指数(MTCI)[12]、归一化差值红边指数(NDRE1)[13]、新型倒红边叶绿素指数(novel inverted red-edge chlorophyll index,IRECI)[26]、红边叶绿素指数(red-edge chlorophyll index,CIred-edge[27-28]以及叶绿素吸收指数(MCARI2)[14]。由于NDRE1、MTCI、CIred-edge和MCARI2指数的提出是基于高光谱或MERIS遥感数据,所需用到的中心波长为750 nm和708.75 nm等波段的反射率在Sentinel-2A中无法获得,因此,采用最邻近波段处的反射率来代替。具体计算公式见表2
2.3.4 欧式距离计算
欧式距离是在样本相似性度量的基础上,通过一定的准则函数,把同类样本聚合,不同样本分离,可用来定量表征不同红边指数判别草地健康等级的能力。2种类型间的欧式距离越大,代表类型间的可分性越强,反之,则说明可分性越弱[29]。计算公式为:
d i , j = x i - x j σ i 2 + σ j 2 (2)
式中:di, j是第i类和第j类的欧式距离;xixj是第i类和第j类样本的平均值;σi2和σj2分别表示第i类和第j类样本的方差。

3 结果与分析

3.1 统计特征值差异分析

利用表2公式分别计算出6种红边指数,因各指数的量纲不统一,需对它们进行正规化,将数值统一到0-1之间,以便更好地对比分析。在此基础上,统计出福州市和厦门市各健康等级草地样本的统计特征值,然后利用独立样本T检验法来检验各健康水平草地的6种红边指数均值是否存在显著差异。为避免噪声对实验结果的干扰,本文采用样本均值加减1个标准差来界定每个健康等级草地的红边指数数值分布区间(图4)。总的来看,健康等级越高,相应的红边指数均值越大,表明这6种红边指数都可以反映草地的生化参数,指示草地的健康水平。但是,不同红边指数在不同健康等级草地的值域区间和均值存在明显差异。
Tab. 2 Red edge indices and their calculation formulas

表2 红边指数及其计算公式

指数 计算公式 对应的Sentinel-2A波段 描述 参考文献
REP REP=705+35×(0.5×(ρ665+ ρ783)-ρ705)/(ρ740705) B4、B7、B5、B6 红边范围内植被反射光谱曲线斜率最大的位置。当植物叶片的叶绿素含量增加时,REP向长波方向移动,反之则向短波方向移动[25] Guyot等[25]
MTCI MTCI = (ρ753.75708.75)/(ρ708.75681.25) B6、B5、B4 对植物叶片叶绿素含量较为敏感,其值越大代表叶绿素含量越高[12] Dash等[12]
NDRE1 NDRE1= (ρ750705)/(ρ750705) B6、B5 NDRE1是用红边的峰和谷来代替传统NDVI中的红光和近红外波段,可用于估算植物叶面积指数和叶绿素含量[13] Gitelson等[27]
IRECI IRECI = (ρ783665)/(ρ705740) B7、B4、B5、B6 该指数与植物冠层叶绿素含量和叶面积指数具有很好的相关关系,可定量表征植物的叶绿素含量[26] Frampton等[26]
CIred-edge CI red-edge= (ρ750-800690-725)-1 B7、B5 该指数与植物叶绿素,氮素含量具有显著的线性关系[27-28] Gitelson等[27-28]
MCARI2 MCARI 2= ((ρ750705)-0.2× (ρ750550)) ×(ρ750705) B6、B5、B3 该指数对植物中的叶绿素含量较为敏感,其值越大表示叶绿素含量越高[14] Wu等[14]
Tab. 3 p-values of independent-sample T test of red edge indices in different health status

表3 不同健康等级下红边指数的p

p REP MTCI NDRE1 IRECI CIred-edge MCARI2
福州市 好-中 0.000** 0.000** 0.000** 0.000** 0.000** 0.000**
好-差 0.000** 0.000** 0.000** 0.000** 0.000** 0.000**
中-差 0.174 0.011* 0.000** 0.000** 0.013* 0.000**
厦门市 好-中 0.001** 0.000** 0.000** 0.000** 0.000** 0.000**
好-差 0.000** 0.000** 0.000** 0.000** 0.000** 0.000**
中-差 0.012* 0.016* 0.000** 0.000** 0.000** 0.000**

注:**代表通过1%显著性检验;*代表通过5%显著性检验

在6种指数中,IRECI指数在福州市和厦门市的各健康水平草地的值域区间可以完全错开,不同等级间的均值差异显著(图4表3),可以较好地反映出草地的健康状况;NDRE1和MCARI2指数虽然在各健康等级草地的均值差异都通过了1%的显著性检验,但从数值范围上看,厦门市NDRE1指数的值域区间在各健康等级之间有小部分重叠,而在福州地区则表现较好;REP和MTCI 2个指数在各健康等级都有重叠,在中等和差的值域区间重叠更为明显,均值差异的显著性水平低于其他指数,表明它们无法很好地区别草地的健康状况。此外,CIred-edge指数在不同地区各健康等级草地的数值范围和均值差异性方面波动较大,说明该指数对草地健康状况的判别能力不稳定,可能有一定的区域性。
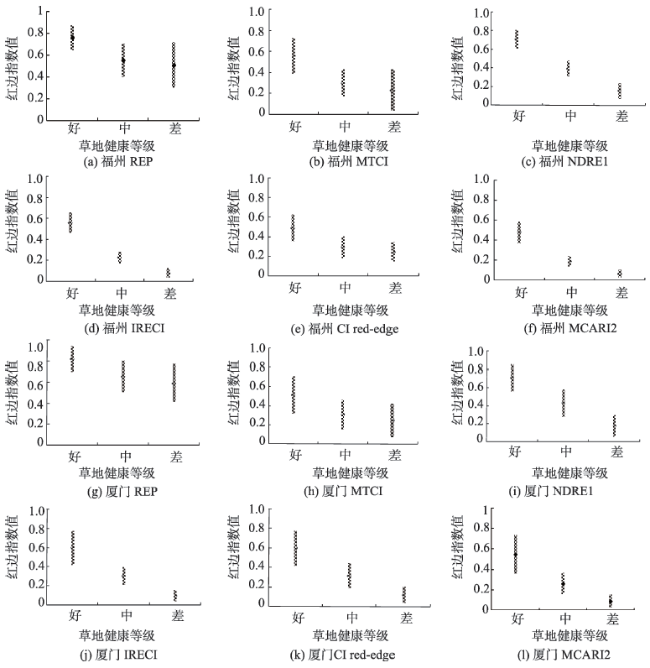
Fig. 4 The data range (mean±1 standard deviation) of red edge indices in different health status of grasslands

图4 不同健康等级草地的红边指数值域区间(均值±1标准差)

3.2 欧式距离差异比较

以上方法只能从其数值范围和检验p值来分析各健康等级草地的红边指数值是否存在显著性差异,若其均值差异同为显著性水平,那它们区分草地健康级别的能力是否存在差别呢?为此,本研究还引入了欧式距离来定量表征不同红边指数判别不同健康等级草地的能力,将各等级的欧式距离求和获得总的欧式距离,并据此排序(表4)。从排序综合来看,IRECI指数的总欧式距离最大,说明在6个指数中,该指数最容易判别草地的健康状况;NDRE1和MCARI2指数次之,它们在各健康等级草地的总欧式距离低于IRECI指数,但总体仍处于较高水平;REP和MTCI指数在各等级间的总欧式距离都很小,不同健康等级草地的可分性较弱;CIred-edge指数在福州市和厦门市的综合排序相同,但不难发现,该指数在福州市的欧式距离明显低于NDRE1和MCARI2指数,而在厦门市却差异不大,这再次说明了该指数区分草地健康等级的不稳定性。
Tab. 4 The statistics table of Euclidean distance

表4 欧式距离统计

红边指数 好-中 排序 中-差 排序 好-差 排序 总欧式距离 综合排序
福州市 IRECI 2.97 1 2.11 1 4.49 1 9.57 1
NDRE1 2.43 3 2.01 2 4.37 2 8.81 2
MCARI2 2.46 2 1.91 3 3.67 3 8.04 3
CIred-edge 1.13 5 0.33 4 1.47 4 2.93 4
MTCI 1.23 4 0.29 5 1.26 5 2.78 5
REP 1.12 6 0.18 6 1.07 6 2.37 6
厦门市 IRECI 1.49 1 1.93 1 2.71 2 6.13 1
MCARI2 1.35 2 1.45 2 2.64 3 5.44 2
NDRE1 1.32 3 1.29 3 2.81 1 5.42 3
CIred-edge 1.29 4 1.29 4 2.32 4 5.00 4
REP 0.88 5 0.27 5 1.06 5 2.21 5
MTCI 0.82 6 0.26 6 1.01 6 2.09 6

3.3 精度验证

分别统计各健康等级草地样本的红边指数均值,然后以2个等级均值间的中值为界,将草地划分为好、中和差3个等级。通过随机采样法,在福州市和厦门市的实验样区内分别选取198个和171个验证点,其中福州市的实地验证时间大致在Sentinel-2A影像获取日期后的半年之内,厦门市则借助近同期Google Earth高分辨率影像对分类结果进行判读验证。从表5的精度验证结果可知,福州市实验区内,各指数的分类精度从高到低依次为:IRECI> NDRE1> MCARI2> CIred-edge> MTCI> REP,厦门市实验区内的分类总精度则表现为IRECI> MCARI2> NDRE1> CIred-edge> REP > MTCI指数。可见,无论哪个地区,IRECI指数的分类精度始终最高且最为稳定,其判别总精度均在90%左右,Kappa系数也都大于0.8,进一步证实了IRECI比其它指数更适于草地健康评价;NDRE1和MCARI2指数的判别能力基本一致,二者的分类总精度相差不到2%,它们的判别总精度虽不及IRECI指数,但也都达到了80%以上,表明这2个指数也可以较好地区分不同健康水平的草地;CIred-edge指数的分类精度波动较大,厦门市实验区的总精度比福州市高出了8.8%,该指数的分类结果可能具有一定的地域差异;REP和MTCI 2个指数的分类精度均不到70%,难以反映草地的健康情况,尤其是在中等和差健康等级的草地中出现明显的错分情况。
图5以福州市和厦门市高尔夫球场为例,来说明不同红边指数在草地健康水平反演上的差异。从图中可以看出,IRECI指数反演的草地健康程度与原影像的格局十分吻合,代表不同健康状况草地的色彩差异明显,能直观反映出草地的健康水平;NDRE1和MCARI2的反演影像也能较好地体现草地健康状况的空间格局;而MTCI和REP影像格局与原影像相比,显得很不协调,绝大部分草地都为同一色调,无明显差异,而且在福州市,水体的指数值都很高,这显然与实际情况不符;CIred-edge指数影像在福州市无法反映出草地健康状况的空间分布格局,在厦门市则表现较好。综合来看,IRECI同样表现出最好的判别结果。
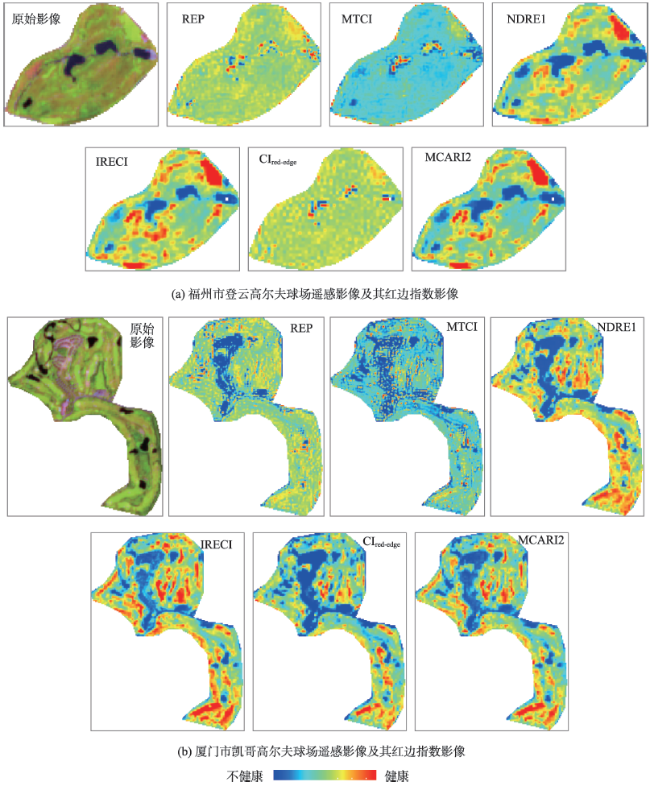
Fig. 5 Sentinel-2A images of golf courses in Fuzhou and Xiamen and their corresponding images of red edge indices

图5 福州市和厦门市高尔夫球场的遥感影像及其红边指数影像

Tab. 5 Accuracy validation of the health grade of grasslands

表5 草地健康等级判别精度验证

指数类型 福州市 厦门市
总精度/% Kappa系数 总精度/% Kappa系数
REP 62.12 0.4311 67.83 0.5195
MTCI 69.70 0.5480 63.16 0.4478
NDRE1 87.37 0.8103 83.62 0.7647
IRECI 91.41 0.8909 89.47 0.8419
CIred-edge 74.24 0.6167 83.04 0.7457
MCARI2 85.86 0.7876 84.79 0.7716

4 讨论

上述研究表明,基于Sentinel-2A影像提取的6种红边指数判别草地健康状况的能力有所不同。相比之下,IRECI指数的判别结果最优。由表2可知,IRECI指数不仅采用了草地在665 nm处的吸收波段和783 nm处的高反射波段,还充分利用了705 nm和740 nm这2个红边波段(705~740 nm范围内草地的红边陡坡效应最为明显),避免了红光波段易饱和问题,因而对草地健康状况的差异更为敏感。
MTCI、REP和CIred-edge 3个指数的判别结果不太理想,可能与以下几点原因有关:
(1)虽然已有研究通过模拟Sentinel-2数据表明MTCI和REP指数对小麦冠层叶绿素含量十分敏感[16],但本研究却发现它们在表征草地叶绿素含量,判别草地健康状况方面并不理想。这可能与植物的冠层结构有关,因为这些指数是基于小麦、油菜或者枫叶构建的,它们的冠层特征与草地差异较大,因此在草地上的应用效果不好。Vincini等[30]的最新研究也表明MTCI和REP等红边指数对植物体内重要生化参数的敏感性与冠层结构有关;Clevers等[31]研究同样也发现MTCI指数与草地叶绿素和氮含量的相关性低于玉米和大豆。
(2)REP指数除了受冠层结构影响外,还可能与其提取算法有关,由于波段数量有限,多光谱遥感影像红边位置的提取算法往往只能用线性四点内插法,但Dawson等[32]和Cho等[33]的研究都指出该方法计算出的红边位置值偏大,当叶绿素含量不高时会明显向长波方向偏离。本研究也证实了这一结论,由图4可知,健康等级为差的草地的REP均值明显偏大,导致其数值区间与中等健康的草地几乎重叠。
(3)就CIred-edge指数而言,Vincini等[30]的研究发现该指数对叶绿素含量变化的敏感性会随着土壤湿度和光照强度的变化而改变,具有明显的波动性。本研究中CIred-edge指数在福州市和厦门市也表现出这种波动性,这可能这2个地区的土壤湿度或光照条件不同有关。
需要指出的是,本研究所采用的大部分红边指数都是基于实测的高光谱数据构建的,但由于Sentinel-2A的波段有限,基于该影像计算的指数与原指数中所采用的波长位置无法完全一致,这可能会对判别精度造成一定的影响。

5 结论

本文基于Sentinel-2A遥感影像,以福州市和厦门市为研究区,对6种红边指数在城市草地健康等级判别中的优劣进行了对比研究,主要结论如下:
不同红边指数对草地健康状况的敏感性不同。在所选取的6种红边指数中,IRECI指数在福州市和厦门市不同健康水平草地的值域区间和均值差异最为明显,总欧式距离最大,分类精度也最高,表明该指数对草地健康状况变化最为敏感。NDRE1和MCARI2指数的判别能力基本一致,其分类总精度逊于IRECI指数,但分类结果也能反映出草地的健康状况;REP和MTCI指数无法有效地区分不同健康等级的草地,而CIred-edge指数则较不稳定,其判别能力有一定的地域性。
Sentinel-2A卫星影像新增的3个红边波段使其能够较准确地反映出不同健康等级草地的光谱特征差异,3个红边波段的引入使Sentinel-2A数据可以用于计算相应的红边指数,在草地健康状况判别中发挥重要的作用。由于本文的结果是基于Sentinel-2A影像数据和2个研究区得到的,因此,这6种红边指数在其它遥感数据和其它地区的表现还有待进一步验证。

The authors have declared that no competing interests exist.

[1]
李西,王丽华,刘尉,等.三种暖季型草坪草对二氧化硫抗性的比较[J].生态学报,2014,34(5):1189-1197.二氧化硫(SO2)是城市大气污染的重要污染物之一,这已经越来 越成为国家迫在眉睫须彻底解决的环境问题,解决SO2污染问题仍是一个重要的生态与环保课题.草坪植物现已成为城市绿化的主要造景材料,依据植物对大气污 染的反应特性来选择城市草坪草种,使之在发挥景观效果的同时,发挥其更好的生态效果.采用人工模拟熏气法,以CK(自然状态)、 SI(4.29mg/m3)、S2(6.44mg/m3)、S3(8.58mg/m3)、S4(10.73mg/m3)5个SO2浓度水平,对城市常用的 3种暖季型草坪草:结缕草(Zoysia japonica)、百喜草(Paspalum notatum)、狗牙根(Cynodon dactylon)进行SO2胁迫处理,并测定3种草坪草生理生化指标,最终比较3种草坪草对SO2的抗性.结果表明:随SO2浓度增加,3种草坪草的可 溶性糖含量(SS)、脯氨酸含量(Pro)、丙二醛(MDA)含量呈增加趋势;结缕草可溶性蛋白(SP)呈先降后升趋势,百喜草则呈先升后降趋势,狗牙根 各胁迫处理下其SP含量均低于CK;结缕草和狗牙根过氧化物酶(POD)、过氧化氢酶(CAT)和超氧化物歧化酶(SOD)活性呈增加趋势,百喜草SOD 和CAT活性呈先升后降趋势,同时其POD活性在各SO2胁迫处理下均低于CK.将所有测定指标采用模糊数学隶属度公式进行综合相关分析,得出3种草坪草 对SO2的抗性由强到弱的排序为:结缕草>狗牙根>百喜草.结缕草在SO2胁迫下与其它两种草坪草相比,表现出了更好的抗性能力,因此,在城市空气不断遭 受污染的今天,结缕草可以作为热带和亚热带城市绿化草坪植物的优选草种之一.

DOI

[ Li X, Wang L H, Liu W, et al.Comparison study of sulfur dioxide resistance of three warm-season turf grasses[J]. Acta Ecologica Sinica, 2014,34(5):1189-1197. ]

[2]
王巧环,陈卫平,王效科,等.城市绿化草坪再生水灌溉对地下水水质影响研究[J].环境科学,2012,33(12):4127-4132.再生水是城市绿化的良好水源,但其潜在的地下水污染问题不容忽 视.本研究基于对地下水及其灌溉水水质的长期监测,探讨了绿化草坪地下水主要理化性质和污染物浓度的变化规律及其与灌溉用水水质的关系.连续5 a的监测结果表明,再生水氨氮超出用于城市绿化的城市杂用水水质标准(GB/T 18920-2002),总氮偏高,二者变化范围分别为0.05~65.4 mg·L-1和2.56~78.0 mg·L-1,平均值分别为12.0 mg·L-1和28.3 mg·L-1.使用自来水灌溉,地下水水质指标正常,波动不大;用再生水灌溉草坪(冬末初春4个月未浇)对地下6 m浅井水质影响明显,对20 m深井水质影响不明显,主要变化表现在硝态氮浓度值升高.浅井地下水硝态氮浓度与灌溉的再生水溶解态氮呈滞后的显著正相关性,表明用再生水灌溉草坪可能会 引起地下浅层水硝态氮污染.因此,需要根据城市绿化用水量大的特点,进一步完善再生水回用标准,避免再生水回用造成新的环境污染风险.

[ Wang Q H, Chen W P, Wang X K, et al.Impacts of reclaimed water irrigation of urban lawn on groundwater quality[J]. Environmental Science, 2012,33(12):4127-4132. ]

[3]
李荣. 城市草坪种易养难解决草害、虫害可降低养护成本[J].草业科学,2003,20(9):73.越 来越多的草坪点缀于城市中心广场和居民社区 ,成为城市绿化的一大景观。但专家提醒说 ,城市草坪种易养难 ,一旦养护跟不上 ,草害、虫害很容易使一块草坪面目全非 ,成为城市景观上的一个瑕疵。据上海农业科学院生态研究所沈国辉介绍 ,目前我国城市草坪发展迅猛。平均 1座大

DOI

[ Li R.Easy to plant the urban grasslands but difficult to grow. Solving grass damage, insect pests can reduce maintenance costs[J]. Pratacultural Science, 2003,20(9):73. ]

[4]
胡秀娟,徐涵秋,郭燕滨,等.水土流失区生态修复后植被健康的遥感判别[J].应用生态学报,2017,28(1):250-256.

[ Hu X J, Xu H Q, Guo Y B, et al.Remote sensing detection of vegetation health status after ecological restoration in soil and water loss region[J]. Chinese Journal of Applied Ecology, 2017,28(1):250-256. ]

[5]
Seager S, Turner E L, Schafer J, et al.Vegetation's red edge: A possible spectroscopic biosignature of extraterrestrial plants. Astrobiology, 2005,5(3):372-390.Abstract: Earth's deciduous plants have a sharp order-of-magnitude increase in leaf reflectance between approximately 700 and 750 nm wavelength. This strong reflectance of Earth's vegetation suggests that surface biosignatures with sharp spectral features might be detectable in the spectrum of scattered light from a spatially unresolved extrasolar terrestrial planet. We assess the potential of Earth's step-function-like spectroscopic feature, referred to as the "red edge", as a tool for astrobiology. We review the basic characteristics and physical origin of the red edge and summarize its use in astronomy: early spectroscopic efforts to search for vegetation on Mars and recent reports of detection of the red edge in the spectrum of Earthshine (i.e., the spatially integrated scattered light spectrum of Earth). We present Earthshine observations from Apache Point Observatory to emphasize that time variability is key to detecting weak surface biosignatures such as the vegetation red edge. We briefly discuss the evolutionary advantages of vegetation's red edge reflectance, and speculate that while extraterrestrial "light harvesting organisms" have no compelling reason to display the exact same red edge feature as terrestrial vegetation, they might have similar spectroscopic features at different wavelengths than terrestrial vegetation. This implies that future terrestrial-planet-characterizing space missions should obtain data that allow time-varying, sharp spectral features at unknown wavelengths to be identified. We caution that some mineral reflectance edges are similar in slope and strength to vegetation's red edge (albeit at different wavelengths); if an extrasolar planet reflectance edge is detected care must be taken with its interpretation.

DOI PMID

[6]
Kanke Y, Tubaña B, Dalen M, et al.Evaluation of red and red-edge reflectance-based vegetation indices for rice biomass and grain yield prediction models in paddy fields[J]. Precision Agriculture, 2016,17(5):507-530.Remote sensing-based nitrogen (N) management has been evaluated in many crops. The water background and wide range of varieties in rice (Oryza sativa), are unique features that require additional cons

DOI

[7]
Cho M A, Debba P, Mutanga O, et al.Potential utility of the spectral red-edge region of sumbandilasat imagery for assessing indigenous forest structure and health[J]. International Journal of Applied Earth Observations & Geoinformation, 2012,16(1):85-93.Indigenous forest degradation is regarded as one of the most important environmental issues facing Sub-Saharan Africa and South Africa in particular. We tested the utility of the unique band settings of the recently launched South African satellite, SumbandilaSat in characterising forest fragmentation in a fragile rural landscape in Dukuduku, northern KwaZulu-Natal. The AISA Eagle hyperspectral image was resampled to the band settings of SumbandilaSat and SPOT 5 (green, red and near infrared bands only) for comparison purposes. Variogram analysis and the red edge shift were used to quantify forest heterogeneity and stress levels, respectively. Results showed that the range values from variograms can quantify differences in spatial heterogeneity across landscapes. The study has also shown that the unique band settings of SumbandilaSat provide additional information for quantifying stress in vegetation as compared to SPOT image data. This is critical in light of the fact that stress levels in vegetation have previously been quantified using hyperspectral sensors, which are more expensive and do not cover large areas as compared to SumbandilaSat satellite. The study moves remote sensing a step closer to operational monitoring of indigenous forests.

DOI

[8]
Ramoelo A, Cho M A, Mathieu R, et al.Monitoring grass nutrients and biomass as indicators of rangeland quality and quantity using random forest modelling and WorldView-2 data[J]. International Journal of Applied Earth Observation and Geoinformation, 2015,43:43-54.Land use and climate change could have huge impacts on food security and the health of various ecosystems. Leaf nitrogen (N) and above-ground biomass are some of the key factors limiting agricultural production and ecosystem functioning. Leaf N and biomass can be used as indicators of rangeland quality and quantity. Conventional methods for assessing these vegetation parameters at landscape scale level are time consuming and tedious. Remote sensing provides a bird-eye view of the landscape, which creates an opportunity to assess these vegetation parameters over wider rangeland areas. Estimation of leaf N has been successful during peak productivity or high biomass and limited studies estimated leaf N in dry season. The estimation of above-ground biomass has been hindered by the signal saturation problems using conventional vegetation indices. The objective of this study is to monitor leaf N and above-ground biomass as an indicator of rangeland quality and quantity using WorldView-2 satellite images and random forest technique in the north-eastern part of South Africa. Series of field work to collect samples for leaf N and biomass were undertaken in March 2013, April or May 2012 (end of wet season) and July 2012 (dry season). Several conventional and red edge based vegetation indices were computed. Overall results indicate that random forest and vegetation indices explained over 89% of leaf N concentrations for grass and trees, and less than 89% for all the years of assessment. The red edge based vegetation indices were among the important variables for predicting leaf N. For the biomass, random forest model explained over 84% of biomass variation in all years, and visible bands including red edge based vegetation indices were found to be important. The study demonstrated that leaf N could be monitored using high spatial resolution with the red edge band capability, and is important for rangeland assessment and monitoring.

DOI

[9]
Delegido J, Verrelst J, Meza C M, et al.A red-edge spectral index for remote sensing estimation of green LAI over agroecosystems[J]. European Journal of Agronomy, 2013,46:42-52.Leaf area index (LAI) is a key biophysical parameter for the monitoring of agroecosystems. Conventional two-band vegetation indices based on red and near-infrared relationships such as the normalized difference vegetation index (NDVI) are well known to suffer from saturation at moderate-to-high LAI values (3鈥5). To bypass this saturation effect, in this work a robust alternative has been proposed for the estimation of green LAI over a wide variety of crop types. By using data from European Space Agency (ESA) campaigns SPARC 2003 and 2004 (Barrax, Spain) experimental LAI values over 9 different crop types have been collected while at the same time spaceborne imagery have been acquired using the hyperspectral CHRIS (Compact High Resolution Imaging Spectrometer) sensor onboard PROBA (Project for On-Board Autonomy) satellite. This extensive dataset allowed us to evaluate the optimal band combination through spectral indices based on normalized differences. The best linear correlation against the experimental LAI dataset was obtained by combining the 674nm and 712nm wavebands. These wavelengths correspond to the maximal chlorophyll absorption and the red-edge position region, respectively, and are known to be sensitive to the physiological status of the plant. Contrary to the NDVI ( r 2 : 0.68), the red-edge NDI correlated strongly ( r 2 : 0.82) with LAI without saturating at larger values. The index has been subsequently validated against field data from the 2009 SEN3EXP campaign (Barrax, Spain) that again spanned a wide variety of crop types. A linear relationship over the full LAI range was confirmed and the regression equation was applied to a CHRIS/PROBA image acquired during the same campaign. A LAI map has been derived with an RMSE accuracy of 0.6. It is concluded that the red-edge spectral index is a powerful alternative for LAI estimation and may provide valuable information for precision agriculture, e.g. when applied to high spatial resolution imagery.

DOI

[10]
贺可勋,赵书河,来建斌,等.水分胁迫对小麦光谱红边参数和产量变化的影响[J].光谱学与光谱分析,2013,33(8):2143-2147.在不同的水分胁迫梯度下,利用实验区小麦不同生长期光谱反射率观测数据,研究水分胁迫对小麦光谱反射率、红边参数及小麦产量的影响。首先分析水分胁迫对小麦光谱反射率的影响,然后利用小麦光谱反射率的一阶微分得到小麦光谱反射率的红边位置和红边幅度参数,分析了水分胁迫对小麦光谱红边参数的影响,最后利用水分胁迫下的红边幅度和小麦产量的关系,阐述了小麦水分胁迫下的光谱反射率特征与小麦产量的关系。研究结果表明,水分胁迫下小麦的红边位置在生长期前期出现红边位置红移现象,生长期后期出现红边位置蓝移现象。水分胁迫下的小麦的红边幅度在不同的生长期表现出不同的变化特征:生长期初期随着水分胁迫的增加而红边幅度增大,生长期后期随着水分胁迫的增加而红边幅度减小。小麦的红边幅度在拔节生长期前与小麦产量呈负相关而拔节生长期之后呈正相关,且不同生长期小麦的红边幅度与小麦的产量的相关系数不同。

DOI

[ He K X, Zhao S H, Lai J B, et al.Effects of water stress on red-edge parameters and yield in wheat cropping[J]. Spectroscopy and Spectral Analysis, 2013,33(8):2143-2147. ]

[11]
秦占飞,常庆瑞,申健,等.引黄灌区水稻红边特征及SPAD高光谱预测模型[J].武汉大学学报·信息科学版,2016,41(9):1168-1175.

[ Qin Z F, Chang Q R, Shen J, et al.Red edge characteristics and SPAD estimation model using hyperspectral data for rice in Ningxia irrigation zone[J]. Geomatics and Information Science of Wuhan University, 2016,41(9):1168-1175. ]

[12]
Dash J, Curran P J.The MERIS terrestrial chlorophyll index[J]. International Journal of Remote Sensing, 2004,25(23):5403-5413.The long wavelength edge of the major chlorophyll absorption feature in the spectrum of a vegetation canopy moves to longer wavelengths with an increase in chlorophyll content. The position of this red-edge has been used successfully to estimate, by remote sensing, the chlorophyll content of vegetation canopies. Techniques used to estimate this red-edge position (REP) have been designed for use on small volumes of continuous spectral data rather than the large volumes of discontinuous spectral data recorded by contemporary satellite spectrometers. Also, each technique produces a different value of REP from the same spectral data and REP values are relatively insensitive to chlorophyll content at high values of chlorophyll content. This paper reports on the design and indirect evaluation of a surrogate REP index for use with spectral data recorded at the standard band settings of the Medium Resolution Imaging Spectrometer (MERIS). This index, termed the MERIS terrestrial chlorophyll index (MTCI), was evaluated using model spectra, field spectra and MERIS data. It was easy to calculate (and so can be automated), was correlated strongly with REP but unlike REP was sensitive to high values of chlorophyll content. As a result this index became an official MERIS level-2 product of the European Space Agency in March 2004. Further direct evaluation of the MTCI is proposed, using both greenhouse and field data.

DOI

[13]
Gitelson A, Merzlyak M N.Spectral reflectance changes associated with autumn senescence of Aesculus hippocastanum L and Acer platanoides L leaves Spectral features and relation to chlorophyll estimation[J]. Journal of Plant Physiology, 1994,143(3):286-292.The reflectance spectra of adaxial surfaces of Aesculus hippocastanum L. and Acer platanoides L. leaves in the course of autumn pigment transformation were recorded. A dramatic decrease in and almost complete disappearance of chlorophyll (Chl) gave an opportunity for the investigation of relations between the reflectance changes and the pigment concentrations. The signature analysis of reflectance spectra indicated that in the green to yellow leaves of both species the maximal standard deviation of reflectance coincided with the red absorption maximum of Chl a . However, within the leaves with high Chl, minimal sensitivity to pigment variations was observed at 675 nm. The maximal standard deviations were found near 550 to 560 and 700 to 710 nm. The revealed spectral features can serve as sensitive indicators of early stages of leaf senescence. The several functions of reflectance were found to be directly proportional to Chl (a square of correlation coefficient of more than 0.97); that allows an assessment of the pigment concentration ranging from 0.5 to 27.5 nmol/cm 2 with an estimation error of less than 1.5 nmol/cm 2 . This makes its possible to precisely determine Chl a with a background of variable and high pigment concentration.

DOI

[14]
Wu C, Niu Z, Tang Q, et al.Estimating chlorophyll content from hyperspectral vegetation indices: Modeling and validation[J]. Agricultural and forest meteorology, 2008,148(8):1230-1241.Leaf chlorophyll content, a good indicator of photosynthesis activity, mutations, stress and nutritional state, is of special significance to precision agriculture. Recent studies have demonstrated the feasibility of retrieval of chlorophyll content from hyperspectral vegetation indices composed by the reflectance of specific bands. In this paper, a set of vegetation indices belonged to three classes (normalized difference vegetation index (NDVI), modified simple ratio (MSR) index and the modified chlorophyll absorption ratio index (MCARI, TCARI) and the integrated forms (MCARI/OSAVI and TCARI/OSAVI)) were tested using the PROSPECT and SAIL models to explore their potentials in chlorophyll content estimation. Different bands combinations were also used to derive the modified vegetation indices. In the sensitivity study, four new formed indices (MSR[705,750], MCARI[705,750], TCARI/OSAVI[705,750] and MCARI/OSAVI[705,750]) were proved to have better linearity with chlorophyll content and resistant to leaf area index (LAI) variations by taking into account the effect of quick saturation at 670nm with relatively low chlorophyll content. Validation study was also conducted at canopy scale using the ground truth data in the growth duration of winter wheat (chlorophyll content and reflectance data). The results showed that the integrated indices TCARI/OSAVI[705,750] and MCARI/OSAVI[705,750] are most appropriate for chlorophyll estimation with high correlation coefficients R 2 of 0.8808 and 0.9406, respectively, because more disturbances such as shadow, soil reflectance and nonphotosynthetic materials are taken into account. The high correlation between the vegetation indices obtained in the developmental stages of wheat and Hyperion data ( R 2 of 0.6798 and 0.7618 for TCARI/OSAVI[705,750] and MCARI/OSAVI[705,750], respectively) indicated that these two integrated index can be used in practice to estimate the chlorophylls of different types of corns.

DOI

[15]
刘佳,王利民,滕飞,等. RapidEye卫星红边波段对农作物面积提取精度的影响[J].农业工程学报,2016,32(13):140-148.在传统的可见光与红外波段基础上增加红边波段(690~730 nm),是当前高分辨卫星传感器研制的明显趋势.德国RapidEye卫星携带有红边波段传感器,该文基于黑龙江省北安市东胜乡2014年7月27日的RapidEye遥感数据,采用监督分类的方法,通过计算有红边参与条件下、无红边参与条件下,玉米、大豆及其他3种地物类型的可分性测度、分类精度及景观破碎度等指标,比较分析了2种波段组合方式下的红边波段对农作物面积提取精度的影响.其中,监督分类的训练样本是以覆盖研究区的2 km×2 km格网为基本单元,在玉米和大豆面积比例等概率原则下,选取了10个网格作为训练样本,样方内作物的识别采用目视解译的方式完成.精度验证是采用覆盖研究区的农作物面积本底调查结果评价的,本底调查数据是在5m空间分辨率Rapideye数据初步分类基础上,根据多时相Landsat-8/OLI(Operational Land Imager)数据季节变化规律,结合地面调查,采用目视修正的方法完成.结果表明,有红边参与的玉米、大豆和其他3种地物类型识别的总体精度为88.4%,Kappa系数为0.81,玉米、大豆和其他3种地物类型的制图精度分别为93.1%,86.0%和87.3%;没有红边参与的3种地物识别的总体精度为81.7%,Kappa系数为0.71,玉米、大豆和其他3种地区类型的制图精度分别为83.9%,73.4%和84.6%;通过引入红边波段,3种地物的总体识别精度提高了6.7百分点,玉米、大豆和其他3种地物类型的识别精度分别提高了9.2百分点,12.6百分点和2.7百分点.利用Jeffries-Matusita方法计算了3种地物的可分性测度,玉米-大豆、玉米-其他、大豆-其他的可分性测度分别由0.84变为1.73、1.37变为1.81、1.27变为1.29;采用破碎度指数计算了景观破碎度,地块数量减少了69.2%,平均地块面积增加了2.2倍,平均地块周长增加了60.50%,地块面积与周长比增加了1.0倍.由上述研究结果可以看出,通过红边波段的引入,增加了地物的间的可分性测度,减少了“椒盐”效应造成的景观破碎度的增加,农作物面积识别整体精度得到了提高.目前搭载红边波段的卫星载荷越来越多,即将发射的国产卫星也拟增加红边波段提高作物识别能力,该文研究结果将为国产红边卫星数据在农业上的应用提供参考.

DOI

[ Liu J, Wang L M, Teng F, et al.Impact of red-edge waveband of RapidEye satellite on estimation accuracy of crop planting area[J]. Transactions of the Chinese Society of Agricultural Engineering, 2016,32(13):140-148. ]

[16]
Vincini M, Amaducci S, Frazzi E.Empirical estimation of leaf Chlorophyll density in winter wheat canopies using Sentinel-2 spectral resolution[J]. IEEE Transactions on Geoscience and Remote Sensing, 2014,52(6):3220-3235.A comparison between the sensitivities to leaf chlorophyll density at the canopy scale of several vegetation indices (VIs) obtained at different spectral resolutions was carried out using spectral reflectance collected in winter wheat field trials with different nitrogen fertilization levels. A total of 350 spectra were collected from experimental plots at Feekes growth stages 5, 6, and 9 using a portable spectroradiometer (ASD FieldSpec HH), along with Minolta SPAD measurements of leaf optical thickness as a proxy for leaf chlorophyll density. Indices based on visible and near-infrared (NIR) bands were obtained from average reflectance in spectral ranges corresponding to SPOT HRG and Sentinel-2 (S2) bands. Indices requiring a red-edge band were obtained from reflectance at the originally proposed VI wavelengths using the 1.6-nm nominal spectral resolution bandwidth of the spectroradiometer and from average reflectance in the S2 red-edge bands with the closest spectral position to VI originally proposed wavelengths. Among VIs obtained from Sentinel-2 bands MERIS terrestrial chlorophyll index, red-edge position and triangular chlorophyll index/optimized soil adjusted VI ratio (TCI/OSAVI) indices, obtainable at 20-m spatial resolution from future S2 red-edge bands, and chlorophyll VI (CVI), obtainable at 10 m from visible and NIR bands, were the best estimators of winter wheat leaf chlorophyll density. The sensitivity of the best-performing indices obtained from S2 bands to winter wheat with other conditions was addressed by the analysis of a large synthetic data set obtained using the PROSPECT-SAILH model in the direct mode. Analysis of the synthetic data set using Sentinel-2 spectral resolution indicates that the two leaf area index normalized (TCI/OSAVI and CVI) indices are better leaf chlorophyll estimators.

DOI

[17]
Immitzer M, Vuolo F, Atzberger C.First experience with Sentinel-2 data for crop and tree species classifications in central Europe[J]. Remote Sensing, 2016,8(3):1-27.The study presents the preliminary results of two classification exercises assessing the capabilities of pre-operational (August 2015) Sentinel-2 (S2) data for mapping crop types and tree species. In the first case study, an S2 image was used to map six summer crop species in Lower Austria as well as winter crops/bare soil. Crop type maps are needed to account for crop-specific water use and for agricultural statistics. Crop type information is also useful to parametrize crop growth models for yield estimation, as well as for the retrieval of vegetation biophysical variables using radiative transfer models. The second case study aimed to map seven different deciduous and coniferous tree species in Germany. Detailed information about tree species distribution is important for forest management and to assess potential impacts of climate change. In our S2 data assessment, crop and tree species maps were produced at 10 m spatial resolution by combining the ten S2 spectral channels with 10 and 20 m pixel size. A supervised Random Forest classifier (RF) was deployed and trained with appropriate ground truth. In both case studies, S2 data confirmed its expected capabilities to produce reliable land cover maps. Cross-validated overall accuracies ranged between 65% (tree species) and 76% (crop types). The study confirmed the high value of the red-edge and shortwave infrared (SWIR) bands for vegetation mapping. Also, the blue band was important in both study sites. The S2-bands in the near infrared were amongst the least important channels. The object based image analysis (OBIA) and the classical pixel-based classification achieved comparable results, mainly for the cropland. As only single date acquisitions were available for this study, the full potential of S2 data could not be assessed. In the future, the two twin S2 satellites will offer global coverage every five days and therefore permit to concurrently exploit unprecedented spectral and temporal information with high spatial resolution.

DOI

[18]
郑阳,吴炳方,张淼. Sentinel-2数据的冬小麦地上干生物量估算及评价[J].遥感学报,2017,21(2):318-328.

[ Zheng Y, Wu B F, Zhang M.Estimating the aboveground biomass of winter wheat using the Sentinel-2 data[J]. Journal of Remote Sensing, 2017,21(2):318-328. ]

[19]
ESA. Sentinel-2 User Handbook [EB/OL]. (2015-07-24) [2017-04-08].

[20]
ESA. Sentinel-2 MSI - Level-2A Prototype Processor Installation and User Manual [EB/OL]. (2016-04-13) [2017-04-08]. .

[21]
ESA. Sentinel-2 technical guides [EB/OL].[2017-04-08]. https://sentinels.copernicus.eu/web/sentinel/technical-guid-es/sentinel-2-msi.

[22]
Gausman H W, Allen W A, Cardenas R.Reflectance of cotton leaves and their structure[J]. Remote Sensing of Environment, 1969,1(1):19-22.Cotton plants were grown hydroponically with low-, medium-, and high-salinity substrate levels formulated with sodium chloride. Leaves were sampled from third and fourth nodes down from apexes of cotton plants, simulating what an overhead remote sensor would see. A spectrophotometer was used to measure reflectance and transmittance of light impinging on upper surfaces of individual leaves. Total reflectance of light in the 750- to 1300 -m渭 spectral range was greater from leaves of cotton plants grown in medium- and high-salinity substrates than from those grown in low-salinity substrates. This increase in reflectance and a lessening in absorptance were consistent with the observed thicker leaves of the saline substrate-grown plants which had larger palisade cells and loosely arranged spongy mesophyll. These structural changes resulted in more intercellular spaces, thus supporting the premise that internal scattering of light is increased by cell wallir cavity interfaces.

DOI

[23]
Horler D N H, Dockray M, Barber J. The red edge of plant leaf reflectance[J]. International Journal of Remote Sensing, 1983,4(2):273-288.Not Available

DOI

[24]
Rock B N, Vogelmann J E, Williams D L, et al.Remote detection of forest damage[J]. BioScience, 1986,36(7):439-445.To understand the spectral properties associated with various vegetation types and responses to stress agents, appropriate ground-based analytical techniques must document botanically significant spectral information that can be detected from sensors such as TM. This paper describes a NASA-sponsored study in progress at the Jet Propulsion Laboratory (JPL) and Goddard Space Flight Center (GSFC) that uses data from intensive ground assessments in conjunction with aircraft overflights. In this study, the authors have used an aircraft multispectral scanner known as the thematic mapper simulator (TMS) to duplicate TM spectral coverage of study sites. In addition, helicopter-mounted radiometers duplicating TM coverage have permitted multiple sampling of single sites. They also coordinated simultaneous ground-based surveys to improve their understanding of site variables and spectral characteristics associated with forest decline sites. Ground assessment included in situ spectral analysis as well as determination of physiological status and anatomical/morphological conditions associated with forest species in various stages of decline.

DOI

[25]
Guyot G, Baret F.Utilisation de la haute resolution spectrale pour suivre l'etat des couverts vegetaux[C]// Proceedings of the 4th international conference on spectral signatures of objects in remote sensing. ESA SP-287, Assois, France: 1988:279-286.

[26]
Frampton W J, Dash J, Watmough G, et al.Evaluating the capabilities of Sentinel-2 for quantitative estimation of biophysical variables in vegetation[J]. ISPRS journal of photogrammetry and remote sensing, 2013,82:83-92.The red edge position (REP) in the vegetation spectral reflectance is a surrogate measure of vegetation chlorophyll content, and hence can be used to monitor the health and function of vegetation. The Multi-Spectral Instrument (MSI) aboard the future ESA Sentinel-2 (S-2) satellite will provide the opportunity for estimation of the REP at much higher spatial resolution (20m) than has been previously possible with spaceborne sensors such as Medium Resolution Imaging Spectrometer (MERIS) aboard ENVISAT. This study aims to evaluate the potential of S-2 MSI sensor for estimation of canopy chlorophyll content, leaf area index (LAI) and leaf chlorophyll concentration (LCC) using data from multiple field campaigns. Included in the assessed field campaigns are results from SEN3Exp in Barrax, Spain composed of 35 elementary sampling units (ESUs) of LCC and LAI which have been assessed for correlation with simulated MSI data using a CASI airborne imaging spectrometer. Analysis also presents results from SicilyS2EVAL, a campaign consisting of 25 ESUs in Sicily, Italy supported by a simultaneous Specim Aisa-Eagle data acquisition. In addition, these results were compared to outputs from the PROSAIL model for similar values of biophysical variables in the ESUs. The paper in turn assessed the scope of S-2 for retrieval of biophysical variables using these combined datasets through investigating the performance of the relevant Vegetation Indices (VIs) as well as presenting the novel Inverted Red-Edge Chlorophyll Index (IRECI) and Sentinel-2 Red-Edge Position (S2REP). Results indicated significant relationships between both canopy chlorophyll content and LAI for simulated MSI data using IRECI or the Normalised Difference Vegetation Index (NDVI) while S2REP and the MERIS Terrestrial Chlorophyll Index (MTCI) were found to have the strongest correlation for retrieval of LCC.

DOI

[27]
Gitelson A A, Gritz Y, Merzlyak M N.Relationships between leaf chlorophyll content and spectral reflectance and algorithms for non-destructive chlorophyll assessment in higher plant leaves[J]. Journal of plant physiology, 2003,160(3):271-282.Abstract Leaf chlorophyll content provides valuable information about physiological status of plants. Reflectance measurement makes it possible to quickly and non-destructively assess, in situ, the chlorophyll content in leaves. Our objective was to investigate the spectral behavior of the relationship between reflectance and chlorophyll content and to develop a technique for non-destructive chlorophyll estimation in leaves with a wide range of pigment content and composition using reflectance in a few broad spectral bands. Spectral reflectance of maple, chestnut, wild vine and beech leaves in a wide range of pigment content and composition was investigated. It was shown that reciprocal reflectance (R lambda)-1 in the spectral range lambda from 520 to 550 nm and 695 to 705 nm related closely to the total chlorophyll content in leaves of all species. Subtraction of near infra-red reciprocal reflectance, (RNIR)-1, from (R lambda)-1 made index [(R lambda)(-1)-(RNIR)-1] linearly proportional to the total chlorophyll content in spectral ranges lambda from 525 to 555 nm and from 695 to 725 nm with coefficient of determination r2 > 0.94. To adjust for differences in leaf structure, the product of the latter index and NIR reflectance [(R lambda)(-1)-(RNIR)-1]*(RNIR) was used; this further increased the accuracy of the chlorophyll estimation in the range lambda from 520 to 585 nm and from 695 to 740 nm. Two independent data sets were used to validate the developed algorithms. The root mean square error of the chlorophyll prediction did not exceed 50 mumol/m2 in leaves with total chlorophyll ranged from 1 to 830 mumol/m2.

DOI PMID

[28]
Gitelson A A, Keydan G P, Merzlyak M N.Three-band model for noninvasive estimation of chlorophyll, carotenoids, and anthocyanin contents in higher plant leaves[J]. Geophysical research letters, 2006,33(11):1-5.Leaf pigment content and composition provide important information about plant physiological status. Reflectance measurements offer a rapid, nondestructive technique to estimate pigment content. This paper describes a recently developed three-band conceptual model capable of remotely estimating total of chlorophylls, carotenoids and anthocyanins contents in leaves from many tree and crop species. We tuned the spectral regions used in the model in accord with pigment of interest and the optical characteristics of the leaves studied, and showed that the developed technique allowed accurate estimation of total chlorophylls, carotenoids and anthocyanins, explaining more than 91%, 70% and 93% of pigment variation, respectively. This new technique shows a great potential for noninvasive tracking of the physiological status of vegetation and the impact of environmental changes.

DOI

[29]
朱大运,熊康宁,肖华,等.基于植被指数的GF-1与Landsat-OLI石漠化识别能力对比评价[J].自然资源学报,2016,31(11):1949-1957.

[ Zhu D Y, Xiong K N, Xiao H, et al.Comparison of rocky desertification detection ability of GF-1 and Landsat-OLI based on vegetation index[J]. Journal of Natural Resources, 2016,31(11):1949-1957. ]

[30]
Vincini M, Calegari F, Casa R.Sensitivity of leaf chlorophyll empirical estimators obtained at Sentinel-2 spectral resolution for different canopy structures[J]. Precision Agriculture, 2016,17(3):313-331.A comparison of the sensitivity of canopy scale estimators of leaf chlorophyll, obtainable with Sentinel-2 spectral resolution, to soil, canopy and leaf mesophyll factors, was addressed. The analysis

DOI

[31]
Clevers J G P W, Gitelson A A. Remote estimation of crop and grass chlorophyll and nitrogen content using red-edge bands on Sentinel-2 and-3[J]. International Journal of Applied Earth Observation and Geoinformation, 2013,23:344-351.Sentinel-2 is planned for launch in 2014 by the European Space Agency and it is equipped with the Multi Spectral Instrument (MSI), which will provide images with high spatial, spectral and temporal resolution. It covers the VNIR/SWIR spectral region in 13 bands and incorporates two new spectral bands in the red-edge region, which can be used to derive vegetation indices using red-edge bands in their formulation. These are particularly suitable for estimating canopy chlorophyll and nitrogen (N) content. This band setting is important for vegetation studies and is very similar to the ones of the Ocean and Land Colour Instrument (OLCI) on the planned Sentinel-3 satellite and the Medium Resolution Imaging Spectrometer (MERIS) on Envisat, which operated from 2002 to early 2012. This paper focuses on the potential of Sentinel-2 and Sentinel-3 in estimating total crop and grass chlorophyll and N content by studying in situ crop variables and spectroradiometer measurements obtained for four different test sites. In particular, the red-edge chlorophyll index (CI red-edge ), the green chlorophyll index (CI green ) and the MERIS terrestrial chlorophyll index (MTCI) were found to be accurate and linear estimators of canopy chlorophyll and N content and the Sentinel-2 and -3 bands are well positioned for deriving these indices. Results confirm the importance of the red-edge bands on particularly Sentinel-2 for agricultural applications, because of the combination with its high spatial resolution of 20m.

DOI

[32]
Dawson T P, Curran P J.Technical note a new technique for interpolating the reflectance red edge position[J]. International Journal of Remote Sensing, 1998,19:2133-2139.

[33]
Cho M A, Skidmore A K.A new technique for extracting the red edge position from hyperspectral data: The linear extrapolation method[J]. Remote sensing of environment, 2006,101(2):181-193.The position of the inflexion point in the red edge region (680 to 780 nm) of the spectral reflectance signature, termed the red edge position (REP), is affected by biochemical and biophysical parameters and has been used as a means to estimate foliar chlorophyll or nitrogen content. In this paper, we report on a new technique for extracting the REP from hyperspectral data that aims to mitigate the discontinuity in the relationship between the REP and the nitrogen content caused by the existence of a double-peak feature on the derivative spectrum. It is based on a linear extrapolation of straight lines on the far-red (680 to 700 nm) and NIR (725 to 760 nm) flanks of the first derivative reflectance spectrum. The REP is then defined by the wavelength value at the intersection of the two lines. The output is a REP equation, REP02=026102( c 1 026102 c 2 )02/02( m 1 026102 m 2 ), where c 1 and c 2 , and m 1 and m 2 represent the intercepts and slopes of the far-red and NIR lines, respectively. Far-red wavebands at 679.65 and 694.30 nm in combination with NIR wavebands at 732.46 and 760.41 nm or at 723.64 and 760.41 nm were identified as the optimal combinations for calculating nitrogen-sensitive REPs for three spectral data sets (rye canopy, and maize leaf and mixed grass/herb leaf stack spectra). REPs extracted using this new technique (linear extrapolation method) showed high correlations with a wide range of foliar nitrogen concentrations for both narrow and wider bandwidth spectra, being comparable with results obtained using the traditional linear interpolation, polynomial and inverted Gaussian fitting techniques. In addition, the new technique is simple as is the case with the linear interpolation method, but performed better than the latter method in the case of maize leaves at different developmental stages and mixed grass/herb leaves with a low nitrogen concentration.

DOI

Outlines

/