
Journal of Geo-information Science >
On the Comprehensive Evaluation of the Data Quality for OSM Road Network from the Perspectives of Multi-level and Multi-granularity
Received date: 2017-05-09
Request revised date: 2017-07-25
Online published: 2017-11-10
Copyright
OpenStreetMap (hereinafter short for OSM) data quality evaluation only considered the one-sided evaluation index or single level assessment of the object. This paper takes the authoritative data of government planning agency as the reference data and designs a data quality assessment model of OSM road network at a multi-level and multi-granularity scale. This model is based on the method of fuzzy integrated evaluation and is the combination of quality evaluation index and spatial level. From three aspects: single target, group goals and overall goals, this paper builts the evaluation indexes system of data quality and sets the control of number of individual and group structure in one, then sovles the crucial technical problems, such as the determining of membership function and the optimal combination weight. This paper also achieves the combinations of macro and micro, global and local. The results show that OSM data qualities of the single level and the overall level are superior. The group level is the general. The qualities of the single target and most indexes of group goal are superior so that it’s consistent and logical that the overall level is superior. This shows the method is feasible and practical. Some industries which are based on VGI data source can use this empirical basis and reliable data quality evaluation method for reference.
ZHU Fuxiao , WANG Yanhui . On the Comprehensive Evaluation of the Data Quality for OSM Road Network from the Perspectives of Multi-level and Multi-granularity[J]. Journal of Geo-information Science, 2017 , 19(11) : 1422 -1432 . DOI: 10.3724/SP.J.1047.2017.01422
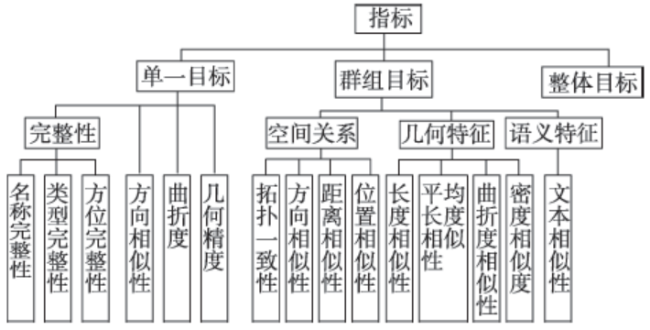
Fig. 1 Data quality evaluation index system of OSM road network图1 OSM路网数据质量评价指标体系 |
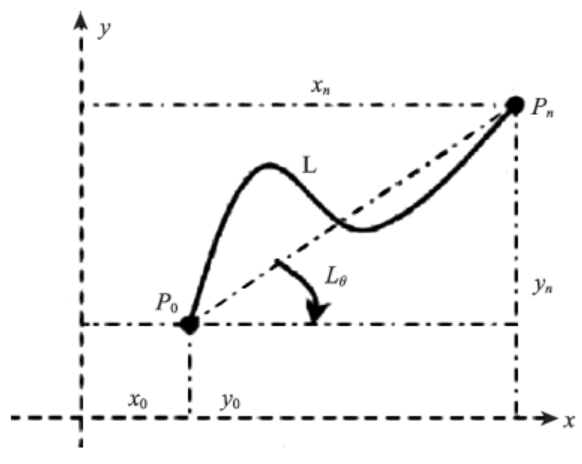
Fig. 2 The direction of the line feature图2 线要素的方向[25] |
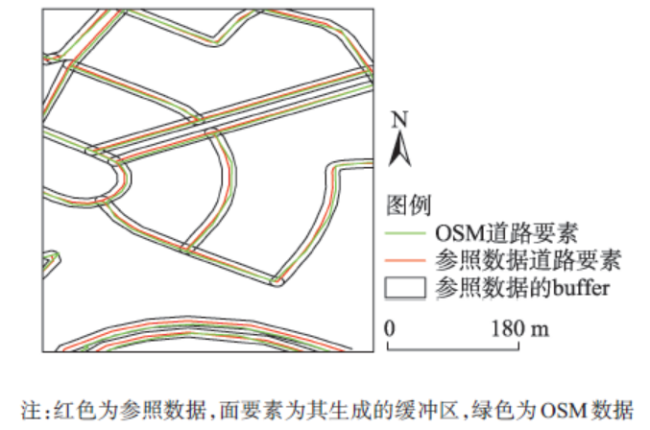
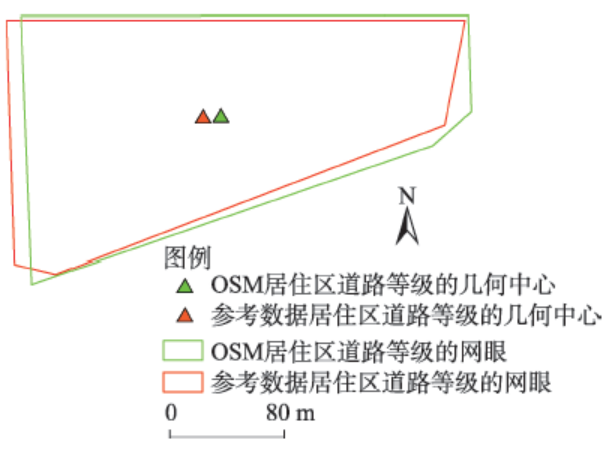
Fig.3 Location precision calculation based on buffer analysis图3 基于缓冲区分析的位置精度估算 |
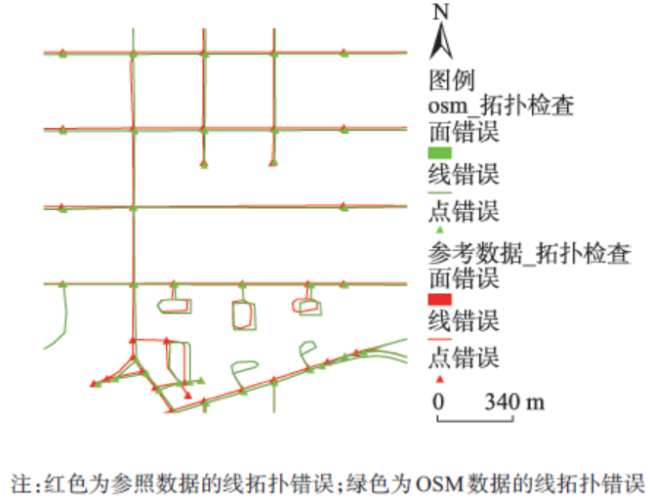
Fig.4 Topology check of OSM图4 OSM 拓扑检测 |
Fig. 5 Nearest distance图5 邻近距离 |
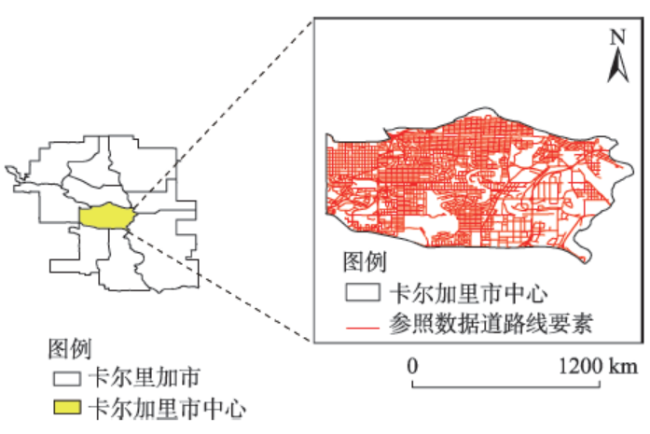
Fig. 6 Overview of study area图6 研究区概况 |
Tab. 1 Statistical results of directional similarity difference表1 方向相似度差值统计结果 |
| 统计对象 | 整体方向相似度差值 | 二级道路方向相似度差值 | 三级道路方向相似度差值 | 居住区道路方向相似度差值 |
|---|---|---|---|---|
| 最大值 | 74.83 | 56.93 | 36.54 | 74.83 |
| 最小值 | 0 | 0.02 | 0.02 | 0 |
| 平均值 | 5.97 | 6.68 | 4.48 | 5.70 |
| 中位数 | 1.52 | 1.42 | 1.50 | 1.52 |
| 标准差 | 12.59 | 12.64 | 12.87 | 12.59 |
| 样本 | 394 | 28 | 40 | 287 |
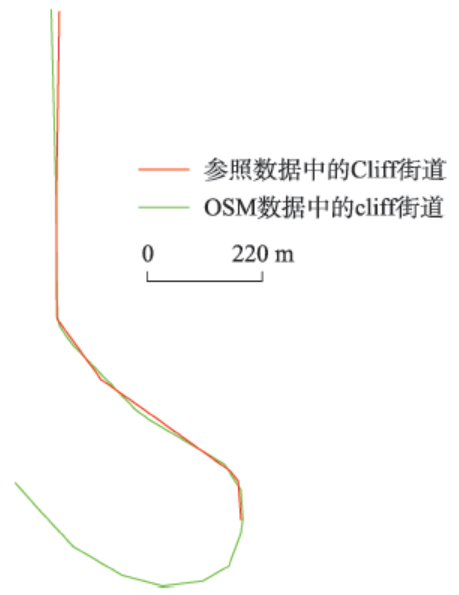
Fig. 7 Overview of Cliff Street in south west图7 Cliff街道西南向示意图 |
Tab.2 Data quality evaluation results of a single target (%)表2 单一目标的数据质量评价结果(%) |
| U1单一目标 | U11完整性 | U12方向相似度 | U13曲折度 | U14方位精度 | |||
|---|---|---|---|---|---|---|---|
| U111名称 | U112类型 | U113方位 | |||||
| 居住区道路 | 长度 | 98.54 | 98.54 | 98.54 | 85.49 | 96.85 | 96.72 |
| 街道数量 | 99.40 | 99.70 | 92.30 | 99.70 | |||
| 二级街道 | 长度 | 98.19 | 98.19 | 98.19 | 86.79 | 97.80 | 94.89 |
| 街道数量 | 100.00 | 100.00 | 97.10 | 100 | |||
| 三级街道 | 长度 | 87.00 | 87.00 | 87.00 | 86.18 | 96.49 | 95.31 |
| 街道数量 | 93.30 | 91.10 | 86.70 | 97.60 | |||
| 整体 | 长度 | 93.43 | 93.43 | 93.43 | 85.13 | 96.67 | 98.24 |
| 街道数量 | 97.50 | ||||||
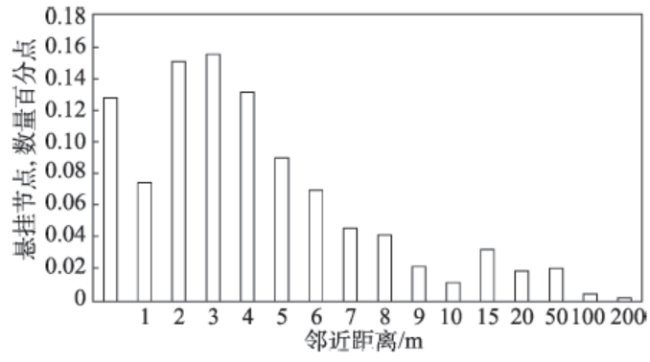
Fig.8 Distribution of hanging node within nearest distance图8 邻近距离内悬挂节点分布 |
Tab. 3 The statistics of hanging node and nearest distance表3 悬挂节点和邻近距离描述性统计信息 |
| 统计类型 | 悬挂节点数量差值 | 邻近距离/m |
|---|---|---|
| 最大值 | 49.11% | 187.81 |
| 最小值 | 0 | 0.000121 |
| 中位数 | 1.01% | 2.97 |
| 平均值 | 7.97% | 5.58 |
| 标准差 | 15.85% | 10.20 |
| 样本总数/个 | 8 | 2358 |
| 精度/% | 92.03 | 88.04 |
Tab. 4 Data quality evaluation results of group goals (%)表4 群组目标的数据质量评价结果(%) |
| U2群组 目标 | U21空间关系 | U22几何特征 | U23语义特征 | ||||||||
|---|---|---|---|---|---|---|---|---|---|---|---|
| U211拓扑一致性 | U212方向相似度 | U213距离相似度 | U214位置相似度 | U221长度相似性 | U222平均长度相似性 | U223曲折度相似度 | U224密度相似度 | U231文本相似度 | |||
| 居住区道路 | 90.04 | 94.35 | 63.38 | 94.33 | 99.18 | 89.61 | 99.16 | 98.97 | 98.54 | ||
| 二级街道 | 97.13 | 95.66 | 89.26 | 99.20 | 63.60 | 97.03 | 96.34 | 98.54 | |||
| 三级街道 | 67.18 | 89.80 | 94.16 | 88.69 | 42.21 | 84.18 | 84.10 | 87.00 | |||
| 整体 | 81.84 | 99.54 | 90.40 | 98.73 | 90.66 | 99.24 | 98.49 | 93.43 | |||
Tab. 5 Weights表5 权重 |
| 目标层Z | 准则层Y | 权重Wi | 方案层 | 权重Wj | 基础指标层 | 权重Wk |
|---|---|---|---|---|---|---|
| VGI数据质量评价 | U1单一目标 | 0.5 | U11完整性 | 0.1284 | U111名称 | 0.3670 |
| U112类型 | 0.3830 | |||||
| U113方位 | 0.2490 | |||||
| U12方向相似度 | 0.0775 | |||||
| U13曲折度 | 0.3102 | |||||
| U14方位精度 | 0.4839 | |||||
| U2群组目标 | 0.5 | U21空间关系 | 0.6044 | U211拓扑一致性 | 0.2820 | |
| U212方向相似度 | 0.0390 | |||||
| U213距离相似度 | 0.1250 | |||||
| U214位置相似度 | 0.2410 | |||||
| U22几何特征 | 0.3347 | U221长度相似性 | 0.0686 | |||
| U222平均长度相似性 | 0.0586 | |||||
| U223曲折度相似度 | 0.2113 | |||||
| U224密度相似度 | 0.0896 | |||||
| U23语义特征 | 0.0609 | U231文本相似度 | 0.0361 | |||
Tab.6 The overall evaluation results of each level’s index表6 各级指标的总体评价结果 |
| 指标 | 完整性 | 空间关系 | 几何特征 | 语义特征 | 单一目标 | 群组目标 | 整体目标 |
|---|---|---|---|---|---|---|---|
| 评估结果 | 优 | 一般 | 优 | 优 | 优 | 一般 | 优 |
Tab. 7 The overall evaluation results of each grade’s road表7 各个等级道路的总体评价结果 |
| 指标 | 二级道路 | 三级道路 | 居住区道路 |
|---|---|---|---|
| 评估结果 | 优 | 差 | 一般 |
The authors have declared that no competing interests exist.
| [1] |
Goodchild. Citizens as sensors: The world of volunteered geography[J]. GeoJournal, 2007,69(4):211-221.
|
| [2] |
|
| [3] |
[
|
| [4] |
|
| [5] |
[
|
| [6] |
|
| [7] |
[
|
| [8] |
[
|
| [9] |
|
| [10] |
|
| [11] |
|
| [12] |
|
| [13] |
Siebritz. Assessing the accuracy of open street map data in south africa for the purpose of integrating it with authoritative data[D]. Cape Town: Department of Architecture, Planning and Geomatics University of Cape Town, 2014.
|
| [14] |
[
|
| [15] |
|
| [16] |
[
|
| [17] |
[
|
| [18] |
|
| [19] |
[
|
| [20] |
[
|
| [21] |
[
|
| [22] |
|
| [23] |
|
| [24] |
|
| [25] |
[
|
| [26] |
[
|
| [27] |
[
|
| [28] |
[
|
/
| 〈 |
|
〉 |