Spatio-temporal Pattern of Heat Island and Multivariate Modeling of Impact Factors of Beijing Downtown from 2005 to 2016

  • YU Chen ,
  • HU Deyong , * ,
  • CAO Shisong ,
  • CHEN Shanshan
Expand
  • 1. College of Resources Environment and Tourism, Capital Normal University, Beijing 100048, China
  • 2. Beijing Key Laboratory of Resources, Environment and GIS , Beijing 100048, China
*Corresponding author: HU Deyong, E-mail:

Received date: 2017-07-21

  Request revised date: 2017-09-27

  Online published: 2017-11-10

Copyright

《地球信息科学学报》编辑部 所有

Abstract

Urban heat island effect has been widely concerned as a typical climatic feature of urban area in recent years. Understanding the spatio-temporal evolution and the causes of the formation of urban heat island are of great significance to ease the thermal environment of the city and improve the comfortability for human settlement. Firstly, we retrieved the land surface temperature of Beijing downtown based on Landsat thermal infrared images in 2005, 2010 and 2016. The mean-standard deviation method was used to divide the land surface temperature to obtain multi-grade heat island intensity for analyzing the evolution law and spatial pattern of urban heat island. Secondly, four typical ground feature types, impervious surface, vegetation, bare soil and water body, were extracted. Also, the transfer information of each heat intensity in different years and the relevant thermal landscape pattern indices were calculated. Then, according to the distance from the center of the city, we divided the downtown into 30 ring buffers and analyzed the area ratios of ground feature types and the information of heat island intensity in each ring buffer. Finally, based on the statistical data of each ground feature type and the distance from the downtown, the relationship between the influence factor and the heat island intensity is established. Also, the influence of the ground feature types and the change of the distance on the urban heat island is comprehensively analyzed. The results showed that the overall heat island intensity is increasing every year in Beijing downtown. The high grade of heat island intensity of the thermal patch area gradually expanded. The diversity of the thermal landscape types is decreasing with time. Impervious surface has a great impact on the heat island intensity. The strength of heat island intensity become greater with the percentage growth of impervious surface. The strength of heat island intensity decreases gradually with the increasing distance from the center of the city.

Cite this article

YU Chen , HU Deyong , CAO Shisong , CHEN Shanshan . Spatio-temporal Pattern of Heat Island and Multivariate Modeling of Impact Factors of Beijing Downtown from 2005 to 2016[J]. Journal of Geo-information Science, 2017 , 19(11) : 1485 -1494 . DOI: 10.3724/SP.J.1047.2017.01485
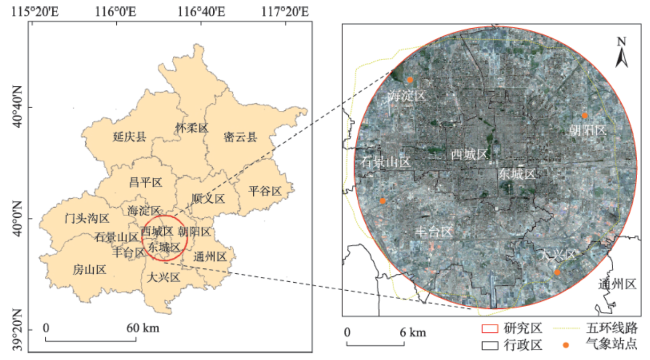
1 引言

近几十年伴随着人口快速增长和经济迅速发展,城市化进程持续加快,这很大程度上改变了城市下垫面的热力性质,并由此产生了城市热岛(Urban Heat Island, UHI)效应 [1-2]。城市热岛效应表现为城市地区相比周围环境有较高的温度[3],其成因受到自然条件、辐射传输和人为活动等多方面的影响[4]。城市建设造成的大规模密集建筑群的形成,城市扩张引起的原有地表下垫面性质的改变,加之人口数量的聚集及工业生产的发生,这些在很大程度上加剧了城市热岛效应的形成,由此带来了日益突出的区域气候问题[5-7],引起社会的广泛关注。因此,研究城市热岛效应的成因及影响因素对改善城市环境、提高居住舒适感有重要的意义。
目前,国内外关于城市热岛效应的研究主要包括基于地表温度的获取分析城市不同下垫面与热环境的关系[8-10];通过地表能量平衡模式对热岛效应的形成机理进行研究[11-12];布设观测仪器并应用数值模拟方法对城市热环境或热岛环流进行模拟分析[13]等。北京市作为中国一线城市及国际化大都市,城市热岛效应显著。自20世纪80年代起,就有开展北京市热岛效应方面的研究[14]。前期研究主要是利用气象站点记录的点状、长时序气温数据进行空间插值,研究区域热岛特征、时空分布变化情况[15-16]。随着多种搭载热红外或相关传感器的卫星发射与应用,遥感技术所具备的快速获取大范围地物信息的优势突显,成为当前城市热岛方面研究的主要方法。刘勇洪等[17]采用气温资料、遥感资料和城市规划资料,定量评估了北京城市热岛现状并预测未来北京城市热岛发展趋势;崔耀平等[18]、宫阿都等[19]从北京市的地表温度与城市下垫面对应关系及变化过程作了分析,证实了城市热岛效应与城市土地利用/覆盖变化的关系密切且易受人为影响;张昌顺等[20]利用站点的温度数据和野外试验数据,对比分析中心城和卫星城城市热岛效应强度及其变化,研究不同城市绿地对北京城市热岛的缓解作用。可见,在对北京市热岛效应研究中,把握城市热岛的时空演变规律,分析与城市发展之间相互关系,研究如何有效缓解热岛效应是研究者的重点关注方向。但研究中多采用以北京市整体或部分行政区划作为研究范围,无法突出受热岛效应影响最为明显的中心城区的表现情况;侧重关注于某一因素对热岛效应影响,忽略了热岛效应形成的复杂性,且缺乏使用定量的模型关系评价影响的强弱。
本文聚焦于北京中心城区热岛的空间格局及影响因子的研究分析。利用热红外遥感影像数据反演地表温度并建立热岛强度的划分方案;统计长时序下各级热岛强度之间的转移信息并计算典型的热力景观格局指数;在获取地物类型的基础上,结合中心城区的距离变化,分析热岛强度时空格局与规律;提取对热岛强度空间格局影响显著的地物即不透水层盖度(Impervious surfaces percentage, ISP)的信息;建立热岛强度的多元关系模型,探讨分析地物类型和距离变化对城市热岛强度的影响。

2 研究区概况及数据源

2.1 研究区概况

以北京市城区中心为起始点,向外每隔0.5 km等间距的划分30级环形缓冲区,由此得到一个为半径为15 km的圆形覆盖范围的研究区,如图1红圈所示。
Fig. 1 The study area

图1 研究区

研究区处于北京市中心城区,边界范围大致与北京市五环线路相符。该范围下人口高度密集、工业集中,加之城区建筑对辐射能量通行的阻碍,由此产生以热岛效应为代表的较为明显的热环境的改变。研究区主要的地物类型是人工修筑的改变土地自然渗透性质的不透水层,具体表现为砖石、沥青、混凝土等物质覆盖的屋顶、道路和停车场等不可透水区域[21],其普遍具有较小的热容量,易吸热且升温快;植被覆盖较为良好的区域集中在城市公园;主要的水域则是流经城区的河流及人工湖等。

2.2 数据来源与预处理

收集覆盖研究区域且晴朗无云的3期Landsat影像,日期分别为2005年11月14日、2010年11月28日和2016年11月28日(成像时间集中在北京时间的上午10:00-11:00)。其中,2005年和2010年采用Landsat5专题制图仪 (Thematic Mapper, TM)的影像数据,2016年使用Landsat8陆地成像仪(Operational Land Imager, OLI)及热红外传感器(Thermal Infrared Sensor, TIRS)的影像数据。TM和TIRS的热红外波段的空间分辨率分别为120 m和100 m,用于反演地表温度。这里将热红外影像分辨率重采样至30 m,便于与可见光等波段的匹配。
本次研究还收集了同时期MODIS(Moderate Resolution Imaging Spectroradiometer)的MOD02产品数据,用于获取地表温度反演时的大气水汽含量信息。为精确的获取地物类型,采用QuickBird高分影像(成像日期2005年6月、2010年10月和2015年8月,空间分辨率为2.4 m)作为地物类型的分类参考数据。对上述数据进行精确的几何配准和重投影,投影方式为UTM,坐标系为WGS-84。

3 研究方法

3.1 热岛强度计算

3.1.1 地表温度反演
Jiménez-Muñoz和Sobrino在2003年提出了普适性单窗算法,该算法公式如下[22]
T s = γ ( λ , T 0 ) { ε λ - 1 ψ 1 ( λ , ω ) L 0 + ψ 2 ( λ , ω ) + ψ 3 ( λ , ω ) } + δ ( λ , T 0 ) (1)
式中:Ts为拟反演地表温度(K);L0为传感器入瞳处辐射亮度(W·m-2·sr-1·μm-1);ελ为比辐射率;γ、δ为中间变量,ψ1、ψ2、ψ3为大气函数,各公式如式(2)-(4)所示。
γ = C 2 L 0 T 0 2 λ 4 C 1 L 0 + 1 λ - 1 (2)
δ = - L 0 γ + T 0 (3)
ψ k = a k , λ w 3 + b k , λ w 2 + c k , λ w ( k = 1,2 , 3 ) (4)
式中:C1、C2是普朗克辐射函数常量,取值分别为 C1=1.191×10⁸ W/(m2·μm·sr),C2=1.439×104 μm·K;T0 是传感器所记录的亮度温度(K);λ是热红外波段的有效作用波长(μm)。ω是大气水汽含量(g/cm2),ak, λbk, λck, λ的取值根据不同传感器的不同热红外波段取值有所改变。
地表的比辐射率则利用红、近红波段数据获取NDVI值,再根据Van的经验公式求得,公式如下[23]
ε = 0.995 ( NDVI 0 0.923 ( 0 < NDVI < 0.157 ) 1.0094 + 0.047 ln ( NDVI ) ( 0.157 < NDVI < 0.727 ) 0.986 ( NDVI 0.727 (5)
大气水汽含量的获取方法则采用MODIS数据通过二通道比值法来获得,公式如下[23]
w = ( α - ln τ w β ) τ w = ρ ( 19 ) / ρ 2 (6)
式中:τw代表大气透过率;ρ(19)和ρ(2)分别表示MODIS数据第19波段和第2波段的表观反射率;α和β为经验常数,针对不同的地表类型有不同的取值,结合北京地区的实际地表类型,分别取值为0.02和0.65[24]
3.1.2 热岛强度等级划分
使用均值标准差(Mean-standard Deviation)分类法对热岛强度进行划分。该分类方法首先计算研究区范围的地表温度平均值与标准差,之后根据这2个参数将研究区的地表温度分为7个等级,并按照划分等级由低到高的顺序,将热岛分类结果依次命名为1级、2级、3级、4级、5级、6级和7级。计算公式如下[25]
T = A ± x · sd (7)
式中:T为计算的温度阈值;A为研究区平均地表温度;sd为研究区地表温度标准差,x表示标准差的倍数,取值为0.5、1.0、1.5。
为定量评价不同等级热岛强度的相对强弱,将所得7个等级从低到高依次赋值1至7,值越高代表所对应的热岛强度越明显。

3.2 热岛格局分析方法与影响因子提取

3.2.1 基于地物盖度提取的地物分类
依据城市地表下垫面特征,将研究区地物分为水体、裸土、植被、不透水层4大类型。由于研究范围集中在城区中心,各类地物空间上相互交叉邻近,在Landsat遥感影像上混合像元现象较为严重,直接分类效果较差。因此,采取在地物盖度提取的基础上完成研究区的地物分类。地物盖度是指单位面积下各类地物的面积占比,其中的不透水层盖度是研究城市水文,热岛效应和专题制图的关键环境指标[26]。使用高分辨率的QuickBird影像进行非监督分类,之后将该分类结果的单位面积从2.4 m×2.4 m匹配至30 m×30 m的范围以与Landsat影像栅格建立联系,统计 Landsat影像各个栅格下的不同地物类型的盖度。通过对各地物盖度数据设定判断阈值决定Landsat单一栅格的分类情况,最终得到空间分辨率为30 m下的地物分类结果。
3.2.2 热岛强度转移矩阵
转移矩阵可用于表示区域内从一段时间的开始到结束时各地物面积之间相互转化的动态过程信息。这里统计不同等级的热岛强度在一定时间段内相互的转移概率,以获取各热岛强度初态面积转出和末态面积转入的信息。热岛转移矩阵的形式如下[27]
s ij = s 11 s 12 ... s 1 n s 21 s 22 ... s 2 n ... ... ... ... s n 1 s n 2 ... s nn (8)
式中:s代表面积;n代表转移前后的不同热岛强度;iji, j=1,2,…, n)分别代表转移前与转移后的热岛强度;sij表示转移前的i类热岛强度转换成转移后的j类热岛强度的面积。
3.2.3 热力景观格局
热力景观由具有异质性的相互连接的热场斑块组成,是对人类与城市热环境相互作用的一种体现。热力景观格局指数是对城市热力景观的一种定量描述,能够反映热场的空间分布特征和属性。
为说明热岛强度对城市热环境的影响,本文选取了所划分的热岛强度的热力斑块并从景观水平方面进行了斑块景观指数的统计,使用的热力景观格局指数[28]包括斑块密度(Patch Density, PD)、最大斑块指数(Largest Patch Index, LPI)、聚集度指数(Aggregation Index, AI)3种分类指数和香农多样性指数(Shannon Diversity Index, SHDI)、蔓延指数(Contagion Index, CONTAG)2种全局指数,从不同侧面说明城市热岛变化对城市热环境的影响。
对所使用的各热力景观格局指数的定义,其中,PD反映景观在空间分布上的破碎程度和数量,其值越小,斑块越大,破碎程度越低;LPI表示某一景观类型中大斑块的分布程度,值的大小决定着景观中的优势类别;AI体现了空间信息的情况,指数值的大小说明景观中团聚的大斑块的相对多少;SHDI和CONTAG则分别用来描述景观元素类型的丰富程度和复杂程度和景观中不同类型斑块的团聚性或延展性。

4 结果和分析

4.1 地物分类及地表温度反演精度分析

分别对每个年份的各类地物随机选择100个观测点(共计1200个),通过目视判读的方法评价地物分类的精度情况。由表1可见,结果虽存在一定误差,但总体的分类精度较好,结果可靠。
Tab. 1 Statistics of classification accuracies

表1 地物分类精度统计

分类数据 参考数据
水体 裸土 植被 不透水层 用户精度/%
水体 264 10 4 22 88.00
裸土 6 269 5 20 89.67
植被 7 6 280 7 93.33
不透水层 14 2 1 283 94.33
制图精度/% 90.72 93.73 96.55 85.24
全局精度/% 91.33
全局Kappa 0.8844
为分析地表温度反演结果的精度,将2016年反演得到的地表温度空间分布数据与研究区内的气象站点的位置信息进行叠加,提取出相应位置像元的地表温度值,并与卫星过境时刻(10:53)的实时气温值(逐小时记录,选取11:00的数据)进行比较,结果见表2。可以看出,各站点的气温数据与所对应的地表温度差值在2 ℃内,且地表温度平均值与气象站点的平均实测气温较为接近,相较约高0.2 ℃,反演精度可以接受。
Tab. 2 Comparison of the retrieved results of land surface temperature with air temperature (℃)

表2 地表温度的反演结果与气温的对比 (℃)

站点号 站名 地表温度 气温 差值
54399 海淀 5.9 4.0 1.9
54433 朝阳 4.6 4.2 0.4
54511 北京 5.8 5.2 0.6
54514 丰台 4.2 6.4 -2.2
平均值 5.1 4.9 0.2

4.2 中心城区热岛效应时空变化特征

中心城区热岛效应的空间分布规律大体上呈现南高北低的形式,如图2(a)所示。随着年代推移城区中心区域热岛强度有明显升高。高等级热岛强度的面积随时间变化有逐渐增加的趋势。统计从二环至五环各个环线间高于4级热岛强度的面积占比情况,发现在二环内热岛强度变化最大,从2005和2010年的20.6%、19.8%快速增长到2016年的42.1%;其次是二三环路间,三个时期的占比为13.6%、15.0%和32.8%;三四环路间与四五环路间年际变化相对平缓,平均占比分别为23.4%和23.3%。由图2(b)不同年份下地物类型的空间分布结果可见,中心城区不透水层地物类型的占比极高,年平均占比81.9%。水体和植被的年平均占比相对较少,分别为1.3%和7.8%。
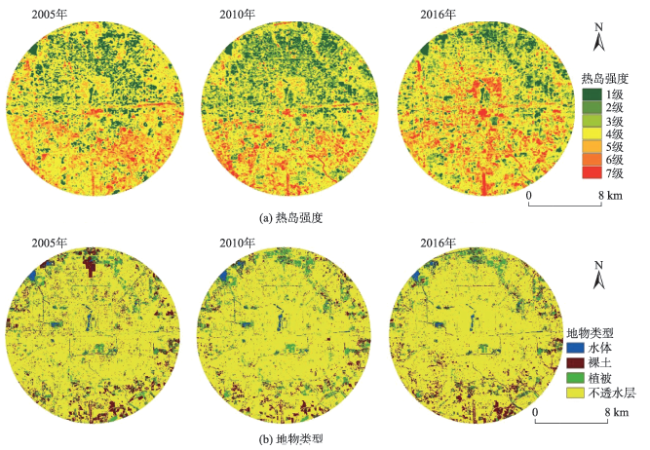
Fig. 2 Central city proper: Spatial distribution of urban heat intensity and spatial distribution of ground feature types

图2 中心城区热岛强度和地物类型的空间分布

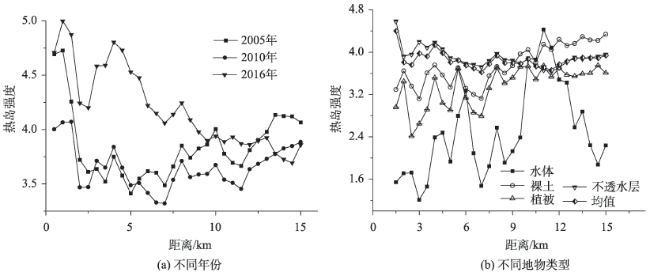
Fig. 3 Statistics between heat island intensity values and distance

图3 热岛强度随距离的变化

基于热岛等级划分方案,统计得到不同年份各缓冲区热岛强度的均值,如图3(a)所示。热岛强度随距市中心距离的增加上下波动,但整体呈现下降趋势。2005-2010年,各距离下热岛强度较为接近,变化趋势相似;2010-2016年,距城区中心10 km范围内热岛强度有较大的提高,之后趋于平缓。
对不同缓冲区下的不同地物类型进行统计,得到不同地物类型热岛强度均值随城区中心距离变化的统计结果,如图3(b)所示。对比各类地物发现,4种地物类型随距离变化,总体表现的热岛强度大小关系为不透水层>裸土>植被>水体。不透水层、裸土的地表温度变化平缓,植被及水体有较明显的波动。在有植被覆盖或包含水体的区域热岛强度相应较低,高热岛区主要分布于不透水层和裸土,且不透水层的热岛强度随距离增加有缓慢下降趋势。不透水层、裸土、植被、水体的平均热岛强度依次为3.95、3.76、3.35和2.33。
Tab. 3 Transition matrix of heat island intensity (%)

表3 热岛强度转移矩阵(%)

2005-2010/2010-2016 1级 2级 3级 4级 5级 6级 7级
1级 42.5/37.4 12.6/8.2 7.9/4.0 4.1/2.5 2.6/2.5 2.3/2.6 3.0/2.1
2级 34.1/28.5 35.0/15.5 22.6/8.6 8.0/3.4 3.2/2.4 2.5/2.2 1.9/1.4
3级 15.6/22.6 35.0/31.8 38.2/23.7 19.9/8.4 6.3/4.8 4.4/3.9 3.9/3.6
4级 6.6/10.4 15.7/41.8 29.0/52.4 53.0/47.4 43.2/33.2 28.4/28.1 24.7/20.6
5级 0.8/0.6 1.0/2.2 1.6/8.9 10.8/26.3 26.8/26.4 26.5/22.1 21.2/16.4
6级 0.3/0.3 0.4/0.4 0.5/2.2 3.2/10.0 12.8/20.7 22.0/19.8 20.1/14.7
7级 0.3/0.2 0.3/0.1 0.3/0.2 1.0/2.0 5.1/10.1 13.9/21.4 25.2/41.2
2005-2010年和2010-2016年北京市中心城区各热岛强度的转移矩阵如表3所示。对比分析2个时期的转移矩阵发现:①各热岛强度间的转化较为频繁,4级热岛作为连接其他等级热岛强度的重要中间过渡,转出率稳定在50%左右; ②2005-2010年1-3级热岛的转出率为57.5%、65%和62.8%,2010-2016年对应的转出率为62.6%、84.5%和72.3%。转出率较高,转出方向集中在这些热岛强度的内部。可见在中心城区下,1-3级热岛的变化较为稳定,且向高等级热岛的变动趋势随年份推移有所加剧; ③2005-2010年和2010-2016年5-7热岛的内部平均转化率为57.9%和64.2%,主要的转出方向是4级热岛,平均转出率为32.1%和27.3%。该部分热岛强度的转化与4级热岛关系密切且变化幅度较大,可见高等级的热岛部分更易受人为环境的影响。

4.3 中心城区热力景观格局变化

不同年份的热力景观格局指数如图4所示。结合各指数意义及结果进行分析,发现以下特征: ① 4级热岛是热力景观中的优势类别,大斑块的分布程度高且聚集破碎程度低;随时间推移,4级热岛热力斑块破碎程度提高,最大斑块面积减小,而4级以上热岛的热力斑块变化相反,反映了高等级热岛强度的景观格局的发展。② 较低等级的热岛(1-3级热岛)破碎程度相对高于较高等级的热岛(5-7级热岛),且这些等级的热岛都不具备明显的大斑块分布;最低、最高的热岛强度表现呈聚集的小斑块形态,说明实际中极端的热岛强度占比小且相对集中;③ 随着年份时间的变化,不同热岛强度的斑块连通性较为稳定,但景观类型的多样性呈下降趋势,丰富度降低。
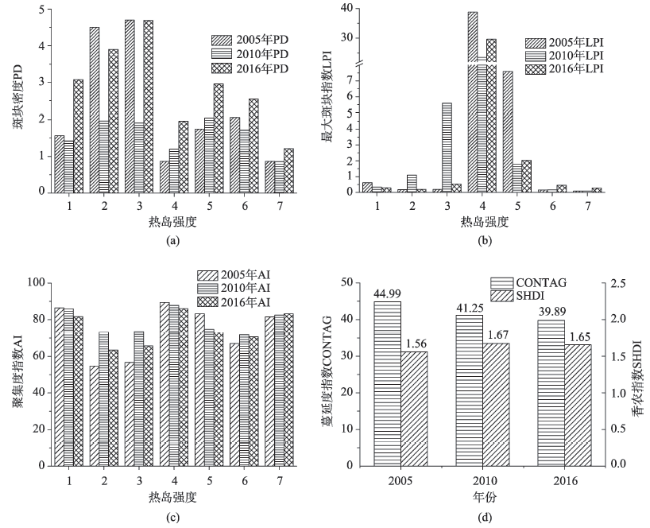
Fig. 4 Statistics on assessment index of thermodynamic landscape

图4 热力景观评价指数统计

4.4 中心城区热岛影响因子的多元建模

在2005-2016年的时间跨度下,不透水层与年平均的热岛强度在走势和数值大小上较为吻合。同样,根据建立的多级环形缓冲区,统计2005、2010和2016年不透水层盖度随距离的变化情况发现,不透水层盖度随距离的增大逐渐降低,与热岛强度的变化趋势相似。
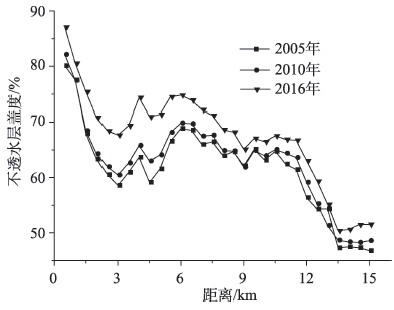
Fig. 5 Variation between ISP and distance in different years

图5 各年份不透水层盖度随距离的变化

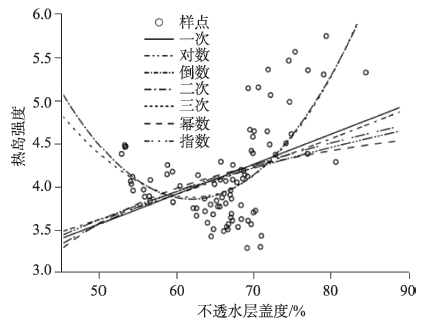
Fig. 6 Regression analysis of heat island intensity values and ISP

图6 热岛强度与不透水层盖度的回归分析

热岛强度与不透水层盖度之间所具有的相似性,表明不透水层对热岛强度的影响显著,两者关联明显。进一步研究不透水层盖度与热岛强度的相互关系,使用多种函数式对二者关系进行描述(图5、6)。对比发现,在二次函数式的拟合条件下,二者相关系数R最高,达0.657,且显著性水平较高,相关性检验信度达完全显著水平。不透水层盖度和热岛强度的关系可表述为:
y UHI , C = 0.002 x ISP 2 - 0.217 x ISP + 10.047 (9)
式中:yUHI,C是热岛强度初步的计算值;xISP是不透水层盖度。
由式(9)进行计算,发现计算得到的各距离下的热岛强度结果明显高于实际记录的热岛强度,高于的比例为97.8%,平均高出原始值0.56个热岛强度。这表明式(9)的计算会高估热岛强度,由此需进一步综合考虑其他地物类型和距离对温度的调节作用。将各个缓冲区下的水体、植被、裸土占比和距离值均视为独立变量,对热岛强度与原始值的差值进行拟合,进行对结果进行修正和调节。计算公式如下:
y UHI , A = 1.197 x W - 0.567 x V + 5.974 x s - 0.037 x D - 0.666 (10)
式中:yUHI,A是指热岛强度的实际记录值和计算值的差值;xWxVxS为水体、植被、土壤面积的百分比;xD是各级缓冲区距中心的距离值(km)。
由此,考虑了多种地物类型及距离对热岛强度影响的多元关系模型可表示为:
y UHI = 0.002 x ISP 2 - 0.217 x ISP + 1.197 x W - 0.567 x V + 5.974 x s - 0.037 x D + 9.381 (11)
利用该模型计算所得的热岛强度与原始热岛强度的平均值的误差等于0.02,标准差为0.23。该模型可用于描述热岛强度与地物类型、距离之间的关系。由各影响因子的系数可知,中心城区的植被对热岛效应有可靠的缓解效应(系数为-0.567),而水体易受环境影响,随距离变化的波动较大,无显著的热岛缓解效应。随着距市中心距离的增大,模型中xD值也逐渐增大,系数为负,说明随距离的增大,热岛强度在逐渐减小。

5 结论

本文以北京市中心城区为例,基于长时序的遥感影像数据,集中分析了热岛效应在不同地物类型下,随年份时间及空间距离的变化趋势和演变特征,计算获取了热岛强度转移和热力景观信息。具体结论如下:
(1)2005-2016年北京中心城区平均热岛强度呈逐年上升的趋势;各时期的热岛强度随城区距离变化的走势具有相似性,且热岛强度随距离的增加有明显降低趋势。
(2)随着时间推移,热力景观类型的多样性下降,高等级的热岛聚集程度提高且热力斑块面积增加,导致热岛效应加剧;4级热岛是热力景观中的优势类别,其对热岛格局形成和热岛强度转移均有重要的作用。
(3)在建立中心城区的热岛强度与不透水层盖度关系模型的基础上,综合分析了水体、植被、裸土地物类型的面积占比和距离对热岛强度的影响,并进一步建立了热岛强度与各影响因子之间的多元关系模型,模型计算的误差平均值等于0.02,标准差为0.23。
(4)不透水层的热岛强度与年平均的热岛强度在空间距离的变化相近。研究发现不透水层作为中心城区下垫面的主要类型,是产生城市热岛效应的重要因素,且对热岛强度的空间分布影响显著。植被对城市热岛效应具有缓解作用,且中心城区的热岛强度随着距市中心距离的增大而减弱。
本文分析了地物类型和距离对热岛强度的影响,并获得了一些初步结果。同时本研究也存在相应的不确定因素,一是为统一时间节点,将三期影像都选在冬季,而忽略了与其他季节的对比;二是只以等距离的缓冲范围为基础进行热岛强度方面的考量,未考虑方向性的变化情况。城市热岛的形成过程和影响因素复杂,在进一步研究中需考虑各地物类型生态景观指数和城市形态特征对地表温度的影响,深入分析城市尺度下多种因素对城市热岛的影响。

The authors have declared that no competing interests exist.

[1]
Masek J G, Lindsay F E, Goward S N.Dynamics of urban growth in the Washington D C metropolitan area, 1973-1996, from Landsat observations[J]. International Journal of Remote Sensing, 2000,21(18):3473-3486.Like other human-induced landcover changes, urbanization represents a response to specific economic, demographic, or environmental conditions. We use the Washington D.C. area as a case study to relate satellite-derived estimates of urban growth to these economic and demographic drivers. Using the Landsat data archive we have created a three epoch timeseries for urban growth for the period 1973-1996. This map is based on a NDVI-differencing approach for establishing urban change filtered with a landcover classification to minimize confusion with agriculture. Results show that the built-up area surrounding Washington DC has expanded at a rate of 芒聢录22km2 per year during this period, with notably higher growth during the late-1980s. Comparisons with census data indicate that the physical growth of the urban plan, observable from space, can be reasonably correlated with regional and national economic patterns.

DOI

[2]
Hove L W A V, Jacobs C M J, Heusinkveld B G, et al. Temporal and spatial variability of urban heat island and thermal comfort within the Rotterdam agglomeration[J]. Building & Environment, 2014,83:91-103.61We analyse three years of meteorological observations within the Rotterdam agglomeration.61The UHI effect and its intra-urban variability are considerable throughout the year.61We present quantitative information about the impact of urban characteristics on UHI.61Differences in wind velocity mainly determine intra-urban variability in PET during daytime.61High UHI intensity at a location not always coincides with large thermal discomfort.

DOI

[3]
Voogt J A, Oke T R.Thermal remote sensing of urban climates[J]. Remote Sensing of Environment, 2003,86(3):370-384.Thermal remote sensing has been used over urban areas to assess the urban heat island, to perform land cover classifications and as input for models of urban surface atmosphere exchange. Here, we review the use of thermal remote sensing in the study of urban climates, focusing primarily on the urban heat island effect and progress made towards answering the methodological questions posed by Roth et al. [International Journal of Remote Sensing 10 (1989) 1699]. The review demonstrates that while some progress has been made, the thermal remote sensing of urban areas has been slow to advance beyond qualitative description of thermal patterns and simple correlations. Part of the difficulty lies in the tendency to use qualitatively based land use data to describe the urban surface rather than the use of more fundamental surface descriptors. Advances in the application of thermal remote sensing to natural and agricultural surfaces suggest insight into possible methods to advance techniques and capabilities over urban areas. Improvements in the spatial and spectral resolution of current and next-generation satellite-based sensors, in more detailed surface representations of urban surfaces and in the availability of low cost, high resolution portable thermal scanners are expected to allow progress in the application of urban thermal remote sensing to the study of the climate of urban areas.

DOI

[4]
Radhi H, Fikry F, Sharples S.Impacts of urbanisation on the thermal behaviour of new built up environments: A scoping study of the urban heat island in Bahrain[J]. Landscape & Urban Planning, 2013,113(113): 47-61.The recent process of urbanisation in the Gulf Cooperation Council Countries (GCCC), including Bahrain, can increase ambient and surface temperatures in newly developed built up areas - the urban heat island (UHI) effect. This study investigates urban expansion in Bahrain over the last few decades and assesses its impact on atmospheric urban heat islands using remote sensing, advanced statistics of weather data and geographical information system (GIS). The study examines how the thermal behaviour of new urban areas is affected by urban elements, with two district models being considered. Numerical modelling is used to assess wind flow, temperatures and heat distribution fluxes within the two models. The assessment shows that mean air temperatures increase within the range of 2 degrees C-5 degrees C. The magnitude of the UHI is mainly reinforced by urban activity such as on-going construction processes, shrinkage of green areas and sea reclamation. A comparison of results between the two studied districts reveals that the mean temperature is increased by 2 degrees C-3 degrees C in new artificial islands, and by 3 degrees C-5 degrees C in deserted urban lands with hot arid conditions. The distribution of urban radiant heat islands is varied and depends largely on the type of land cover and urban surface. Urban grids and structure have a significant impact on the thermal behaviour of newly developed built up areas. Human comfort is improved in the presence of water bodies and green areas. (C) 2013 Elsevier B.V. All rights reserved.

DOI

[5]
Coulon F, Jones K, Li H, et al.China's soil and groundwater management challenges: Lessons from the U K's experience and opportunities for China[J]. Environment International, 2016,91:196-200.There are a number of specific opportunities for UK and China to work together on contaminated land management issues as China lacks comprehensive and systematic planning for sustainable risk based land management, encompassing both contaminated soil and groundwater and recycling and reuse of soil. It also lacks comprehensive risk assessment systems, structures to support risk management decision making, processes for verification of remediation outcome, systems for record keeping and preservation and integration of contamination issues into land use planning, along with procedures for ensuring effective health and safety considerations during remediation projects, and effective evaluation of costs versus benefits and overall sustainability. A consequence of the absence of these overarching frameworks has been that remediation takes place on an ad hoc basis. At a specific site management level, China lacks capabilities in site investigation and consequent risk assessment systems, in particular related to conceptual modelling and risk evaluation. There is also a lack of shared experience of practical deployment of remediation technologies in China, analogous to the situation before the establishment of the independent, non-profit organisation CL:AIRE (Contaminated Land: Applications In Real Environments) in 1999 in the UK. Many local technology developments are at lab-scale or pilot-scale stage without being widely put into use. Therefore, a shared endeavour is needed to promote the development of technically and scientifically sound land management as well as soil and human health protection to improve the sustainability of the rapid urbanisation in China.

DOI PMID

[6]
Qu J, Fan M.The current state of water quality and technology development for water pollution control in China[J]. Critical Reviews in Environmental Science and Technology, 2010,40:519-560.This paper summarizes and presents an overview of the current state of water pollution, as well as recent progress and the potential future development of water pollution control technology, in China. Although China has made significant strides in water environmental protection over the past decades, analysis reveals that water pollution in the nation is still not sufficiently controlled, with a number of surface waters currently suffering varying degrees of pollution. High nitrogen and phosphorous concentrations in many great lakes have caused eutrophication problems, and the frequency of blue algal bloom has increased. Likewise, river pollution has not been effectively controlled. Nitrogen, phosphorous, organic compounds, and heavy metals are ubiquitous in China's rivers, with up to 80% of urban rivers contaminated to varying degrees鈥攁 situation that continues to deteriorate. Next, eutrophication has occurred in many large reservoirs, with numerous toxic substances negatively affecting water quality. Finally, over-exploitation has caused groundwater quality to deteriorate, and pollution from heavy metals, nitrates, fluorine, and random organic matter has become a primary water quality issue. To resolve these complex environmental problems, water pollution controls and quality improvement technologies have been rapidly developed in China in recent years. Ecological restoration, biological disposal, advanced chemical oxidation, high-efficiency adsorption, and flocculation technologies have been especially prominent in these efforts. Not only have these developments introduced practical innovation to the core technologies, they have also prioritized their systematic integration and application. In order to prevent and control the pollution of lakes and rivers, improve general water quality, and ensure the safety of drinking water supplies, China must perform systematic research on management, pollution control and treatment, ecological restoration, and related water treatment and purification technologies over the next 5 to 15 years through a series of major technology initiatives. These programs will supply the scientific foundation and technological support for achieving the optimum improvement of China's water quality.

DOI

[7]
Taniguchi M, Burnett W C, Ness G D.Erratum to "Integrated research on subsurface environments in Asian urban areas"[J]. Science of the Total Environment, 2009,407(9):3076-3088.

DOI

[8]
刘东,李艳,孔繁花.中心城区地表温度空间分布及地物降温效应——以南京市为例[J].国土资源遥感,2013,25(1):117-122.基于TM图像,采用灰度图像分割算法,自动提取南京市中心城区的不透水面、植被及水体;并用单窗算法反演了地表温度;依据离市中心的距离将中心城区分为45级缓冲区,依次统计分析每一级缓冲区内的平均温度、不透水面温度、植被温度、水体温度及各类地物的面积比例等;建立了地表温度与不透水面比例、植被比例、水体比例之间的关系模型。研究结果表明:随离市中心距离的增大,地表温度降低;植被、水体具有降温效应,水体的降温效应是植被的2.43倍;地表温度与不透水面比例、植被比例、水体比例的综合关系模型模拟效果较好。

DOI

[ Liu D, Li Y, Kong F H.Spatial distribution of land surface temperature in central city proper and the cooling effects of the objects: A case study of Nanjing[J]. Remote Sensing for Land and Resources, 2013,25(1):117-122. ]

[9]
Kumar D, Shekhar S.Statistical analysis of land surface temperature-vegetation indexes relationship through thermal remote sensing[J]. Ecotoxicology & Environmental Safety, 2015,121:39-44.Vegetation coverage has a significant influence on the land surface temperature (LST) distribution. In the field of urban heat islands (UHIs) based on remote sensing, vegetation indexes are widely used to estimate the LST鈥搗egetation relationship. This paper devises two objectives. The first analyzes the correlation between vegetation parameters/indicators and LST. The subsequent computes the occurrence of vegetation parameter, which defines the distribution of LST (for quantitative analysis of urban heat island) in Kalaburagi (formerly Gulbarga) City. However, estimation work has been done on the valuation of the relationship between different vegetation indexes and LST. In addition to the correlation between LST and the normalized difference vegetation index (NDVI), the normalized difference build-up index (NDBI) is attempted to explore the impacts of the green land to the build-up land on the urban heat island by calculating the evaluation index of sub-urban areas. The results indicated that the effect of urban heat island in Kalaburagi city is mainly located in the sub-urban areas or Rurban area especially in the South-Eastern and North-Western part of the city. The correlation between LST and NDVI, indicates the negative correlation. The NDVI suggests that the green land can weaken the effect on urban heat island, while we perceived the positive correlation between LST and NDBI, which infers that the built-up land can strengthen the effect of urban heat island in our case study. Although satellite data (e.g., Landsat TM thermal bands data) has been applied to test the distribution of urban heat islands, but the method still needs to be refined with in situ measurements of LST in future studies.

DOI PMID

[10]
Chen X L, Zhao H M, Li P X, et al.Remote sensing image-based analysis of the relationship between urban heat island and land use/cover changes[J]. Remote Sensing of Environment, 2006,104(2):133-146.Global warming has obtained more and more attention because the global mean surface temperature has increased since the late 19th century. As more than 50% of the human population lives in cities, urbanization has become an important contributor for global warming. Pearl River Delta (PRD) in Guangdong Province, southern China, is one of the regions experiencing rapid urbanization that has resulted in remarkable Urban Heat Island (UHI) effect, which will be sure to influence the regional climate, environment, and socio-economic development. In this study, Landsat TM and ETM+ images from 1990 to 2000 in the PRD were selected to retrieve the brightness temperatures and land use/cover types. A new index, Normalized Difference Bareness Index (NDBaI), was proposed to extract bare land from the satellite images. Additionally, Shenzhen, which has experienced the fastest urbanization in Guangdong Province, was taken as an example to analyze the temperature distribution and changes within a large city as its size expanded in the past decade. Results show that the UHI effect has become more prominent in areas of rapid urbanization in the PRD region. The spatial distribution of heat islands has been changed from a mixed pattern, where bare land, semi-bare land and land under development were warmer than other surface types, to extensive UHI. Our analysis showed that higher temperature in the UHI was located with a scattered pattern, which was related to certain land-cover types. In order to analyze the relationship between UHI and land-cover changes, this study attempted to employ a quantitative approach in exploring the relationship between temperature and several indices, including the Normalized Difference Vegetation Index (NDVI), Normalized Difference Water Index (NDWI), Normalized Difference Bareness Index (NDBaI) and Normalized Difference Build-up Index (NDBI). It was found that correlations between NDVI, NDWI, NDBaI and temperature are negative when NDVI is limited in range, but positive correlation is shown between NDBI and temperature.

DOI

[11]
Guo G, Zhou X, Wu Z, et al.Characterizing the impact of urban morphology heterogeneity on land surface temperature in Guangzhou[J]. China Environmental Modelling & Software, 2016,84:427-439.The urban morphology is regarded as one of the main reasons for urban heat island (UHI). However, its effect on UHI in city-scale urban areas has seldom been examined. In this paper, we presented a rule-based regression model for investigating the nonlinear relationship between land surface temperature (LST) and urban morphology represented by building height, building density and sky view factor (SVF) across different dates in 2005. Results found that an urban morphology of medium building height and lower density significantly yielded higher LST variation levels, whereas the lowest LST variation levels occurred in high-rise and high-dense building arrays. Compared to building height, building density had a stronger influence on LST. Medium SVF values produced the lowest LST, whereas the largest and smallest SVF values produced the highest LST. Results also showed how rule-based regression model offer great performance in detecting the nonlinear mechanisms of LST as well.

DOI

[12]
Salvati A, Roura H C, Cecere C.Assessing the urban heat island and its energy impact on residential buildings in Mediterranean climate: Barcelona case study[J]. Energy & Buildings, 2017,146:38-54.In the light of the results, the UHI intensity in Mediterranean context should be properly considered in performing energy evaluations for urban contexts, since standard meteorological data from airport weather stations are not found to be accurate enough.

DOI

[13]
Bonafoni S, Baldinelli G, Verducci P.Sustainable strategies for smart cities: Analysis of the town development effect on surface urban heat island through remote sensing methodologies[J]. Sustainable Cities & Society, 2017,29:211-218.The proposed analysis with remote sensing data may be considered an effective indicator able to point out if urban changes like interventions and new constructions move towards an urban sustainable development in terms of SUHI mitigation.

DOI

[14]
张景哲,刘继韩,周一星,等.北京市的城市热岛特征[J].气象科技,1982(3):32-35.

[ Zhang J Z, Liu J H, Zhou Y X, et al.Characteristics of urban heat island in Beijing[J]. Meteorological Science and Technology, 1982,3:32-35. ]

[15]
王君,严中伟,李珍,等.近30年城市化对北京极端温度的影响[J].科学通报,2013,58(33):3464-3470.基于1978~2008年北京地区20站均一化逐日气温资料,评估了城市化对温度和极端温度变化的影响。与以往研究不同,此研究采用聚类分析,客观地将观测站点分为4类(城市站、近郊站、乡村站和山地站),并利用遥感夜晚灯光数据验证了分类结果的合理性。近30年来,城市化所致城市热岛增强的效应对城市站点平均气温增温趋势的贡献为10.9%(影响最大的站点该贡献达18.4%或0.12℃/10 a),对最低气温增温趋势的贡献为12.7%(影响最大的站点该贡献达20.8%或0.19℃/10 a),对温度日较差下降趋势的贡献为24%(影响最大的站点该贡献达37.4%或0.15℃/10 a)。城市化效应对城市站点最高温度影响较小,但对极端暖夜(冷夜)的增加(减少)趋势贡献为12.7%或2.07 d/10 a(29.0%或5.06 d/10 a)。

[ Wang J, Yan Z W, Li Z.Impact of urbanization on changes in temperature extremes in Beijing during 1978-2008[J]. Chinese Science Bulletin, 2013,58(33):4679-4686. ]

[16]
杨萍,肖子牛,刘伟东.北京气温日变化特征的城郊差异及其季节变化分析[J].大气科学,2013,37(1):101-112.本文利用北京地区近4年67个自动气象站的逐小时气温观测资料,基于北京地区气温的日变化特征,通过分析日最高、最低气温出现时间的概率分布,研究了城区、郊区气温的日变化差异及季节特征.此外,进一步分析研究了不同单位时间间隔变温的日变化特征,及最大变温出现时间的概率分布情况.研究结果表明:平均而言,城区最高温度出现的时间偏晚,而最低温度出现的时间城区偏早于郊区,与郊区相比,北京城区站点温度的日变化特征更为一致,最高(低)温度出现的时间更加集中;温度日变化的特征随季节有明显的变化,最高温度出现时间在秋、冬两季最为集中,在春季和夏季较为分散;而最低温度出现时间在春、夏两季最为集中,在秋季和冬季最为分散.一天中正、负变温过程具有非对称特征,正变温是比较急剧的过程,负变温相对比较缓慢,北京城区站点的变温幅度小于郊区,春、秋和冬季变温幅度较大,夏季变温幅度最小.不同单位时间内变温速率的分析表明,最强的变温过程一般在3小时以内;最大变温出现时间的概率分布分析表明,最大正变温出现时间在冬季最为集中,夏季最为分散;而最大负变温在秋季最为集中,在春季最为分散.最高(低)温度、变温的城、郊特征差异主要是由于城市热容量比郊区大,且具有更多变化的复杂性而形成的.温度日变化的特征和其区域、季节差异性的揭示,不仅有助于更好地认识和理解区域气候特征和城市化对气温的影响,也可以为做好精细化的天气预报提供气候背景参考.

DOI

[ Yang P, Xiao Z N, Liu W D.Comparison of diurnal variation of air temperature in urban and rural areas of Beijing and its seasonal variation[J]. Chinese Journal of Atmospheric Sciences, 2013,37(1):101-112. ]

[17]
刘勇洪,徐永明,马京津,等.北京城市热岛的定量监测及规划模拟研究[J].生态环境学报,2014,23(7):1156-1163.为定量地评估北京城市热岛现状并预测未来北京城市热岛发展趋势,分别采用气温资料、遥感资料 和城市规划资料进行了研究分析。对北京20个气象台站按照台站距离城市中心的距离划分为远郊、近郊和城市三类,分别计算三种类型站点经过海拔订正后的年平 均气温,利用1971-2012年城市站和远郊站的年平均气温差值估算北京气温热岛的时间变化;利用1987-2012年的NOAA/AVHRR和 Landsat-TM两种不同分辨率的卫星资料,采用定量化的指标--地表热岛强度和热岛比例指数分别估算了不同时期北京地区和城六区热岛强度和范围,并 对北京平原地区的城市热岛状况进行了评估;利用2020年的北京城市规划土地利用资料,结合2008年的城市热岛现状监测结果对2020年的北京热岛状况 进行了模拟分析。研究结果表明,北京城市的气温热岛与遥感监测地表热岛在时间变化趋势上具有一致性,不同分辨率卫星资料监测地表热岛在时空分布上也具有一 致性。其中1971-2012年,以年平均气温计算的北京城市热岛强度增温率为0.33℃·(10 a)-1,近5年(2008-2012)平均热岛为1.12℃。遥感监测结果显示1987-2001年北京地区的热岛持续增强,2001年之后由于北京申 奥的成功进行了大面积的旧城改造和绿化,使得城市热岛强度和范围在2004年和2008年有所降低,2008年之后城市热岛继续向东、南和北方向扩展,并 出现了中心城区热岛与通州、顺义、大兴、昌平热岛连成片的趋势,到2012年城六区热岛面积百分比已从1990年的31%增加到77%。由热岛比例指数确 定的北京各区县热岛强度排名前三分别是城区、海淀和丰台,延庆县最低。对2020年城市规划图热岛模拟结果显示北京热岛已由“摊大饼”演变为“中心+周边 分散”模式,中心城区热岛强度和范围明显减弱,周边广大远郊区将出现分散17

DOI

[ Liu Y H, Xu Y M, Ma J J, et al.Quantitative assessment and planning simulation of Beijing urban heat island[J]. Ecology and Environmental Sciences, 2014,23(7):1156-1163. ]

[18]
崔耀平,刘纪远,秦耀辰,等.北京城市扩展对热岛效应的影响[J].生态学杂志,2015,34(12):3485-3493.lt;div style="line-height: 150%">以北京市为例,基于多期土地利用变化(LUCC)数据集,城市和郊区气象观测数据及一期Landsat TM影像,对北京市的城市扩展与地表温度和近地表气温的对应关系及变化过程作了分析。利用混合像元分解技术实现北京市区下垫面的分类,并联立&ldquo;单窗算法&rdquo;反演的地表温度数据进行分析,在北京市范围内利用多期LUCC和气象站点观测数据,对北京城市扩展对气候的影响进行时间和空间上的综合评价。结果表明:北京市地表温度的高低主要与不透水层的比例有关,不透水层对地表增温的作用要大于植被层的降温作用;从时间上看,初步证实了城市热岛强度前期随着城市扩展而增加,但在一定条件下,其强度随城市扩展并非一味升高,反而会出现一定程度上的稳定甚至降低现象。</div><div style="line-height: 150%">&nbsp;</div>

[ Cui Y P, Liu J Y, Qin Y C, et al.The impact of urban expansion on heat island intensity in Beijing[J]. Chinese Journal of Ecology, 2015,34(12):3485-3493. ]

[19]
宫阿都,陈云浩,李京,等.北京市城市热岛与土地利用/覆盖变化的关系研究[J].中国图象图形学报,2007,12(8):1476-1482.本文以北京市为例,在遥感和GIS技术的支持下,以TM热红外遥感影像定量反演的城市地表温度为基础,分析了城市热岛效应与城市土地利用/覆盖变化的关系,以期为缓解城市热岛效应提供科学依据。

DOI

[ Gong A D, Chen Y H, Li J, et al.A study on relationship between urban heat island and urban land use and cover changes in Beijing[J]. Journal of Image and Graphics, 2007,12(8):1476-1482. ]

[20]
张昌顺,谢高地,鲁春霞,等.北京城市绿地对热岛效应的缓解作用[J].资源科学,2015,37(6):1156-1165.按照城市功能定位将北京市分为中心城、卫星城和郊区,利用2005-2011年的19个站点逐日3个时次(8∶00、14∶00、20∶00)的温度数据,对比分析中心城和卫星城城市热岛效应强度及其变化,同时利用野外试验数据,对比研究不同城市绿地对北京城市热岛的缓解作用。结果表明:①各时次年平均气温中心城&gt;卫星城&gt;郊区,且中心城和卫星城年平均气温波动上升,而郊区却波动下降,致使各时次中心城和卫星城热岛强度波动增强,且热岛强度增幅中心城高于卫星城;②中心城热岛强度冬季&gt;夏季,而卫星城夏季&gt;冬季,冬季均以8∶00最强,14∶00最弱,夏季卫星城各时次城市热岛强度次序与冬季相同,但夏季中心城却以20∶00最强,14∶00最弱;③绿地缓解热岛效应功能与绿地类型、树种组成、林分密度等群落结构及管理措施等相关,试验绿地夏季9∶00-16∶00的降温幅度约为0.2~12.9℃,各类绿地平均降温幅度介于1.2~9.5℃,平均降温约4.2℃,以乔草绿地最大,草地最低。因此,合理的群落结构与空间布局可增强区域绿地缓解热岛效应功能。

[ Zhang C S, Xie G D, Lu C X, et al.The mitigating effects of different urban green lands on the heat island effects in Beijing[J]. Resources Science, 2015,37(6):1156-1165. ]

[21]
Jr C L A, Gibbons C J. Impervious surface: The emergence of a key urban environmental indicator[J]. Journal of the American Planning Association, 1996,62(2):243-258.

DOI

[22]
Jiménez-Muñoz J C, Sobrino J A. A generalized single-channel method for retrieving land surface temperature from remote sensing data[J]. Journal of Geophysical Research Atmospheres, 2003,108(D22):2015-2023.Many papers have developed algorithms to retrieve land surface temperature from at-sensor and land surface emissivity data. These algorithms have been specified for different thermal sensors on board satellites, i.e., the algorithm used for one thermal sensor (or a combination of thermal sensors) cannot be used for other thermal sensor. The main goal of this paper is to propose a generalized single-channel algorithm that only uses the total atmospheric water vapour content and the channel effective wavelength (assuming that emissivity is known), and can be applied to thermal sensors characterized with a FWHM (Full-Width Half-Maximum) of around 1 μm actually operative on board satellites. The main advantage of this algorithm compared with the other single-channel methods is that in-situ radiosoundings or effective mean atmospheric temperature values are not needed, whereas the main advantage of this algorithm compared with split-window and dual-angle methods is that it can be applied to different thermal sensors using the same equation and coefficients. The validation for different test sites shows root mean square deviations lower than 2 K for AVHRR channel 4 (λ≈ 10.8 μm) and ATSR-2 channel 2 (λ≈ 11 μm), and lower than 1.5 K for Landsat Thematic Mapper (TM) band 6 (λ≈ 11.5 μm).

DOI

[23]
Van De Griend A A, Owe M. On the relationship between thermal emissivity and the normalized difference vegetation index for nature surfaces[J]. International Journal of Remote Sensing, 1993,14(6):1119-1131.The spatial variation of both the thermal emissivity (809000914/mu;m) and Normalized Difference Vegetation Index (NDVI) was measured for a series of natural surfaces within a savanna environment in Botswana. The measurements were performed with an emissivity-box and with a combined red and near-infrared radiometer, with spectral bands corresponding to NOAA/AVHRR. It was found that thermal emissivity was highly correlated with NDVI after logarithmic transformation, with a correlation coefficient of R = 000·94. This empirical relationship is of potential use for energy balance studies using thermal infrared remote sensing. The relationship was used in combination with AVHRR (GAC), AVHRR (LAC), and Landsat (TM) data to demonstrate and compare the spatial variability of various spatial scales.

DOI

[24]
Kaufman Y J, Gao B C.Remote sensing of water vapour in the near IR from EOS/MODIS[J]. IEEE Transactions on Geoscience & Remote Sensing, 1992,30(5):871-884.The LOWTRAN-7 code was used to simulate remote sensing of water vapor over 20 different surface covers. The simulation was used to optimize the water vapor channel selection and to test the accuracy of the remote sensing method. The channel selection minimizes the uncertainty in the derived water vapor due to variations in the spectral dependence of the surface reflectance. The selection also minimizes the sensitivity of the selected channels to possible drift in the channel position. The use of additional MODIS channels reduces the errors due to the effect of haze, subpixel clouds and uncertainties in the temperature profile. Remote sensing of the variation of water vapor from day to day will be more accurate, because the surface reflectances vary slowly with time. The method was applied to Airborne Visible Infrared Imaging Spectrometer (AVIRIS) data.

DOI

[25]
陈松林,王天星.等间距法和均值-标准差法界定城市执热岛的对比研究[J].地球信息科学学报,2009,11(2):145-150.利用ASTER数据反演地表温度,采用等间距法和均值-标准差法,将研究区温度场分别划分为4级、5级、6级,并根据热岛区的界定进一步将4级、6级细分为4级(a)、4级(b)、6级(a)和6级(b)。在此基础上,对两种方法从城市热岛数量结构差异、热岛空间分布及细节表达等方面进行了系统对比分析。结果表明:两种方法所界定热岛的面积百分比随着分级数不同均出现跳跃现象,趋势基本一致。但就热岛强度而言,均值-标准差法对分级数的敏感性较等间距法小,在热岛的空间分布和温度变异的细节表现力等方面,均值-标准差法也优于等间距分级法。因此,综合来看,均值-标准差法是城市热岛界定的较适合方法。均值-标准差法以地表温度相对于平均温度的变异程度为依据进行热场划分,在多时相城市热岛演变、对比等研究中,一定程度上可以避开时相的差异。

DOI

[ Chen S L, Wang T X.Comparison analysis of equal interval method and mean-standard deviation method used to delimitate urban heat island[J]. Journal of Geo-information science, 2009,11(2):145-150. ]

[26]
Brabec E, Schulte S, Richards P L.Impervious surfaces and water quality: A review of current literature and its implications for watershed planning[J]. Journal of Planning Literature, 2002,16(4):499-514.Impervious surfaces have for many years been recognized as an indicator of the intensity of the urban environment and, with the advent of urban sprawl, they have become a key issue in habitat health. Although a considerable amount of research has been done to define impervious thresholds for water quality degradation, there are a number of flaws in the assumptions and methodologies used. Given refinement of the methodology, accurate and usable parameters for preventative watershed planning can be developed, which include impervious surface thresholds and a balance between pervious and impervious surfaces within a watershed.

DOI

[27]
朱会义,李秀彬.关于区域土地利用变化指数模型方法的讨论[J].地理学报,2003,58(5):643-650.Recently, many sorts of index models have been widely adopted in the analysis of land use change in China. And they do play an important role in summarizing the rule of regional land use changes. However, according to the present research papers, there are some confusions and misuses in their applications, which root in faultiness, abnormity and misunderstanding of the indices or index calculation. By detailed exploration of the indices embedded in research materials, three classifications are identified on the basis of their application purposes: the change of regional land resources (change rate index and level change index), the direction of land use change (transition matrix and flow direction rate) and the spatial pattern of land use change (dynamic degree, relative change rate, adjacency degree, barycenter, frequency degree and importance degree). Then all the indices listed above are discussed under the purposed framework, including their concepts, calculation methods, application fields, misuses, and some application suggestions. This paper also gives a remark in the end that the research of land use change needs new breakthroughs in both theory and methodology. Index method is only a simple kind with limited functions, and much more efforts should be devoted to integrative, predictive methods in the coming days.

DOI

[ Zhu H Y, Li X B.Discussion on the index method of regional land use changes[J]. Acta Geographica Sinica, 2003,58(5):643-650. ]

[28]
陈爱莲,孙然好,陈利顶.传统景观格局指数在城市热岛效应评价中的适用性[J].应用生态学报,2012,23(8):2077-2086.以北京部分城区为研究对象,以QuickBird影像制作景观类型图,基于同年4个季节的Landsat ETM+数据反演地表温度;将120 m&times;120 m作为固定窗口,计算其中的景观格局指数,探寻传统景观格局指数解释地表温度的适用性.结果表明:在景观水平计算的24个景观格局指数中,只有景观组成百分比(PLAND)、斑块密度(PD)、最大斑块指数(LPI)、欧氏距离变异系数(ENN_CV)和分离度(DIVISION)与3月、5月、11月的地表温度具有稳定的显著相关.在类型水平计算的24个景观格局指数中,PLAND、LPI、DIVISION、相似邻接百分比、分散与并列指数与4个时相(3月、5月、7月和12月)的温度显著相关,且与7月温度的相关性最强;斑块密度、边界密度、聚簇度、凝聚度、有效MESH大小、分裂度、聚合度、归一化景观形状指数依据不同景观类型而与地表温度呈现相关性.传统景观格局指数可能并不适合评估河流对地表温度的影响.一些景观格局指数可以用来表征城市地表温度,辅助分析城市地表热岛效应,但需要对其进行筛选和甄别.

[ Chen A L, Sun R H, Chen L D.Applicability of traditional landscape metrics in evaluating urban heat island effects. Chinese Journal of Applied Ecology[J]. Chinese Journal of Applied Ecology, 2012,23(8):2077-2086. ]

Outlines

/