
Journal of Geo-information Science >
Study on Optimum Population of Beijing Based on the Comprehensive Carrying Capacity
Received date: 2017-06-05
Request revised date: 2017-08-23
Online published: 2017-11-10
Copyright
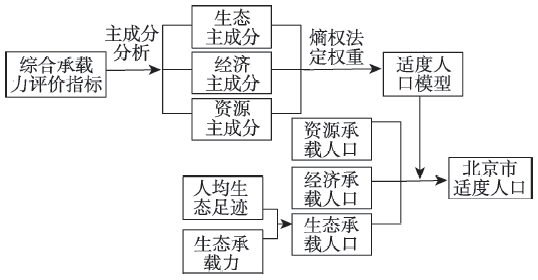
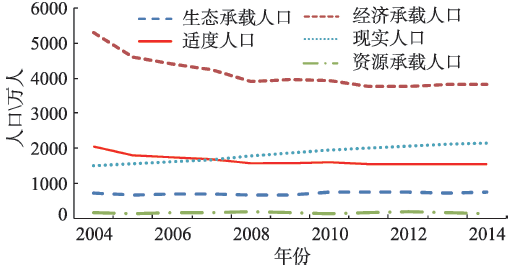
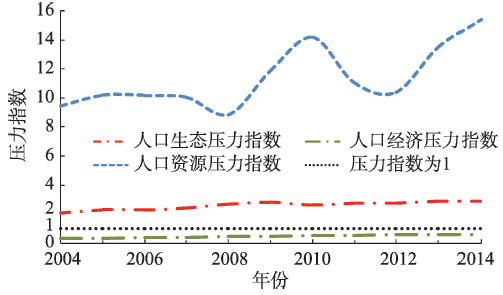
The study of optimum population size based on urban comprehensive carrying capacity has always been a hot issue in population geography. With the accelerating of China's urbanization, the population is gathering continuously in the city while environmental pollution, traffic jams and other "city diseases" have become increasingly prominent. City sustainable development is restricted by social economic factors and natural resources factors which is an important guarantee to maintain the population quantity in the range of carrying capacity. The concept of UCC (Urban Carrying Capacity) provides a powerful theoretical basis and quantitative means for government planning and calculating the optimum population size. As the political, economic and cultural center of China, the shortage of resources, traffic jam and deterioration of ecological environment are becoming more and more serious in Beijing. It's significant to determine the scale of optimum population for guiding the population floating and environment protection. However, the research results about optimum population scale of Beijing are few. Based on comprehensive carrying capacity, this paper constructed an appropriate population measurement model and synthetically analysed the scale of optimum population and carrying population of Beijing from 2004 to 2014. Results indicated that: (1) The scale of ecological carrying population which is in a state of population overload has an increasing trend; (2) Economic carrying population scale has been decreasing for 15 years. The output value of tertiary industry contributed most which reached 65.15% in 2014; (3)Resources carrying population scale is in a state of fluctuation while its overload rate increased year by year. The contribution of land resources carrying capacity is greater than that of water resources which reached 79.91% in 2014; (4) From 2004 to 2014, the optimum population size of Beijing decreased from 20.31 million to 15.51 million and start a demographic deficit in 2008. Considering its contribution factor, resource constraint has become the main factor hindering the development of Beijing, and the economic carrying capacity is the main driving force to maintain the appropriate population size. The conclusions of this study can provide a reference for the formulation of rational population management decisions and urban sustainable development planning.
LIN Xiaojuan , FANG Shifeng , DU Jiaqiang , WU Hua , DOU Xinyi , YUE Yixiao . Study on Optimum Population of Beijing Based on the Comprehensive Carrying Capacity[J]. Journal of Geo-information Science, 2017 , 19(11) : 1495 -1503 . DOI: 10.3724/SP.J.1047.2017.01495
Tab.1 Evaluation indexes to comprehensive carrying capacity of Beijing表1 北京市综合承载力评价指标 |
| 类型 | 名称 | 内容 | 单位 | 类型 | 名称 | 内容 | 单位 |
|---|---|---|---|---|---|---|---|
| 资源承载系统 | X1 | 用水总量 | 亿m3 | 经济承载系统 | X14 | 第三产业占GRP比重 | % |
| X2 | 水资源总量 | 亿m3 | X15 | 全社会固定资产投资额 | 亿元 | ||
| X3 | 人均水资源量 | m3 | X16 | 城镇居民恩格尔系数 | % | ||
| X4 | 人均用水量 | m3 | X17 | 社会消费品零售总额 | 亿元 | ||
| X5 | 万元产值耗水量 | m3 | X18 | 城镇居民人均可支配收入 | 元 | ||
| X6 | 年末耕地总资源 | hm2 | X25 | 常住人口 | 万人 | ||
| X7 | 人均建设用地面积 | km2 | X26 | 城镇人口 | 万人 | ||
| X8 | 人均城市道路面积 | m2 | 生态承载系统 | X19 | 人均绿地面积 | m2 | |
| X9 | 人均耕地面积 | m2 | X20 | 森林覆盖率 | % | ||
| X10 | 建设用地面积 | km2 | X21 | 工业废水排放量 | 万t | ||
| 经济承载系统 | X11 | 人均GRP | 元/人 | X22 | 工业烟尘排放量 | t | |
| X12 | GRP | 亿元 | X23 | 工业SO2排放量 | t | ||
| X13 | 地区生产总值增长率 | % | X24 | 城市环境设施投资额 | 万元 |
Fig.1 Flow chart for optimum population of Beijing图1 技术路线图 |
Tab. 2 Rotated component matrix表2 主成分载荷 |
| 变量 | 主成份 | ||
|---|---|---|---|
| C1 | C2 | C3 | |
| 用水总量X1 | 0.517 | 0.791 | -0.133 |
| 水资源总量X2 | 0.312 | 0.048 | 0.927 |
| 人均水资源量X3 | -0.088 | -0.353 | 0.902 |
| 人均用水量X4 | -0.822 | -0.554 | -0.056 |
| 万元产值耗水量X5 | -0.858 | -0.500 | -0.036 |
| 年末耕地总资源X6 | -0.671 | -0.717 | 0.010 |
| 人均建设用地面积X7 | -0.848 | -0.296 | -0.153 |
| 人均城市道路面积X8 | -0.731 | -0.055 | -0.039 |
| 人均耕地面积X9 | -0.785 | -0.614 | -0.022 |
| 建设用地面积X10 | 0.594 | 0.770 | -0.082 |
| 人均GRP X11 | 0.691 | 0.713 | -0.001 |
| GRP X12 | 0.648 | 0.756 | -0.006 |
| 地区GDP增长率X13 | -0.551 | -0.629 | -0.234 |
| 三产占GRP比重X14 | 0.882 | 0.334 | -0.058 |
| 固定资产投资额X15 | 0.661 | 0.743 | -0.067 |
| 恩格尔系数X16 | 0.180 | -0.696 | 0.254 |
| 消费品零售总额X17 | 0.625 | 0.778 | -0.003 |
| 人均可支配收入X18 | 0.629 | 0.767 | -0.030 |
| 人均绿地面积X19 | 0.413 | 0.616 | -0.503 |
| 森林覆盖率X20 | 0.589 | 0.726 | -0.188 |
| 工业废水排放量X21 | -0.980 | 0.047 | -0.013 |
| 工业烟尘排放量X22 | -0.034 | 0.656 | 0.499 |
| 工业SO2排放量X23 | -0.900 | -0.392 | 0.019 |
| 环境设施投资额X24 | 0.277 | 0.835 | -0.245 |
| 常住人口X25 | 0.736 | 0.673 | 0.019 |
| 城镇人口X26 | 0.761 | 0.645 | 0.014 |
Tab. 3 Ecological carrying population scale of Beijing from 2004 to 2014表3 北京市2004-2014年生态承载人口 |
| 年份 | 生态承载力/万hm2 | 人均生态足迹/hm2 | 生态承载 人口/万人 | 富余或超载状态 | 富余或超载率 |
|---|---|---|---|---|---|
| 2004 | 284.46 | 0.40 | 717.38 | 超载 | -0.52 |
| 2005 | 285.89 | 0.43 | 669.68 | 超载 | -0.56 |
| 2006 | 291.90 | 0.42 | 699.53 | 超载 | -0.56 |
| 2007 | 306.84 | 0.44 | 692.58 | 超载 | -0.59 |
| 2008 | 301.00 | 0.46 | 657.01 | 超载 | -0.63 |
| 2009 | 309.82 | 0.47 | 662.45 | 超载 | -0.64 |
| 2010 | 314.49 | 0.42 | 754.70 | 超载 | -0.62 |
| 2011 | 318.64 | 0.43 | 742.33 | 超载 | -0.63 |
| 2012 | 329.94 | 0.44 | 753.55 | 超载 | -0.64 |
| 2013 | 319.18 | 0.44 | 731.60 | 超载 | -0.65 |
| 2014 | 304.20 | 0.40 | 753.14 | 超载 | -0.65 |
Tab. 4 Economic carrying population scale of Beijing from 2004 to 2014表4 北京市2004-2014年经济承载人口 |
| 年份 | GRP承载人口/万人 | 第二产业承载人口/万人 | 第三产业承载人口/万人 | 经济承载人口/万人 | 富余或超载 状态 | 富余或超载率 |
|---|---|---|---|---|---|---|
| 2004 | 7378.36 | 3262.53 | 8045.27 | 5297.18 | 富余 | 2.55 |
| 2005 | 4937.29 | 3027.31 | 8267.04 | 4588.35 | 富余 | 1.98 |
| 2006 | 4914.05 | 2775.02 | 8440.02 | 4396.64 | 富余 | 1.75 |
| 2007 | 4843.25 | 2633.07 | 8327.31 | 4247.22 | 富余 | 1.53 |
| 2008 | 4631.08 | 2325.10 | 8218.55 | 3907.79 | 富余 | 1.21 |
| 2009 | 4700.29 | 2370.73 | 8019.59 | 3951.23 | 富余 | 1.12 |
| 2010 | 4648.32 | 2361.94 | 7912.36 | 3922.10 | 富余 | 1.00 |
| 2011 | 4565.91 | 2218.34 | 7810.78 | 3760.20 | 富余 | 0.86 |
| 2012 | 4543.20 | 2233.77 | 7671.22 | 3758.74 | 富余 | 0.82 |
| 2013 | 4619.94 | 2274.45 | 7570.18 | 3806.06 | 富余 | 0.80 |
| 2014 | 4601.69 | 2287.45 | 7431.34 | 3802.06 | 富余 | 0.77 |
Tab. 5 Resources carrying population scale of Beijing from 2004 to 2014表5 北京市2004-2014年资源承载人口 |
| 年份 | 土地资源承载人口/万人 | 水资源承载人口/万人 | 资源承载 人口/万人 | 富余或超载状态 | 富余或超载率 |
|---|---|---|---|---|---|
| 2004 | 251.00 | 115.28 | 158.00 | 超载 | -0.89 |
| 2005 | 249.98 | 108.14 | 150.97 | 超载 | -0.90 |
| 2006 | 251.00 | 114.69 | 157.44 | 超载 | -0.90 |
| 2007 | 252.02 | 124.52 | 166.68 | 超载 | -0.90 |
| 2008 | 252.79 | 165.55 | 200.08 | 超载 | -0.89 |
| 2009 | 223.92 | 120.53 | 156.71 | 超载 | -0.92 |
| 2010 | 221.83 | 100.22 | 138.07 | 超载 | -0.93 |
| 2011 | 221.13 | 155.32 | 182.47 | 超载 | -0.91 |
| 2012 | 221.26 | 181.14 | 199.20 | 超载 | -0.90 |
| 2013 | 222.64 | 120.75 | 156.58 | 超载 | -0.93 |
| 2014 | 223.13 | 101.58 | 139.61 | 超载 | -0.94 |
Fig. 2 The changing tendency of optimum population and carrying population scale of Beijing from 2004 to 2014图2 北京2004-2014适度人口与各子系统承载人口变化趋势 |
Fig. 3 The changing tendency of population pressure indexof Beijing from 2004 to 2014图3 北京2004-2014年各子系统人口承载压力指数变化趋势 |
Tab. 6 Optimum population scale of Beijing from 2004 to 2014表6 北京市2004-2014年适度人口 |
| 年份 | 适度人口/万人 | 富余或超载人数/万人 | 富余或超载状态 | 富余或超载率 |
|---|---|---|---|---|
| 2004 | 2031.15 | 538.45 | 富余 | 0.36 |
| 2005 | 1780.98 | 242.98 | 富余 | 0.16 |
| 2006 | 1731.15 | 130.15 | 富余 | 0.08 |
| 2007 | 1682.94 | 6.94 | 富余 | 0.00 |
| 2008 | 1570.39 | -200.61 | 超载 | -0.11 |
| 2009 | 1572.61 | -287.39 | 超载 | -0.15 |
| 2010 | 1589.85 | -372.05 | 超载 | -0.19 |
| 2011 | 1546.90 | -471.70 | 超载 | -0.23 |
| 2012 | 1555.74 | -513.56 | 超载 | -0.25 |
| 2013 | 1549.77 | -565.03 | 超载 | -0.27 |
| 2014 | 1550.67 | -600.93 | 超载 | -0.28 |
The authors have declared that no competing interests exist.
| [1] |
[
|
| [2] |
|
| [3] |
|
| [4] |
|
| [5] |
|
| [6] |
|
| [7] |
[
|
| [8] |
[
|
| [9] |
[
|
| [10] |
|
| [11] |
[
|
| [12] |
|
| [13] |
|
| [14] |
|
| [15] |
|
| [16] |
|
| [17] |
[
|
| [18] |
[
|
| [19] |
|
| [20] |
[
|
| [21] |
[
|
| [22] |
[
|
| [23] |
[
|
| [24] |
[
|
| [25] |
[
|
| [26] |
[
|
| [27] |
[
|
| [28] |
[
|
| [29] |
[
|
| [30] |
[
|
| [31] |
[
|
| [32] |
[
|
| [33] |
[
|
| [34] |
[
|
| [35] |
[
|
| [36] |
[
|
| [37] |
|
| [38] |
[
|
| [39] |
[
|
| [40] |
[
|
| [41] |
[
|
/
| 〈 |
|
〉 |