
Journal of Geo-information Science >
Hazard Assessment of Debris Flow in Sichuan Province
Received date: 2017-06-30
Request revised date: 2017-09-26
Online published: 2017-12-25
Copyright
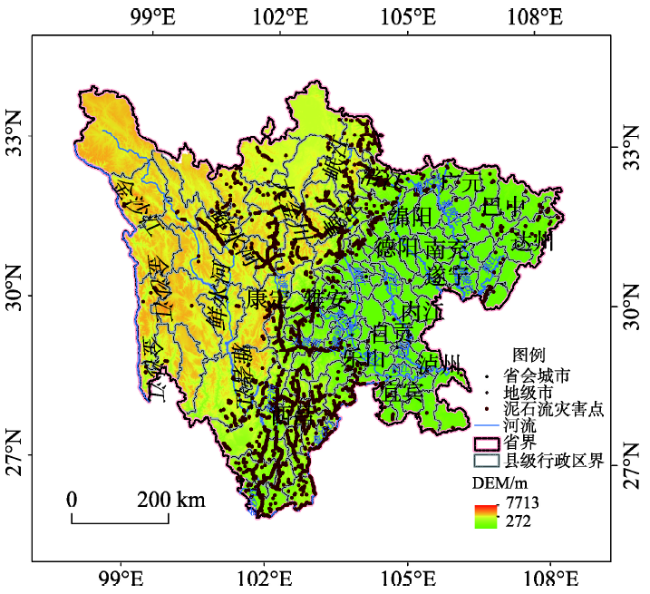
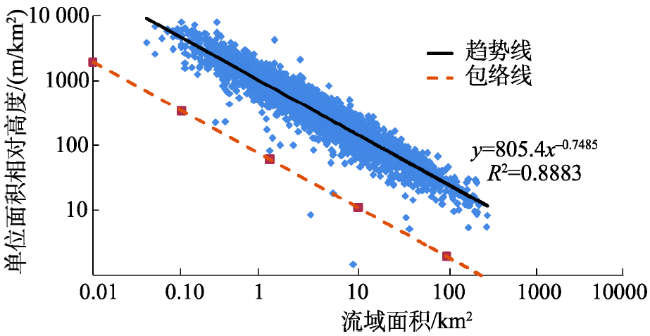
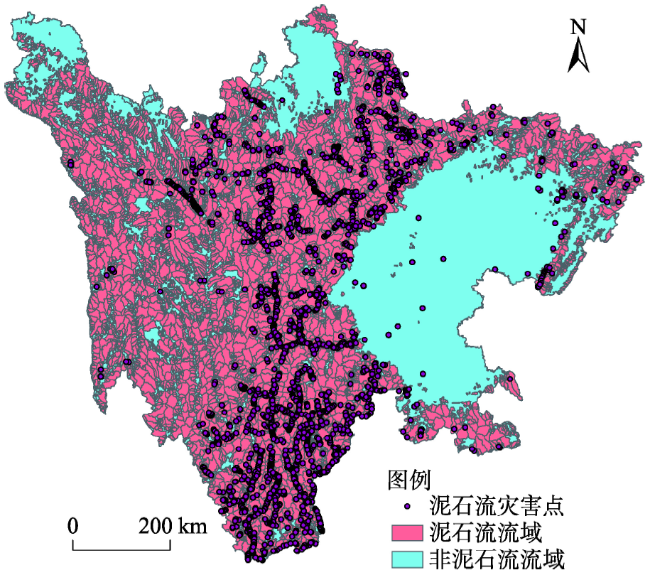
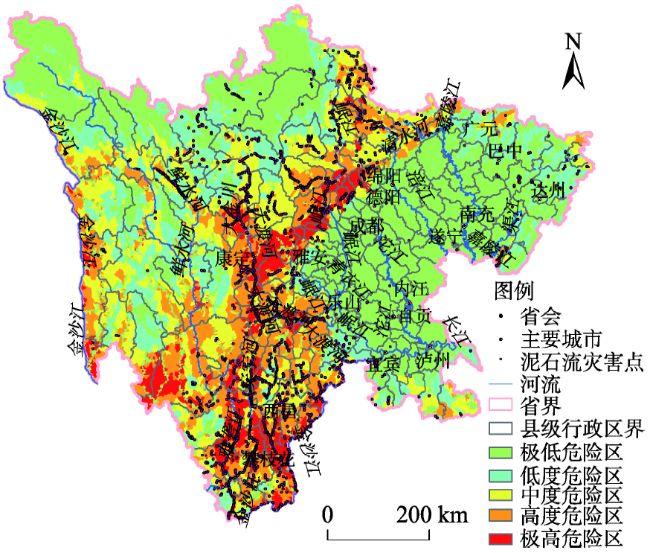
Hazard assessment is important for the prevention and mitigation of debris flow disaster. This study takes Sichuan Province as the research area. Based on the DEM data, we realize the demarcation of the small watershed in Sichuan Province by extracting the direction of water flow and calculating the accumulation of the flow confluence. Based on the collected information of debris flow watershed, we selected the watershed elevation difference and watershed area as the indicators. The identification model of potential debris flow watershed based on the energy condition was built by analyzing the hazard-formative environment and characteristics of debris flow hazards. A total of 7798 small watersheds with the required energy conditions for debris flow occurring were identified by utilizing the established model among all the demarcated small watersheds, which is 31.1×10⁴ km2 accounting for 64.18% of the total area of Sichuan Province. The indicator system of debris flow hazard risk assessment and the extension matter-element model were established from the energy condition of the debris flow occurring, the condition of the loose solid materials, the precipitation condition and the condition of human activity. These determine the weights of the assessment factors, of dividing the grade of the hazard risk, by which it classifies the hazard risk degree of small watershed debris flow. The number of the moderate, high and very high hazard degree is 1946, 1725 and 1002, with an area of 9.1×10⁴ km2, 7.7×10⁴ km2 and 3.4×10⁴ km2, respectively. The total area of moderate hazard areas is 20.2×10⁴ km², accounting for 41.67% of the total area of Sichuan Province. Finally, the analyses were made for the reliability of assessment results and the distribution of the different hazard degree of debris flow areas in different municipal administrative districts and the major river valleys. All the known small watershed of very high hazard degree are identified as debris flow watersheds. The 896 watersheds of moderate hazard degree do not belong to the identified debris flow and 1233 watersheds of high hazard degree do not belong to the identified debris flow, either. They are the key area for disaster prevention and reduction in Sichuan province in the next few years. The results of the analyses have the great theoretical and practical significance for enhancing the debris flow identification, the prevention and mitigation of regional debris flow disaster. The sustainable development of mountainous areas and also the theory of the risk assessment of debris flow hazard.
XIONG Junnan , WEI Fangqiang , LIU Zhiqi . Hazard Assessment of Debris Flow in Sichuan Province[J]. Journal of Geo-information Science, 2017 , 19(12) : 1604 -1612 . DOI: 10.3724/SP.J.1047.2017.01604
Fig. 1 Hillshade and gullies of debris flows in the study area图1 研究区地势特征及泥石流沟分布 |
Fig. 2 Relationship between watershed area and relative height of unit area图2 泥石流流域面积与单位面积相对高度关系图 |
Fig. 3 The identification results of potential debris flow图3 潜势泥石流流域判识结果 |
Tab. 1 Correlation matrix between evaluation factors表1 评价因子间的相关系数 |
| 高差 | 沟床比降 | 断层密度 | 地震烈度 | 地层岩性 | 土地利用 | 平均降水 | 降水变差 | |
|---|---|---|---|---|---|---|---|---|
| 高差 | 1.000 | 0.404 | 0.171 | 0.233 | -0.169 | -0.458 | 0.107 | 0.161 |
| 沟床比降 | 0.404 | 1.000 | 0.111 | 0.122 | -0.119 | -0.364 | 0.012 | 0.091 |
| 断层密度 | 0.171 | 0.111 | 1.000 | 0.157 | -0.119 | -0.140 | -0.052 | 0.000 |
| 地震烈度 | 0.233 | 0.122 | 0.157 | 1.000 | -0.119 | -0.200 | -0.173 | -0.105 |
| 地层岩性 | -0.169 | -0.112 | -0.119 | -0.119 | 1.000 | 0.273 | 0.396 | 0.195 |
| 土地利用 | -0.458 | -0.364 | -0.140 | -0.200 | 0.273 | 1.000 | 0.133 | -0.002 |
| 平均降水 | 0.107 | 0.012 | -0.052 | -0.173 | 0.396 | 0.133 | 1.000 | 0.395 |
| 降水变差 | 0.161 | 0.091 | 0.000 | -0.105 | 0.195 | -0.002 | 0.395 | 1.000 |
Tab. 2 Standard matter-element model for debris flow hazard assessment表2 泥石流危险性评价的标准物元模型 |
| 概率 | 流域单元特征 | 标准物元 |
|---|---|---|
| 0-0.2 | 1. 断层密度/(m/km2):F=0 | |
| 2. 地层岩性:R=1 | ||
| 3. 地震烈度/°:0<E≤3 | ||
| 4. 年平均降水量/mm: Pmean<500, Pmean>1100 | ||
| 5. 降水量年际变差:Cv<0.1 | ||
| 6. 高差/m: H>3100, H≤100 | ||
| 7. 沟床比降/:S>650,S<50 | ||
| 8. 土地利用:0.05<L≤0.1 | ||
| 0.2-0.4 | 1. 断层密度/(m/km2):0<F≤0.15 | |
| 2. 地层岩性:R=2 | ||
| 3. 地震烈度/°:3<E≤6 | ||
| 4. 年平均降水量/mm: 500<Pmean≤600 1000<Pmean≤1100 | ||
| 5. 降水量年际变差:0.14<Cv≤0.16 | ||
| 6. 高差/m: 100<H≤300, 2500<H≤3100 | ||
| 7. 沟床比降/:500<S≤650 | ||
| 8. 土地利用:0.1<L≤0.15 | ||
| 0.4-0.6 | 1. 断层密度/(m/km2):0.15<F≤0.3 | |
| 2. 地层岩性:R=3 | ||
| 3. 地震烈度/°:6<E≤7 | ||
| 4. 年平均降水量/mm: 600<Pmean≤700, 900<Pmean≤1000 | ||
| 5. 降水量年际变差:0.1<Cv≤0.12 | ||
| 6. 高差/m: 300<H≤400, 1700<H≤2500 | ||
| 7. 沟床比降/:350<S≤500, | ||
| 8. 土地利用:0<L≤0.05 | ||
| 0.6-0.8 | 1. 断层密度/(m/km2): 0.3<F≤0.5 | |
| 2. 地层岩性:R=4 | ||
| 3. 地震烈度/°:7<E≤9 | ||
| 4. 年平均降水量/mm: 700<Pmean≤800 | ||
| 5. 降水量年际变差:Cv>0.16 | ||
| 6. 高差/m: 400<H≤600, 1400<H≤1700 | ||
| 7. 沟床比降/:150<S≤350 | ||
| 8. 土地利用:L>0.2 | ||
| 0.8-1 | 1. 断层密度/(m/km2):F>0.5 | |
| 2. 地层岩性:R=5 | ||
| 3. 地震烈度/°:9<E≤11 | ||
| 4. 年平均降水量/mm: 800<Pmean≤900 | ||
| 5. 降水量年际变差:0.12<Cv≤0.14 | ||
| 6. 高差/m:600<H≤1400 | ||
| 7. 沟床比降/:50<S≤150 | ||
| 8. 土地利用:0.15<L≤0.2 |
Tab. 3 Weighting coefficients of assessment factors of regional debris flow hazard表3 区域泥石流危险性评价因子权重表 |
| 类别 | 地面要素类 | 气象要素类 | |||||||
|---|---|---|---|---|---|---|---|---|---|
| 断层密度 | 地层岩性 | 地震烈度 | 高差 | 沟床比降 | 土地利用 | 年平均降水量 | 降水量年际变差 | ||
| 各类权重 | 0.17 | 0.1 | 0.08 | 0.22 | 0.2 | 0.04 | 0.14 | 0.05 | |
Tab. 4 Hazard degree classification of regional debris flow表4 区域泥石流危险度等级划分[5] |
| 区域泥石流危险度 | 危险度分区 | 泥石流活动特征 |
|---|---|---|
| 0.0-0.2 | 极低危险区 | 基本无泥石流活动,没有泥石流灾难,安全区 |
| 0.2-0.4 | 低度危险区 | 能够发生小规模和低频率的泥石流,一般不会造成重大灾难和严重危害 |
| 0.4-0.6 | 中度危险区 | 能够间歇性发生中等规模的泥石流,较少造成重大灾难和严重危害 |
| 0.6-0.8 | 高度危险区 | 能够发生大规模和高频率的泥石流,可造成重大灾难和严重危害 |
| 0.8-1.0 | 极高危险区 | 能够发生巨大规模和特高频率的泥石流,可造成重大灾难和严重危害 |
Fig. 4 Hazard assessment results of debris flow图4 四川省泥石流危险性评价结果图 |
Tab. 5 The area of each hazard degree in all prefectures and cities表5 各市级行政区内不同等级危险区面积统计表(km²) |
| 市级行政区 | 极低 危险区 | 低度 危险区 | 中度 危险区 | 高度 危险区 | 极高 危险区 |
|---|---|---|---|---|---|
| 成都市 | 8285 | 711 | 829 | 503 | 1777 |
| 自贡市 | 4376 | 0 | 0 | 0 | 0 |
| 攀枝花市 | 872 | 1260 | 1890 | 2157 | 1231 |
| 泸州市 | 6391 | 2949 | 1950 | 924 | 0 |
| 德阳市 | 4364 | 71 | 326 | 65 | 1093 |
| 绵阳市 | 10 355 | 346 | 4684 | 4237 | 567 |
| 广元市 | 8000 | 3436 | 2571 | 2182 | 14 |
| 遂宁市 | 5322 | 0 | 0 | 0 | 0 |
| 内江市 | 5003 | 5 | 0 | 0 | 0 |
| 乐山市 | 5435 | 1936 | 1378 | 3848 | 539 |
| 南充市 | 12516 | 50 | 0 | 0 | 0 |
| 眉山市 | 577 | 300 | 418 | 688 | 15 |
| 宜宾市 | 8095 | 3375 | 1733 | 49 | 0 |
| 广安市 | 4780 | 892 | 331 | 350 | 0 |
| 达州市 | 8587 | 6060 | 1548 | 375 | 4 |
| 雅安市 | 2337 | 852 | 2602 | 4335 | 4898 |
| 巴中市 | 6817 | 4373 | 461 | 635 | 0 |
| 资阳市 | 7922 | 15 | 4.56 | 0 | 0 |
| 阿坝藏族羌族自治州 | 32 373 | 18 952 | 20 387 | 8530 | 2493 |
| 甘孜藏族自治州 | 48 051 | 30 493 | 37 376 | 25 326 | 7188 |
| 凉山彝族自治州 | 7415 | 3397 | 12 677 | 22 338 | 14 356 |
The authors have declared that no competing interests exist.
| [1] |
[
|
| [2] |
|
| [3] |
|
| [4] |
|
| [5] |
[
|
| [6] |
[
|
| [7] |
[
|
| [8] |
[
|
| [9] |
[
|
| [10] |
[
|
| [11] |
[
|
| [12] |
[
|
| [13] |
[
|
| [14] |
[
|
| [15] |
[
|
| [16] |
[
|
| [17] |
[
|
| [18] |
[
|
| [19] |
[
|
/
| 〈 |
|
〉 |