
Journal of Geo-information Science >
Analysis of Temperature Conditions for Rain and Snow Separation in Tizinafu River Basin of Kunlun Mountains
Received date: 2017-06-27
Request revised date: 2017-08-31
Online published: 2017-12-25
Copyright
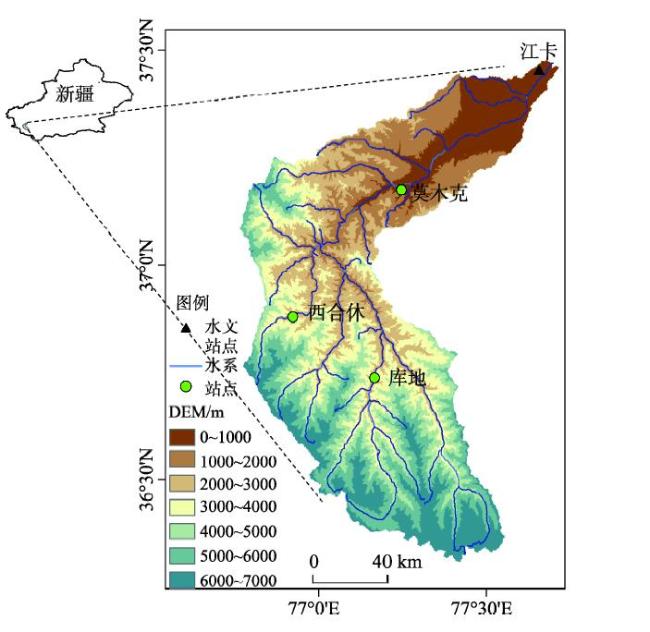
Under the context of global climate change, the heavy flood caused by the snow melting (glacier melting) as well as heavy rainfall in the high altitude mountainous areas in Xinjiang Uygur Autonomous Region was becoming more unpredictable. Therefore, clarifying the relationship between the temperature and the rainfall types is the prerequisite step to predict the flood effectively in these mountainous regions. Fortunately, the approach of rainfall and snowfall separation in mountainous regions is capable of determining the temperature conditions which may cause the heavy flood. It is also able to provide important and scientific references to the accurately prediction for the heavy flood in the mountainous regions. In this study, temperature and precipitation data were collected from ground-based meteorological stations located in different altitude in a case study area: the Tizinafu River Basin in Kunlun Mountains. This study was conducted on a daily basis during 2012 to 2016. The MODIS10A2 snow cover data with 8-day temporal resolution were also applied as the valid reference data. For the purpose of rainfall and snow separation, we adopted the temperature integral and probability statistics methods to analyze the temperature conditions for different rainfall types in the research region. The remote sensing snow cover data combined with the average temperature over the latest past few years are used to determine the different temperature conditions with different precipitation patterns. The results were summarized as follows. If the maximum temperature and accumulated temperature reaches 20.91 ˚C and 51.82 ˚C, respectively, the precipitation can be predicted as rainfall in the Momuke station. In contrast, if maximum and accumulated temperature are below 18.13 ˚C and 43.69 ˚C, respectively, the precipitation can be predicted as snowfall. Similarly, for Kudi station, if the maximum and accumulated temperature reaches 14.51 ˚C and 33.17 ˚C, respectively, the precipitation can be judged as rainfall. While the precipitation will be recognized as snowfall when the maximum and accumulated temperature are below 13.57 ˚C and 31.68 ˚C, respectively. In the same way, when the maximum temperature and accumulated temperature in the Xihexiu meteorological station are above 9.43 ˚C and 19.53 ˚C, respectively, the precipitation will be recognized as rainfall and the precipitation will be recognized as snowfall once maximum temperature and accumulated temperature are below 8.22 ˚C and 19.4 ˚C, respectively. For validating and evaluating the credibility of this rainfall and snowfall separation method as well as the reasonability of the reference temperature conditions, the meteorological data from the nearby villages of the study catchment were used to assess rainfall and snow separation results. From the results, we can conclude that in different elevation bands, the rainfall and snow separation results are always acceptable with different levels. The precisions are 92.86%, 79.49% and 88.3% in the elevation bands below 2000 m, 2000-3000 m, and 3000 m above sea level, respectively. The results is capable of providing a scientific evidence for monitoring flood types and flood forecasting, which is of great significance and is related to create new water resource management guidelines and planning schemes for local people and decision makers.
DUAN Yongchao , MENG Fanhao , LIU Tie , LUO Min , ZHANG Junfeng , BAO Anming . Analysis of Temperature Conditions for Rain and Snow Separation in Tizinafu River Basin of Kunlun Mountains[J]. Journal of Geo-information Science, 2017 , 19(12) : 1661 -1669 . DOI: 10.3724/SP.J.1047.2017.01661
Fig. 1 The topographic features of the study area图1 研究区地势特征图 |
Tab. 1 Meteorological station information表1 气象站点信息表 |
| 气象站点 | 经度/E | 纬度/N | 海拔/m | 资料数据 | 时段 |
|---|---|---|---|---|---|
| 莫木克 | 76°58′10" | 37°23′12" | 1863 | 气象、降水 | 2012-2016 |
| 库地 | 76°58′48" | 36°50′27" | 2962 | 气象、降水 | 2012-2016 |
| 西合休 | 76°39′58" | 36°57′31" | 3067 | 气象、降水 | 2012-2016 |
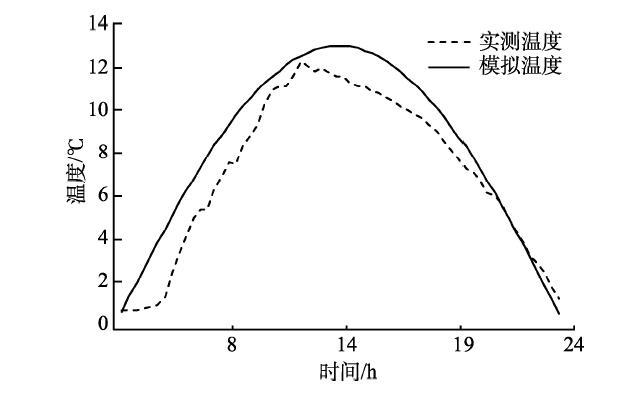
Fig. 2 Comparison of measured and simulated data图2 实测数据与模拟数据对比图 |
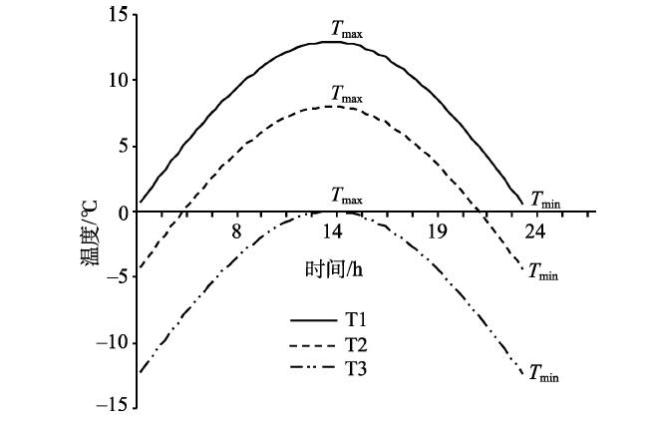
Fig. 3 Three different temperature curves图3 3种不同温度曲线 |
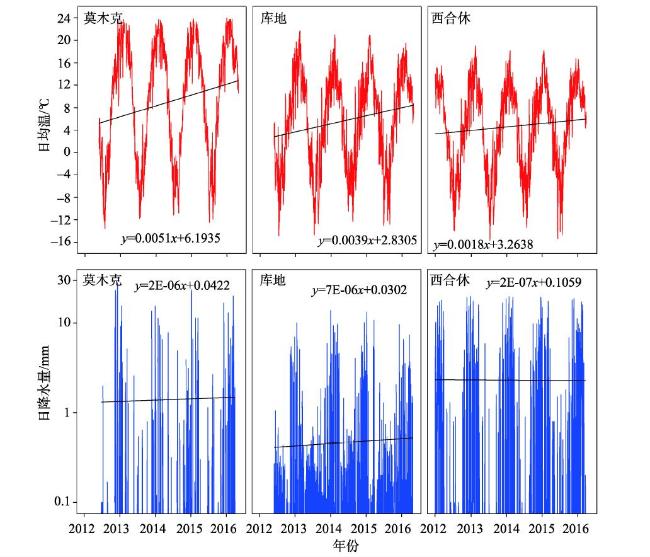
Fig. 4 The daily temperature and precipitation change curve of each meteorological station from 2012 to 2016图4 2012-2016年各气象站日平均温度与降水变化曲线 |
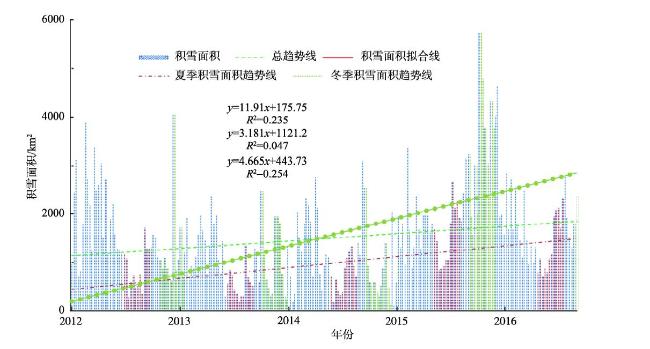
Fig. 5 The change of snow area of Tihe Basin from 2012 to 2016图5 提河流域2012-2016年积雪面积变化图 |
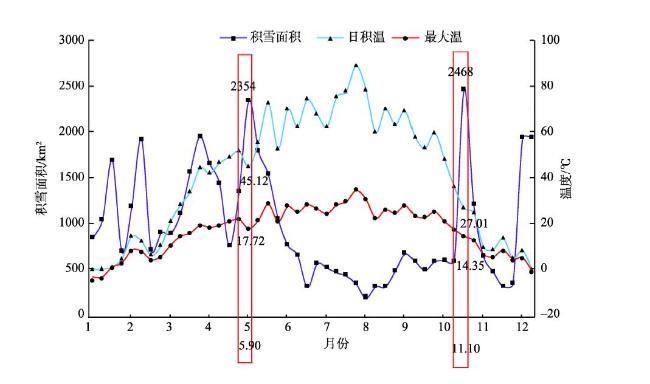
Fig. 6 Relationship between snow area and temperature variation in 2013图6 2013年提河流域积雪面积与温度变化关系图 |
Tab. 2 Statistics of site accumulated temperature and maximum temperature表2 站点日积温和日最大温统计表(℃) |
| 年份 | 莫木克站 | 库地站 | 西合休站 | ||||||||||||||
|---|---|---|---|---|---|---|---|---|---|---|---|---|---|---|---|---|---|
| 降雨温度 | 降雪温度 | 降雨温度 | 降雪温度 | 降雨温度 | 降雪温度 | ||||||||||||
| 积温 | 最大温度 | 积温 | 最大温度 | 积温 | 最大温度 | 积温 | 最大温度 | 积温 | 最大温度 | 积温 | 最大温度 | ||||||
| 2013 | 41.68 | 16.22 | 30.03 | 14.97 | 28.80 | 13.03 | 18.08 | 9.37 | 26.05 | 11.73 | 1.70 | 1.41 | |||||
| 2014 | 40.86 | 16.37 | 39.21 | 18.87 | 35.96 | 15.04 | 28.59 | 14.03 | 11.21 | 5.65 | 11.25 | 5.79 | |||||
| 2015 | 68.27 | 28.68 | 51.97 | 19.56 | 18.09 | 9.06 | 36.76 | 14.22 | 14.40 | 7.27 | 29.18 | 11.29 | |||||
| 2016 | 56.47 | 22.35 | 53.56 | 19.13 | 49.83 | 20.92 | 43.28 | 16.64 | 26.45 | 13.08 | 35.46 | 14.37 | |||||
| 平均值 | 51.82 | 20.91 | 43.69 | 18.13 | 33.17 | 14.51 | 31.68 | 13.57 | 19.53 | 9.43 | 19.40 | 8.22 | |||||
Tab. 3 Statistics of the site accuracy verification表3 站点精度验证统计表 |
| 站点 | 事件总数 | 正确数量 | 准确率/% |
|---|---|---|---|
| 莫木克 | 14 | 13 | 92.86 |
| 库地 | 39 | 31 | 79.49 |
| 西合休 | 94 | 83 | 88.30 |
The authors have declared that no competing interests exist.
| [1] |
[
|
| [2] |
[
|
| [3] |
[
|
| [4] |
[
|
| [5] |
[
|
| [6] |
[
|
| [7] |
[
|
| [8] |
[
|
| [9] |
[
|
| [10] |
|
| [11] |
|
| [12] |
|
| [13] |
|
| [14] |
[
|
| [15] |
[
|
| [16] |
[
|
| [17] |
[
|
| [18] |
[
|
| [19] |
[
|
| [20] |
[
|
| [21] |
[
|
| [22] |
[
|
| [23] |
[
|
| [24] |
[
|
| [25] |
[
|
| [26] |
[
|
| [27] |
[
|
| [28] |
[
|
/
| 〈 |
|
〉 |