
Journal of Geo-information Science >
A Case of Establishment and Application of Spatial Correlation Degree Algorithm for Geographic Entities Coupling Scales
Received date: 2017-07-11
Request revised date: 2017-08-06
Online published: 2018-01-20
Supported by
Branch Center Project of Geography, Resources and Ecology of Knowledge Center for Chinese Engineering Sciences and Technology, No.CKCEST-2017-1-8;National Earth System Science Data Sharing Infrastructure, No.2005DKA32300;Project of Jiangsu Center for Collaborative Innovation in Geographical Information Resource Development and Application.
Copyright
The traditional correlation degree algorithms for geographic entities have many disadvantages, such as non-applicable for some kinds of geographic entities and some types of topological relations, and not considering the dependency of spatial scale that results in poor discernibility of data. In this study, a new algorithm is proposed which computes the spatial correlation degree according to the specified spatial scale which is represented by a spatial extent. Based on the first law of geography and the theories on spatial correlation degree put forward by Egenhofer, the equations of spatial correlation degree was obtained by analyzing the topological and metric relations between different kinds of geographical entities such as points, lines and polygons. By comparison, the algorithm in this study can compute the correlation degree between geographic entities of different types and topological relations, alter the correlation degree with the change of the specified spatial scale, which is consistent with the generic intuition of human beings. At last, we introduced an application of the algorithm by taking geospatial data retrieval as an example. Compared with the traditional retrieval methods based on keyword matching, our algorithms can improve the F1-measure in geographic information retrieval (GIR) and give the accurate scores of correlation degree so that the retrieval results can be ranked. The algorithm is an elementary research that can be applied in the research fields of GIR, scientific data discovery, data recommendation, linked data, and so on.
CHEN Zugang , YANG Yaping . A Case of Establishment and Application of Spatial Correlation Degree Algorithm for Geographic Entities Coupling Scales[J]. Journal of Geo-information Science, 2018 , 20(1) : 37 -47 . DOI: 10.12082/dqxxkx.2018.170323
Tab. 1 The topology relations between spatial entities表1 实体空间拓扑关系表 |
 |
Tab. 2 The weights of the algorithm in the case表2 本研究权重系数取值表 |
| 基本权重 | 值 | 控制权重 | 值 |
|---|---|---|---|
| WT1 | 0.667 | WT1C | 0.333 |
| WT2 | 0.5 | WT2C | 0.167 |
| WT3 | 0.333 | WT3C | 0.167 |
| WT4 | 0 | WT4C | 0.333 |
| WT5 | 0.167 | WT5C | 0.166 |
| WT6 | 0 | WT6C | 0.167 |
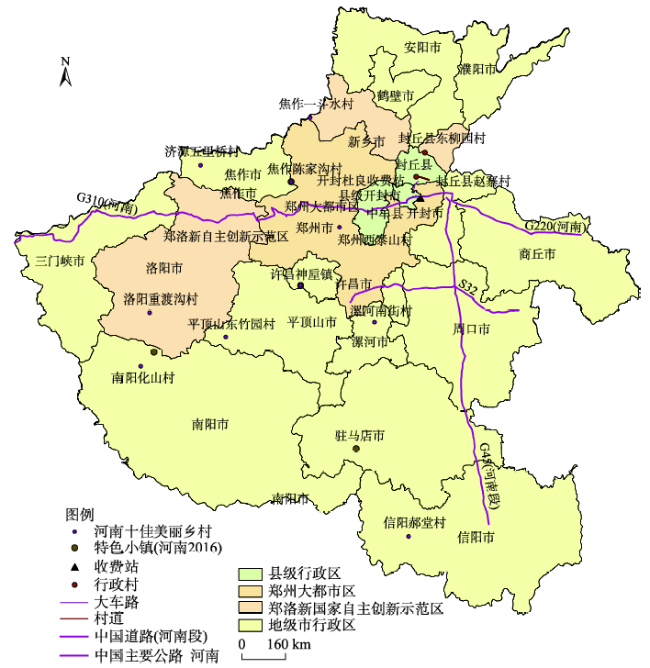
Fig. 1 Distribution of spatial entities图1 实体分布示意图 |
Tab. 3 The contrast of spatial relevance in different scales and methods表3 不同尺度上空间相关度对比表 |
| 实体一 | 实体二 | 类型 | 拓扑关系 | 相关度 (全国尺度) | 相关度 (区域尺度) | 相关度 (传统算法) |
|---|---|---|---|---|---|---|
| 漯河南街村 | 漯河南街村 | 点-点 | 相等 | 1.000 | 1.000 | 1.000 |
| 河南特色小镇(2016) | 许昌神垕镇 | 多点-点 | 包含/被包含 | 0.749 | 0.744 | * |
| 河南十佳美丽乡村(2014) | 河南特色小镇(2016) | 多点-多点 | 重叠 | 0.533 | 0.531 | * |
| 焦作陈家沟村 | 信阳郝堂村 | 点-点 | 相离 | 0.311 | 0.134 | 9.760×10⁻⁷ |
| 开封杜良收费站 | G220(河南) | 点-线 | 包含/被包含 | 0.659 | 0.617 | 1.000 |
| 封丘县赵寨村村道 | 封丘县赵寨村 | 点-线 | 相接 | 0.499 | 0.496 | * |
| 郑州西泰山村 | 封丘县赵寨村村道 | 点-线 | 相离 | 0.327 | 0.284 | 3.965×10⁻⁶ |
| 南阳化山村 | 河南省南阳市 | 点-面 | 包含/被包含 | 0.664 | 0.624 | 0.667 |
| 新乡市封丘县 | 封丘县东柳园村 | 点-面 | 相接 | 0.499 | 0.494 | * |
| 漯河南街村 | 河南省许昌市 | 点-面 | 相离 | 0.330 | 0.308 | 2.650×10⁻⁵ |
| 东郑线 | 东郑线 | 线-线 | 相等 | 1.000 | 1.000 | 1.000 |
| G220(河南) | 东郑线 | 线-线 | 包含/被包含 | 0.721 | 0.707 | 0.528 |
| 023乡道 | 齐边线 | 线-线 | 重叠 | 0.50209 | 0.50208 | 0.502 |
| G220(河南) | G310(河南) | 线-线 | 相接 | 0.411 | 0.383 | 0.333 |
| S32 | G45(河南段) | 线-线 | 相交 | 0.411 | 0.387 | * |
| G220(河南) | S32 | 线-线 | 相离 | 0.328 | 0.292 | 4.840×10⁻⁶ |
| 齐边线 | 县级开封市 | 线-面 | 包含/被包含 | 0.50175 | 0.50174 | 0.670 |
| G220(河南) | 河南省开封市 | 线-面 | 相交 | 0.357 | 0.356 | 0.385 |
| 开柳公路 | 县级开封市 | 线-面 | 相接 | 0.333 | 0.328 | 0.333 |
| 河南省漯河市 | G220(河南) | 线-面 | 相离 | 0.163 | 0.133 | 4.099×10⁻⁶ |
| 郑州大都市区 | 郑州大都市区 | 面-面 | 相等 | 1.000 | 1.000 | 1.000 |
| 河南省郑州市 | 郑州市中牟县 | 面-面 | 包含/被包含 | 0.728 | 0.723 | 0.531 |
| 郑州大都市区 | 郑洛新自主创新示范区 | 面-面 | 重叠 | 0.553 | 0.548 | 0.600 |
| 河南省洛阳市 | 河南省郑州市 | 面-面 | 相接 | 0.495 | 0.461 | 0.357 |
| 河南省洛阳市 | 河南省漯河市 | 面-面 | 相离 | 0.320 | 0.221 | 3.470×10⁻⁶ |
| 河南省洛阳市 | 河南省信阳市 | 面-面 | 相离 | 0.310 | 0.122 | 1.810×10⁻⁶ |
备注:*代表无法处理此种类型的拓扑关系;传统算法指的是文献[19]中提出的算法 |
Tab. 4 The retrieved results of the keywords matching method表4 关键词匹配法检索结果 |
| 数据名称 | 匹配度 |
|---|---|
| 上海市1:10万土地利用数据(2008年) | 1.000 |
| 上海市1:10万土地利用数据(1980s) | 1.000 |
| 上海市1:10万土地利用数据(1995年) | 1.000 |
Tab. 5 The retrieved result of our method表5 本研究提出算法检索结果 |
| 数据名称 | 匹配度 |
|---|---|
| 上海市1:10万土地利用数据(2008年) | 1.000 |
| 上海市1:10万土地利用数据(1980s) | 1.000 |
| 上海市1:10万土地利用数据(1995年) | 1.000 |
| 长三角1:10万土地利用数据(2005年) | 0.892 |
| 长三角地区1980s、1995年、2000年1:25万土地利用数据集 | 0.892 |
| 中国分省土地利用面积数据(1980s、1995年、2005年) | 0.889 |
| 中国1:100万土地利用区划(1996年) | 0.889 |
| 中国地区土地利用/土地覆盖数据集 | 0.889 |
| 中国1 km网格土地利用数据(1980s、1995年、2000年) | 0.889 |
Tab. 6 The contrast of precision, recall and F1-measure of the two methods表6 2种检索方法的准确率、召回率和F1-measure值 |
| 方法名称 | 准确率/% | 召回率/% | F1-measure /% |
|---|---|---|---|
| 方法一(使用本研究提出的算法) | 77.8 | 100 | 87.5 |
| 方法二(关键词匹配算法) | 100 | 42.9 | 60.0 |
The authors have declared that no competing interests exist.
| [1] |
|
| [2] |
[
|
| [3] |
|
| [4] |
|
| [5] |
|
| [6] |
|
| [7] |
|
| [8] |
|
| [9] |
|
| [10] |
|
| [11] |
|
| [12] |
|
| [13] |
|
| [14] |
|
| [15] |
|
| [16] |
|
| [17] |
|
| [18] |
[
|
| [19] |
[
|
| [20] |
[
|
| [21] |
[
|
| [22] |
|
| [23] |
|
| [24] |
|
| [25] |
|
| [26] |
|
| [27] |
|
| [28] |
|
| [29] |
[
|
| [30] |
[
|
| [31] |
|
| [32] |
|
| [33] |
|
| [34] |
[
|
| [35] |
|
/
| 〈 |
|
〉 |