
Journal of Geo-information Science >
Cellular Automata Model of Urban Spatial Expansion Considering the Differences of Land Types Transition and its Application Research
Received date: 2017-04-30
Request revised date: 2017-08-25
Online published: 2018-01-20
Supported by
National Natural Science Foundation of China, No.41171326, 40771198.
Copyright
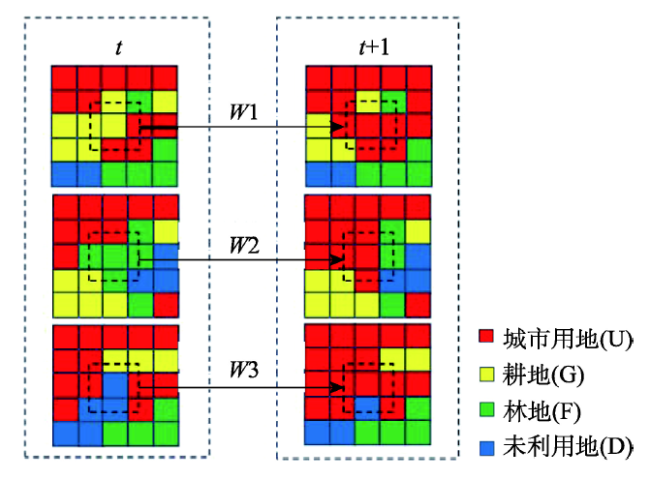
The cellular automata model has become one of the important methods of urban spatial expansion simulation. However, the existing cellular automata model of urban expansion still has some shortcomings. The cell state setting is relatively simple. Differences and strength of land types conversion are not enough in the conversion rules. In this paper, the cellular state and conversion rules of multivariate structures are designed under the framework of cellular automata model, and the urban extended cellular automata model considering the difference and intensity of land conversion is proposed. In the calculation of the conversion probability of non-urban land to urban land, this model takes into account the probability of three aspects: (1) For the impact probability of topography, economic development and other factors of urban development on urban land expansion, we used the logistics approach to calculate this probability. (2) The impacts of land types of neighborhood cells on the convergence rates of central cells. We use the extended molar method to calculate this part of probability. (3) The conversion intensity of different types of non-urban land (i.e. cultivated land, woodland and bare land) into urban land. The calculation of this part is to get the conversion scale of different types of non-urban land into urban land during the period of the base year and the target year by simulation of the superposition of the land use data in this period. Then, we further determine the conversion intensity of the different types of non-urban land into urban land. Finally, the product of the above three probabilities is used as the probability of cell transformation. We used the conversion probability and the conversion threshold to determine whether the central unit would be converted into urban land in the next stage. The number of urban land cells would be increased after the iteration calculation. When the difference between the results of simulated urban land and the size of urban land of the target year was in a certain range, we stopped the simulation and get the final results. The results show that the proposed model can capture urban expansion in the study area with sgood adaptability. The accuracy of the simulation results is 68.66%, which is 4.25% higher than that of the cellular automata model based on the traditional logistics regression. The Kappa coefficient is 0.675.
YU Mingming , ZENG Yongnian . Cellular Automata Model of Urban Spatial Expansion Considering the Differences of Land Types Transition and its Application Research[J]. Journal of Geo-information Science, 2018 , 20(1) : 48 -56 . DOI: 10.12082/dqxxkx.2018.170132
Fig. 1 Model of conversion intensity from different land-use types to urban land图1 不同土地利用类型向城市用地转换强度模型 |
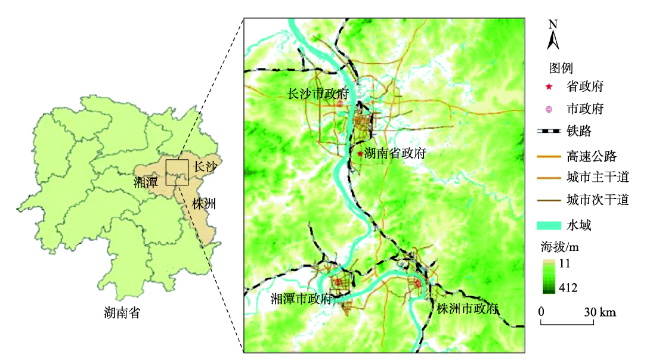
Fig. 2 Location of the study area图2 实验区位置图 |
Tab. 1 Experimental data and its sources表1 实验数据及其来源 |
| 数据类型 | 数据名称 | 数据来源 |
|---|---|---|
| 栅格数据 | 土地利用数据(2001、2010年),坡度、海拔数据 | 土地利用数据由相应时间段的Landsat TM数据解译获得,遥感影像来源于中国地理空间数据云,中国科学院计算机网络信息中心国际科学数据镜像网站 |
| 矢量数据 | 交通道路信息(高速、铁路、国道、省道、城市主干道、城市次干道) | 国家基础地理信息中心 |
| 生活服务信息(宾馆酒店、车站码头、各级政府、汽车服务、商业网点、学校、医院、银行、邮政、电信)、工作便利信息(企事业单位、政府机关)、休闲娱乐信息(水上洲、水域、休闲娱乐场所、旅游景点、运动场馆、植被层) | 湖南省城市电子地图 | |
| 社会经济数据 | 人口密度、城市化率、人均 GDP、全社会固定资产 | 湖南省统计年鉴、长沙市统计年鉴、湘潭市统计年鉴和株洲市统计年鉴以及《长株潭城市群生态绿心地区总体规划(2010-2030)》、《长株潭城市群区域规划(2008-2020 年)》 |
注:本文的栅格数据分辨率均为30 m×30 m |
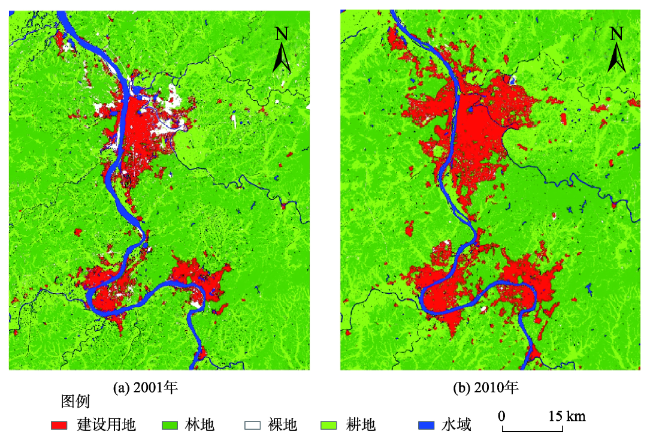
Fig. 3 Land use data图3 土地利用数据 |
Fig. 4 Conversion intensity from different land-use types to urban land图4 不同用地类型向城市用地转换强度 |
Tab. 2 The driving factors and weights of urban land表2 建设用地驱动因子及权重 |
| 驱动因子 | 权重 | 驱动因子 | 权重 |
|---|---|---|---|
| 生活服务(β1) | -2.641 | 房价(β9) | 4.627 |
| 坡度(β2) | 1.734 | 城市化率(β10) | 0.527 |
| 海拔(β3) | 5.434 | 到国道距离(β11) | 1.674 |
| 工作便利(β4) | 5.442 | 到高速距离(β12) | 0.842 |
| 到桥梁距离(β5) | 1.243 | 到城市干道距离(β13) | -2.517 |
| 人口密度(β6) | 5.205 | 到城市环线距离(β5) | 0.654 |
| 人均GDP(β7) | 0.654 | 到省道距离(β6) | 1.981 |
| 固定资产(β8) | 0.340 | 常数(β0) | -7.172 |
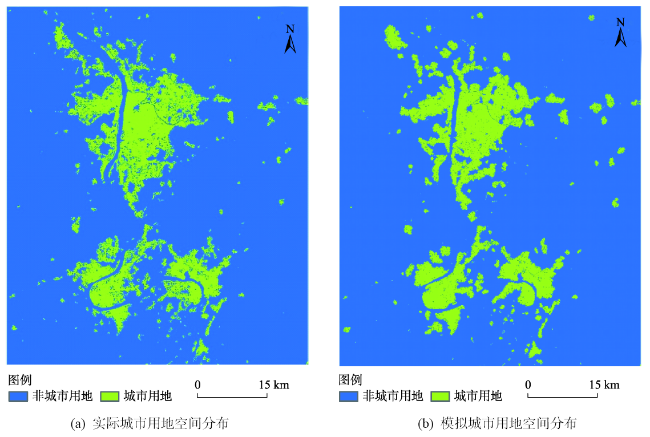
Fig. 5 Spatial distribution of actual urban land and modeling urban use in 2010图5 2010年实际城市用地与模拟城市用地空间分布 |
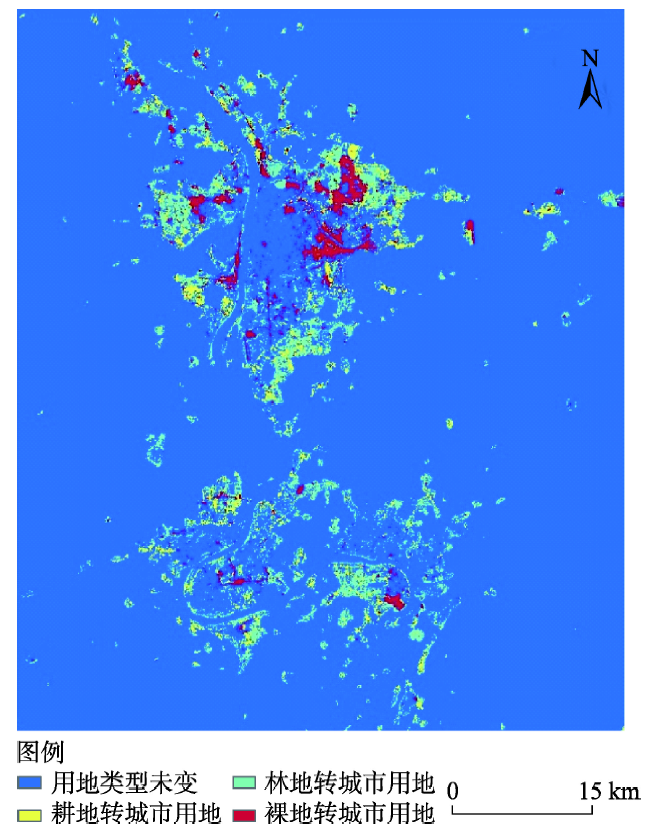
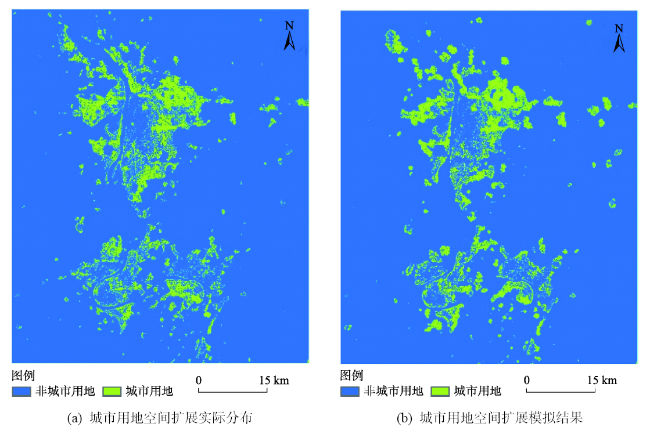
Fig. 6 The spatial distribution of actual new urban land use and modeling urban land use from 2001 to 2010图6 2001-2010年城市用地实际空间扩展及模拟结果 |
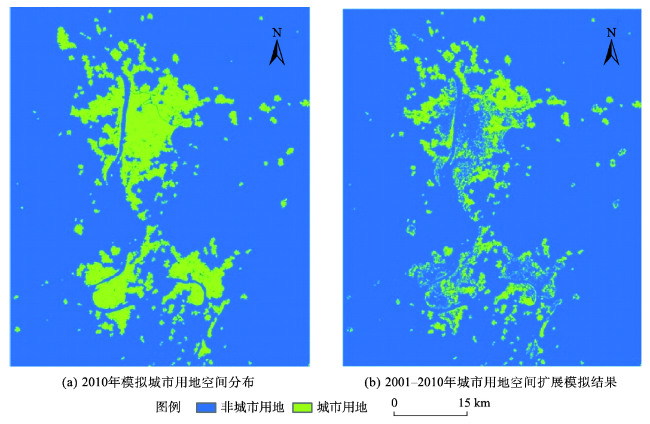
Fig. 7 Overlay results of simulation and status Quo of urban land in 2010图7 2010年城市用地扩展模拟结果与实际分布的差异 |
Tab. 3 Confusing matrix of the simulation results of 2010表3 2010年模拟结果混淆矩阵 |
| 模拟 | ||||
|---|---|---|---|---|
| 不转变 | 转变 | 正确比/% | ||
| 实际 | 不转变 | 5821601 | 123389 | 97.92 |
| 转变 | 125267 | 274435 | 68.66 | |
| 总精度/% | 96.08 | |||
| Kappa系数 | 0.675 | |||
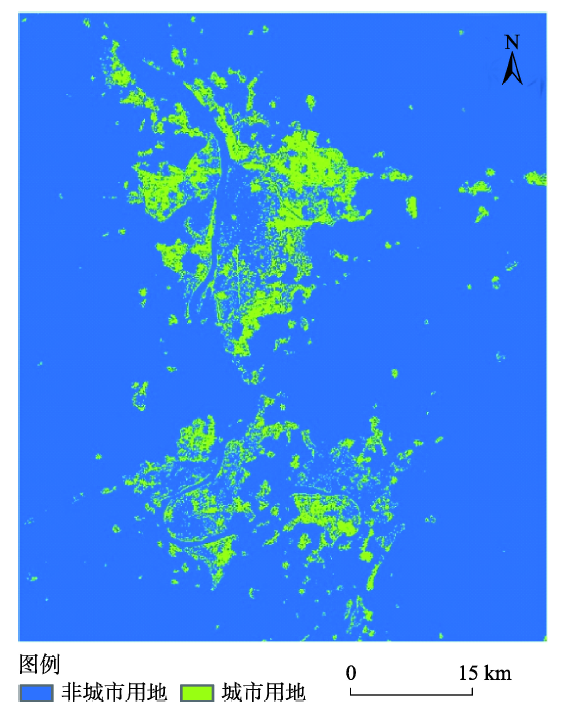
Fig. 8 The traditional simulation results of logistic-based cellular automata model图8 传统基于logistic的元胞自动机模型模拟结果 |
The authors have declared that no competing interests exist.
| [1] |
[
|
| [2] |
[
|
| [3] |
[
|
| [4] |
[
|
| [5] |
[
|
| [6] |
[
|
| [7] |
[
|
| [8] |
[
|
| [9] |
|
| [10] |
[
|
| [11] |
[
|
| [12] |
|
| [13] |
[
|
| [14] |
|
| [15] |
|
| [16] |
|
| [17] |
|
| [18] |
[
|
| [19] |
[
|
| [20] |
[
|
| [21] |
[
|
| [22] |
[
|
| [23] |
[
|
| [24] |
[
|
| [25] |
[
|
| [26] |
[
|
/
| 〈 |
|
〉 |