
Journal of Geo-information Science >
Cloud Shadow Identification Based on QA Band of Landsat 8
Received date: 2017-09-05
Request revised date: 2017-11-06
Online published: 2018-01-20
Supported by
Natural Science Foundation of China, No.41471335,41661144030;Innovation Project of State Key Laboratory of Resources and Environment Information System, No.O88RA303YA.
Copyright
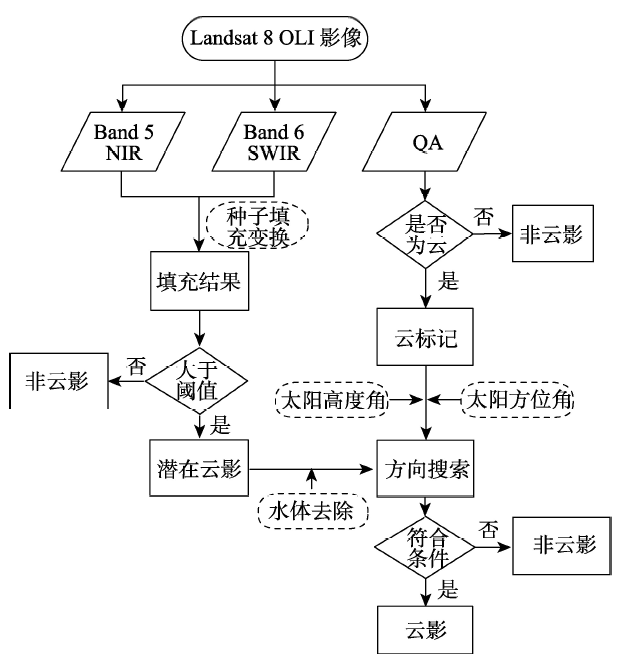
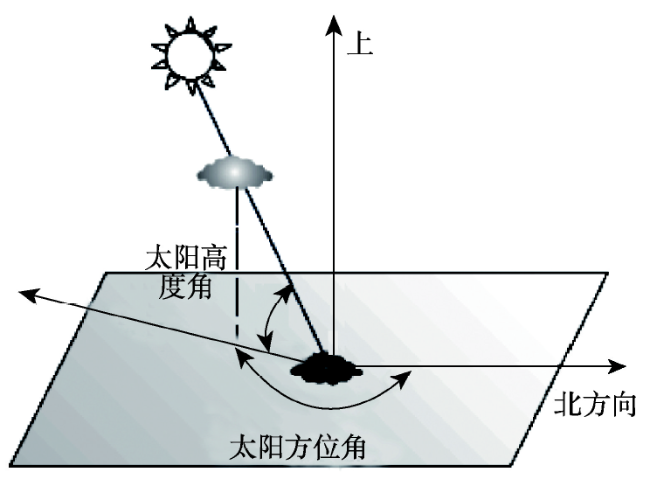
The Landsat program began in 1972, providing valuable scientific data for recording surface dynamics. Landsat data is vulnerable to cloud and cloud shadow. Abnormal pixel values caused by cloud and cloud shadow affect scientific calculation. Cloud and cloud shadow detection is the first step to scientific research using remote sensing data. Newly established cirrus band in Landsat 8 OLI data has the capacity to provide cloud mask as quickly as possible, but the cloud shadow hasn’t been marked. A new method for cloud shadow identification in Landsat 8 imagery is proposed in this paper, based on the Landsat collection 1 level-1 quality assessment (QA) band. First, the cloud pixels are identified using cloud mask stored in QA band. Then, flood-fill transformation algorithm is applied to near-infrared (NIR) band and short-wavelength infrared (SWIR) band to identify potential cloud shadow. After this step, cloud shadow can be discriminated from bright features. However, it will be confused with the dark objects such as water bodies. It is necessary to remove water bodies from the potential cloud shadow. Iterative Self-organizing Data Analysis Technique (ISODATA) is further used to distinguish water from potential cloud shadow. Third, the solar elevation angle and the solar azimuth are employed to match the position of cloud and cloud shadow. The solar elevation influences the distance between cloud and cloud shadow, and the solar azimuth affects the relative direction of cloud and cloud shadow. Because the cloud level varies very much, the cloud shadow can be finally identified through matching of cloud and cloud shadow after several iterations of cloud altitude estimation. To assess the accuracy of cloud shadow identification, a new validation dataset “L8 Biome Cloud Validation Masks” is used to test the method. We applied the new method to five biomes (shrubland, barren land, snow/ice, urban area and wetland). The validation results demonstrated that the method performed well in different biomes with the overall accuracy of more than 87%. Especially, the new method achieved an overall accuracy as high as 94.48% in shrubland. In comparison with the Function of mask (Fmask) algorithm, our new algorithm needs fewer Landsat bands but achieves better results, especially in barren land and shrubland with accuracy of 87.99% and 94.48%, respectively (Fmask: 85.38% and 92.02%, respectively). The method proposed here simplifies the process of cloud shadow identification and cloud level estimation, making the QA band of Landsat 8 OLI more valuable. It has the potential to be further developed to produce cloud shadow mask product.
Key words: Landsat 8; cloud shadow; QA band; L8 Biome; flood-fill transformation
WANG Qiang , HUANG Chong , LIU Gaohuan , LIU Qingsheng , LI He , CHEN Zhuoran . Cloud Shadow Identification Based on QA Band of Landsat 8[J]. Journal of Geo-information Science, 2018 , 20(1) : 89 -98 . DOI: 10.12082/dqxxkx.2018.170414
Tab. 1 Cloud and cloud shadow validation datasets表1 本文选用的云和云影验证数据 |
| 类别 | 文件 ID(Level-1T) | Path | Row | 获取时间 | 云影含量/% |
|---|---|---|---|---|---|
| 裸地 | LC81640502013179LGN01 | 164 | 50 | 2013-06-28 | 18.33 |
| 灌木 | LC80010732013109LGN00 | 1 | 73 | 2013-04-19 | 8.39 |
| 雪/冰 | LC80060102014147LGN00 | 6 | 10 | 2014-05-27 | 4.32 |
| 城市 | LC80640452014041LGN00 | 64 | 45 | 2014-02-10 | 9.43 |
| 湿地 | LC81010142014189LGN00 | 101 | 14 | 2014-07-08 | 9.81 |
Fig. 1 The flow chart of cloud shadow identification for Landsat 8 OLI image图1 Landsat 8 OLI云影识别技术路线图 |
Tab. 2 The bit-packed information in the QA bands: from right to left, starting with bit 0 to bit 15表2 Landsat 8 QA波段16比特值列表 |
| Bit | ||||||||||||||||
|---|---|---|---|---|---|---|---|---|---|---|---|---|---|---|---|---|
| 15 | 14 | 13 | 12 | 11 | 10 | 9 | 8 | 7 | 6 | 5 | 4 | 3 | 2 | 1 | 0 | |
| 描述 | 云标记 | 卷云标记 | 雪/冰标记 | 保留值 | 保留值 | 水体标记 | 保留值 | 地形遮蔽 | 失帧 | 填充 | ||||||
Tab. 3 Landsat 8 QA value interpretation表3 QA波段像元值及相应类别判断表 |
| 像元值 | 云 | 卷云 | 雪/冰 | 水体 | 地形遮蔽 | 失帧 | 填充 | 像元描述 |
|---|---|---|---|---|---|---|---|---|
| 1 | 未确定 | 未确定 | 否 | 否 | 否 | 否 | 是 | 填充像元 |
| 2 | 未确定 | 未确定 | 否 | 否 | 否 | 是 | 否 | 失帧像元 |
| 20 480 | 否 | 否 | 否 | 否 | 否 | 否 | 否 | 清晰像元 |
| 20 484 | 否 | 否 | 否 | 否 | 是 | 否 | 否 | 清晰的地形遮蔽像元 |
| 20 512 | 否 | 否 | 否 | 可能 | 否 | 否 | 否 | 水体 |
| 23 552 | 否 | 否 | 是 | 否 | 否 | 否 | 否 | 雪/冰 |
| 28 672 | 否 | 是 | 否 | 否 | 否 | 否 | 否 | 卷云 |
| 31 744 | 否 | 是 | 是 | 否 | 否 | 否 | 否 | 卷云或雪/冰 |
| 36 864 | 可能 | 否 | 否 | 否 | 否 | 否 | 否 | 可能为云 |
| 36 896 | 可能 | 否 | 否 | 可能 | 否 | 否 | 否 | 可能为云或水体 |
| 39 936 | 可能 | 否 | 是 | 否 | 否 | 否 | 否 | 可能为云或雪/冰 |
| 45 056 | 可能 | 是 | 否 | 否 | 否 | 否 | 否 | 可能为云或卷云 |
| 48 128 | 可能 | 是 | 是 | 否 | 否 | 否 | 否 | 可能为云和卷云或是雪/冰 |
| 53 248 | 是 | 否 | 否 | 否 | 否 | 否 | 否 | 云 |
| 56 320 | 是 | 否 | 是 | 否 | 否 | 否 | 否 | 云或雪/冰 |
| 61 440 | 是 | 是 | 否 | 否 | 否 | 否 | 否 | 云或卷云 |
| 64 512 | 是 | 是 | 是 | 否 | 否 | 否 | 否 | 云或卷云或雪/冰 |
Fig. 2 The influence of the solar elevation angle and the solar azimuth on the horizontal distance and the relative direction of cloud and cloud shadow图2 太阳高度角和太阳方位角对云和云影水平距离和相对方向的影响 |
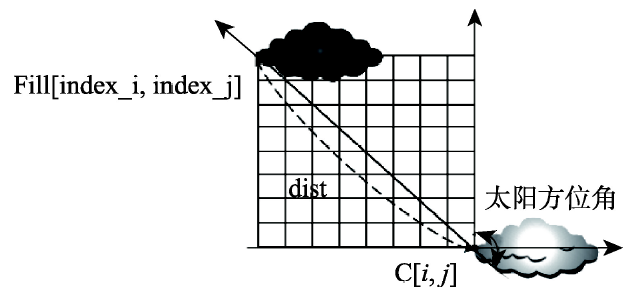
Fig. 3 The relative position of cloud and cloud shadow图3 云和云影相对位置示意图 |
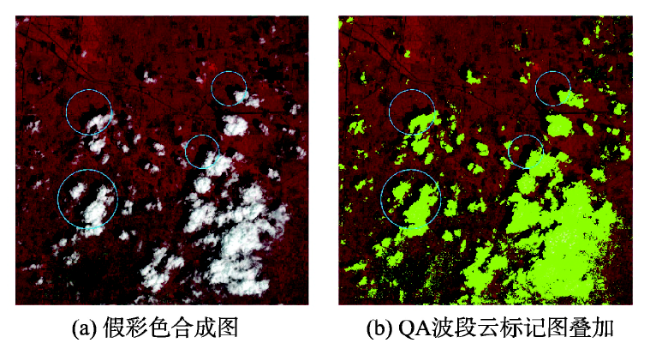
Fig. 4 The experimental image, displayed as a false color composite and the cloud identification result in the false color composite image图4 实验影像 |
Tab. 4 Cloud identification confusion matrix of QA band表4 QA波段云标记结果验证混淆矩阵 |
| 识别类别 | 真实类别 | |||
|---|---|---|---|---|
| 云 | 非云 | 总和 | 用户精度/% | |
| 云 | 47 | 8 | 55 | 85.45 |
| 非云 | 9 | 236 | 245 | 96.32 |
| 总和 | 56 | 244 | 300 | |
| 制图精度/% | 83.93 | 96.72 | ||
| 总体精度/% | 94.33 | |||
Fig. 5 The identification of cloud shadow图5 云影检测结果 |
Tab. 5 Cloud shadow identification confusion matrix of QA band and Fmask表5 云影检测结果混淆矩阵 |
| 识别类别 | 真实类别 | ||||
|---|---|---|---|---|---|
| 云影 | 非云影 | 总和 | 用户精度/% | ||
| 基于QA波段的云影识别方法 | 云影 | 20 | 2 | 22 | 90.91 |
| 非云影 | 5 | 273 | 278 | 98.2 | |
| 总和 | 25 | 275 | 300 | ||
| 制图精度/% | 80 | 99.27 | |||
| 总体精度/% | 97.67 | ||||
| Fmask方法 | 云影 | 19 | 9 | 28 | 67.86 |
| 非云影 | 6 | 266 | 272 | 97.79 | |
| 总和 | 25 | 275 | 300 | ||
| 制图精度/% | 76 | 96.73 | |||
| 总体精度/% | 95.00 | ||||
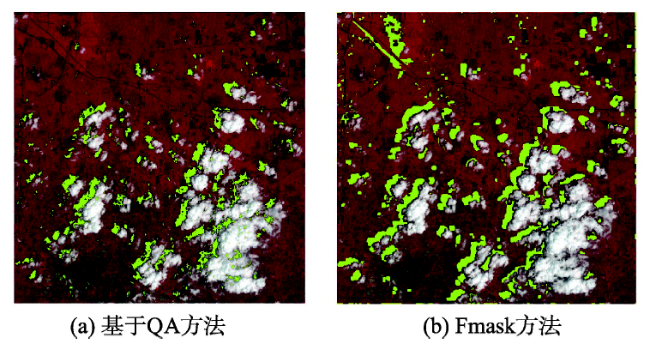
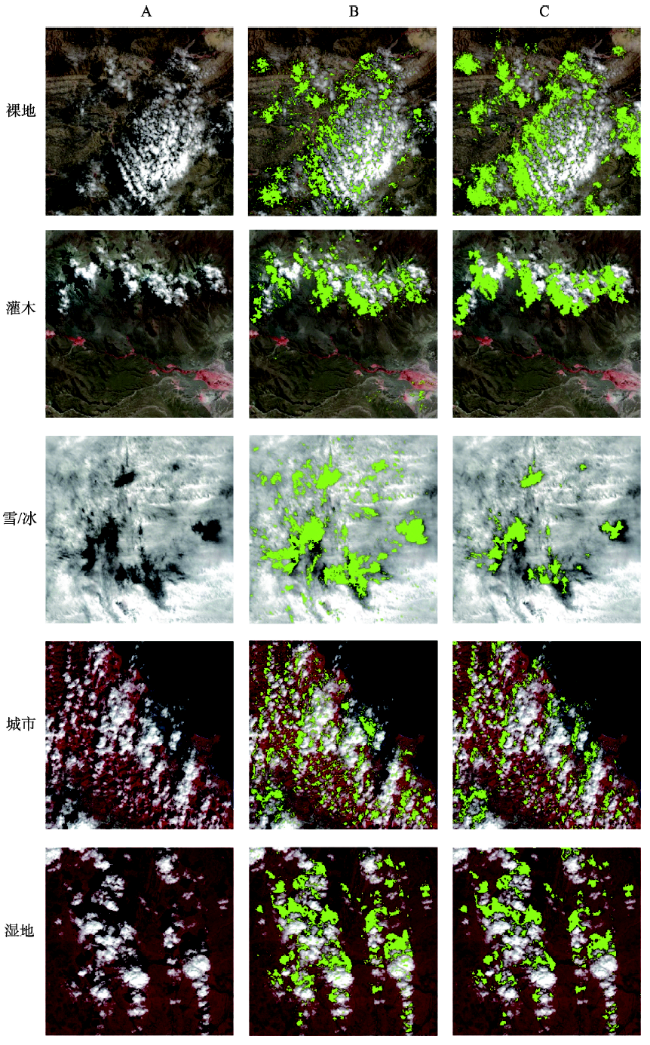
Fig. 6 The cloud shadow identification results图6 云影识别结果 |
Tab. 6 The accuracy assessment of cloud shadow identification, using “L8 Biome” dataset表6 基于L8 Biome数据集的云影检测验证结果 |
| 类别 | 云影像元占总像元数/% | 用户精度/% | 生产者精度/% | 总体精度/% |
|---|---|---|---|---|
| 裸地 | 19.90 | 65.87 | 71.50 | 87.99 |
| 灌木 | 9.92 | 64.47 | 76.25 | 94.48 |
| 雪/冰 | 16.03 | 26.96 | 99.96 | 88.29 |
| 城市 | 18.5 | 40.70 | 79.93 | 87.13 |
| 湿地 | 15.54 | 60.03 | 95.04 | 93.30 |
Fig. 7 The cloud shadow identification results of Fmask图7 Fmask云影识别结果 |
Tab. 7 The comparison of overall accuracy of cloud shadow identification based on QA band and Fmask algorithm表7 基于QA波段云影检测总体精度和Fmask云影检测总体精度比较 |
| 类别 | Fmask方法总体精度/% | 基于QA总体精度/% |
|---|---|---|
| 裸地 | 85.38 | 87.99 |
| 灌木 | 92.02 | 94.48 |
| 城市 | 90.38 | 87.13 |
The authors have declared that no competing interests exist.
| [1] |
[
|
| [2] |
[
|
| [3] |
|
| [4] |
|
| [5] |
|
| [6] |
|
| [7] |
|
| [8] |
|
| [9] |
|
| [10] |
|
| [11] |
[
|
| [12] |
[
|
| [13] |
[
|
| [14] |
[
|
| [15] |
[
|
| [16] |
[
|
| [17] |
[
|
| [18] |
[
|
| [19] |
[
|
| [20] |
[
|
| [21] |
|
| [22] |
|
| [23] |
|
| [24] |
|
| [25] |
|
| [26] |
|
| [27] |
|
| [28] |
[
|
| [29] |
[
|
/
| 〈 |
|
〉 |