Effects of Spatial Resolution and Texture Features on Multi-spectral Remote Sensing Classification

  • YANG Yanjun , 1, 2, 3 ,
  • TIAN Qingjiu , 1, 2, * ,
  • ZHAN Yulin 4 ,
  • TAO Bo 3 ,
  • XU Kaijian 1, 2
Expand
  • 1. International Institute for Earth System Science, Nanjing University, 210023 Nanjing, China
  • 2. Jiangsu Provincial Key Laboratory of Geographic Information Science and Technology, Nanjing University, 210023 Nanjing, China
  • 3. University of Kentucky, 40546 Lexington, USA
  • 4. The State Key Laboratory of Remote Sensing Science, Institute of Remote Sensing and Digital Earth, Chinese Academy of Sciences, 100101 Beijing, China
*Corresponding author: TIAN Qingjiu, E-mail:

Received date: 2017-05-05

  Request revised date: 2017-09-24

  Online published: 2018-01-20

Supported by

National Natural Science Foundation of China, No.41771370;High-resolution Earth Observation System Project of China, No.30-Y20A29-9003-15/17, 03-Y20A04-9001-15/16, 03-Y20A04-9001-17/18;National Key R&D Program of China, No.2017YFD0600903.

Copyright

《地球信息科学学报》编辑部 所有

Abstract

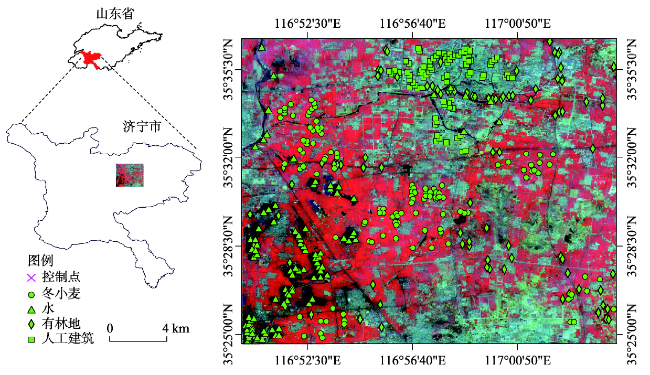
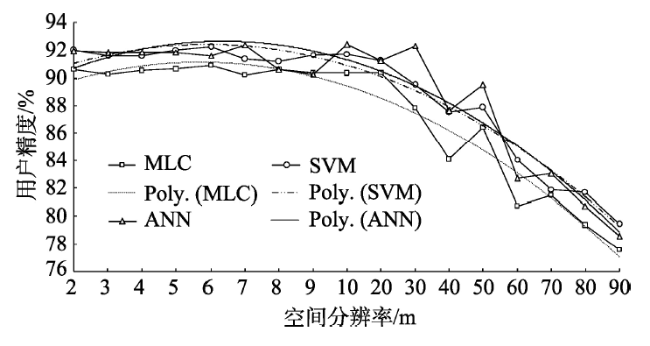
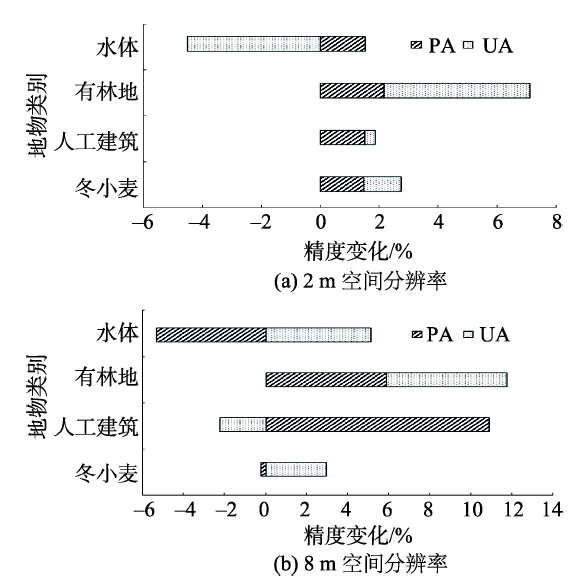
Multi-spectral remote sensing classification is strongly affected by spatial resolution while the classification accuracy is not necessarily improved by the increase of the spatial resolution. There exists an optimal resolution for each geographical entity, corresponding to its intrinsic spatial and spectral characteristics. Despite of many existing efforts, it is still far from clear how spatial resolutions affect classification accuracy. In recent studies, texture feature has been widely used as an effective factor to increase the classification accuracy of multi-spectral remote sensing. As an important characteristic of spatial information, texture feature is closely linked with morphology and distribution of objects. It may greatly increase classification accuracy in some cases that the same object has different spectra or different objects have the same spectrum. However, large uncertainties still exist in the effects of texture feature on classification for various objects at different spatial scales. This paper presents a case study implemented in Jining, Shandong Province to examine the impacts of spatial resolution and texture features on Multi-spectral Remote Sensing Images Classification using the Chinese Gaofen-1 (GF-1) satellite data. The GF-1 satellite was successfully launched on April 26, 2013, which was equipped with two types of sensors. One is the wide field view sensor (WFV sensor); the other is the panchromatic and multispectral sensor (PMS sensor) which can acquire panchromatic images at 2 m spatial resolution and multispectral images at 8 m spatial resolution. First, we carried out radiometric calibration, atmospheric correction and precise geometric rectification for original images. Then, we conducted data fusion based on Gram-Schmidt transformation and performed the expansion of spatial scales for the establishment of the spatial series of the reflectance (2~10 m at an interval of 1 m, 10~90 m at an interval of 10 m). Second, we generated the classification results using three popular approaches, i.e., the Maximum Likelihood Classification (MLC), the Support Vector Machine (SVM) and the Artificial Neural Network (ANN). Third, after the calculation of texture features of 2 m and 8 m for reflectance images, separately, the Principal Components Analysis (PCA) method was used for texture features selection. The data combining key features with corresponding multi-spectral bands were classified based on the ANN approach. Finally, we evaluated the classification accuracies using the confusion matrix. Our final regression analysis suggested an optimal spatial resolution of 5 m for the multi-spectral classification, implying that the optimal selection of the spatial resolution is not affected by the spectral information of multi-spectral remote sensing images. Further analysis of changing trend of accuracies along with spatial resolution showed a sharp decrease when the spatial resolution is coarser than 20-30 m. The results of the impacts of texture feature suggested that, compared with the classification by spectral information, the accuracies of winter wheat, architecture, forest and water were increased by 1.49%, 1.51%, 4.94% and 1.54% at 2 m resolution, and 2.95%, 10.95%, 5.91% and 5.14% at 8 m resolution, respectively, when the texture features were introduced. We concluded that, compared with the classification accuracy of the spectral information, considering texture feature effects may improve the classification accuracies, to varying degrees, at different spatial resolutions, especially when an appropriate resolution was chosen. Our findings are practically helpful for the optimal selection of spatial resolution for multi-spectral remote sensing classification. In the next step, we will further examine the impacts of spatial resolution and texture features at larger scales. In addition, the impacts of texture features at different phenological stages will also be investigated.

Cite this article

YANG Yanjun , TIAN Qingjiu , ZHAN Yulin , TAO Bo , XU Kaijian . Effects of Spatial Resolution and Texture Features on Multi-spectral Remote Sensing Classification[J]. Journal of Geo-information Science, 2018 , 20(1) : 99 -107 . DOI: 10.12082/dqxxkx.2018.170177

1 引言

随着现代遥感技术的发展,多空间分辨率和多光谱分辨率的遥感图像得到广泛应用。遥感分类一直是遥感领域的热点问题,但是大量遥感影像的出现造成了分类数据空间分辨率选择困难[1]。遥感在空间理论发展中考虑了尺度与地理实体固有的空间属性,因此,由地学现象的尺度本身出发,选择遥感影像的最佳空间分辨率具有现实意义[2,3]。随着空间分辨率的提高,遥感分类精度在一定程度上有了提高,但高空间分辨率给信息提取也面临着新的挑战,空间分辨率越高并不能保证遥感地物分类的精度越高,关键是选择与地物尺度相适宜的最佳空间分辨率[4]。目前,有关多光谱分类与空间分辨率关系的研究主要集中在高空间分辨率范围[5,6,7,8],而多光谱分类在更详细的空间尺度范围以及中等空间分辨率下的分类精度变化鲜有探究。因此,本文结合在中高分辨率范围的遥感分类精度分析空间分辨率对多光谱遥感分类精度的影响,为多光谱遥感分类数据空间分辨率的选择提供了有效的参考,同时对提高多光谱遥感数据的利用效率具有重要的现实意义。
随着近年高空间分辨率数据的增多,纹理特征作为遥感图像的重要信息和基本特征被广泛关注并应用于遥感分类[9]。通过增加纹理特征波段,增加分类源数据信息,增大不同地类之间的区分度,利用更多的信息可以有效地提高分类精度[10,11]。当目标的光谱特征比较接近时,光谱可分性降低,纹理信息对于区分目标会起到积极的作用,纹理的增加也可以在一定程度上促进“异物同谱、同物异谱”问题的解决[12]。此外,由于地物类型的复杂性,不同地物类型在不同空间尺度上的表现也不同[13],且纹理表达的是影像的空间特征,地物类型的形态分布等与纹理特征息息相关,纹理的加入可能对不同空间分辨率下、不同地物分类精度产生不同影响,引入纹理特征分类之前需要考虑。但是,目前有关纹理特征对不同地物类型分类精度影响的相关研究还不多见,因此本文选用4种典型地类探究其分类精度受纹理特征的影响。
本文在山东省选择试验区,基于高分一号2 m全色和8 m多光谱影像,经过数据融合得到高空间分辨率多光谱数据,并对其进行尺度扩展构建包含光谱信息的反射率空间序列,选择当前较有代表性的3种分类方法最大似然法(Maximum Likelihood Classification,MLC)、支持向量机(Support Vector Machine,SVM)、人工神经网络(Artificial Neural Network,ANN)对序列分类[14]。然后,利用灰度共生矩阵计算2 m融合数据及8 m多光谱数据的纹理特征,利用主成分分析(Principle Component Analysis, PCA)提取关键特征与多光谱波段组合并采用ANN方法对其分类,最后计算混淆矩阵验证结果精度。基于分类结果对以下2方面进行分析:① 多光谱遥感分类最佳空间分辨率以及分类精度随空间分辨率变化的变化趋势;② 在2 m和8 m空间分辨率下,纹理特征对不同地物分类精度的影响。

2 研究区概况与数据源

2.1 研究区概况

研究区位于山东省济宁市(东经115°50′40″~117°03′10″,北纬 34°26′40″~35°35′30″),地处黄淮海平原与鲁中南山地交接地带(图1)。地貌类型以平原为主,土壤类型丰富。该地区属温带大陆性季风气候,日照充足,四季分明;年平均气温为 13.6 ℃,年平均无霜期为170~220 d。年平均降水量大约为500~800 mm,降水主要集中于夏季,春旱夏涝灾害经常发生。黄淮海平原是中国冬小麦主产区之一,研究区农作物亦以冬小麦为主[15]
Fig. 1 The map of the study area

图1 研究区概况

2.2 数据源

中国陆地资源卫星高分一号卫星(GF-1)于2013年4月26日在酒泉卫星发射中心成功发射,是中国首颗民用高分辨率卫星。卫星搭载的全色多光谱相机(Panchromatic and Multispectral Sensor, PMS)全色波段可以达到2 m空间分辨率,多光谱波段可以达到8 m空间分辨率,单景幅宽30 km,多光谱谱段共设置4个波段,光谱范围为0.45~0.89 μm (蓝光:0.45~0.52 μm,绿光:0.52~0.59 μm,红光:0.63~0.69 μm,近红外:0.77~2.5 μm) [16]。同Moderate Resolution Imaging Spectroradiometer(MODIS)、 HJ-1、Landsat相比,高分一号卫星系统的发射是对地球表面资源进行遥感解译研究的又一重大举措,其空间分辨率相对以往卫星产品有了很大的提高,为遥感科学研究及其应用提供了质量更高的数据[17]
研究表明,绿色植物的反射光谱曲线在蓝光波段和红光波段各有一个叶绿素吸收带,在近红外波段则呈现高反射,是区分于非植被的典型特征[18]。本研究结合2016年4月在山东省的实地考察,以及GF-1数据获取情况,根据遥感影像数据的可得性、可操作性、可比性等原则,选取云量小于10%的影像开展工作,采用2016年4月13日的遥感影像,文件名文件名为GF1_PMS1_E116.9_N35.5_20160413_ L1A0001521880。
2016年4月在研究区开展野外试验,采集了大量典型地物类型的样点,获取了研究区4种地物类型分布的样点共2065个(表1),并利用手持精度1 m的GPS采集用于几何精校正的控制点30个。
Tab. 1 Sample numbers

表1 样本数量

类别 样本
训练样本 验证样本
冬小麦 120 804
有林地 90 413
水体 98 130
人工建筑 80 330
总计 388 1677

3 研究方法

3.1 数据预处理

首先,对多光谱影像辐射定标,将DN值转成辐亮度,然后借助ENVI/IDL的 FLAASH模块进行大气校正得到地表反射率,并选用二次多项式模型,利用地面控制点对高空间分辨率影像进行几何精校正[19],再利用校正好的影像校正多光谱影像,误差控制在小于1个像元。之后,基于Gram-Schmidt对全色和多光谱数据进行影像融合,充分利用全色的高空间分辨率和多光谱的光谱信息,融合后的影像既保持了多光谱影像丰富的光谱信息,同时提高了空间分辨率、增强了清晰的纹理特征[20]

3.2 反射率空间序列构建

采用同一幅影像进行尺度扩展保证整个空间序列数据源相同,减少序列构建过程中的误差。为了最大程度地保持影像的光谱信息,选用信息丢失最少的最邻近插值法[21]。该方法计算简单,速度快且不会改变原始栅格值,由于对影像信息量的影响较小,尤其适合分类前使用[22]。由融合后的高空间分辨率多光谱影像重采样得到一组反射率空间序列用于开展分类研究(即2、3、4、5、6、7、8、9、10、20、30、40、50、60、70、80和90 m)。

3.3 纹理特征计算

应用灰度共生矩阵(Gray Level Co-occurrence Matrices,GLCM)描述影像灰度值的空间关系和结构特征,该方法能够较好地体现图像灰度统计规律[23]。采用3×3窗口对2 m融合数据及8 m多光谱数据计算纹理特征[24]。由于波段数量太多容易造成数据冗余,不利于分类研究,故采用主成分分析(Principal Component Analysis,PCA),选取关键特征[25]。结果显示,前3个波段包含了95%的信息量,因此分别选用2 m和8 m分辨率下的前3个主成分与相应反射率波段组合用于探究纹理特征对分类的影响。

3.4 样本选择

根据野外试验,获取研究区4种典型地物的分布样本,包括冬小麦、有林地、水体、人工建筑(表1)。由于分类结果会受训练样本的影响,所以训练样本的选择应该具有代表性。同时为确保样本的纯度应尽量选择地物类型的中心点,尤其对于90 m分辨率的数据。每个类型的训练样本个数至少是本身数据维数的10-30倍才能够包含足够的信息正确描述地物类型的均值和方差[26,27]。为了保证分类结果的可对比性,分类过程需要采用同一组训练样本,且应该选用不同于训练样本的另外一组验证样本对所有分类结果进行精度评价(各地物类型的训练样本与验证样本数量见表1)。
JM 距离是基于条件概率理论的可分性评价指标,适合于表达类别可分性,公式如下[28]
J M ij = x p ( X / ω i ) - p ( X / ω j 2 dX 1 2 (1)
式中: p ( X / ω i ) 为条件概率密度,即第i个像元属于第ωi个类别的几率。
计算每2个地类间的JM距离,JMij范围是0-2,代表样本间可分离程度。分离度大于1.90时,说明具有很好的可分离性[29]。如图2所示,整个反射率序列的所有JM值都大于1.90,其中冬小麦与建筑、冬小麦与水体的可分性非常好,JM值达到了2;图3是2 m和8 m分辨率下不同地类之间的分离度,所有JM值都大于1.95。以上说明4种地类的训练样本之间具有很好的分离度,可以用于开展分类研究。
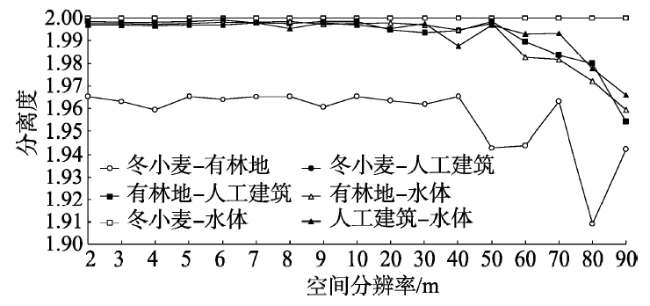
Fig. 2 Jeffreys-Matusita distance of four typial classes at different spatial resolutions

图2 不同空间分辨率下4种地物之间的JM

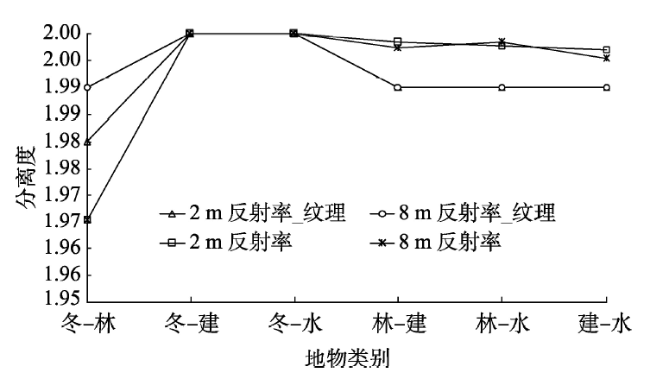
Fig. 3 Jeffreys-Matusita distance of four typial classes at 2 m and 8 m spatial resolutions

图3 2 m和8 m分辨率下4种地类之间的JM
注:冬指冬小麦;林指有林地;建指人工建筑;水指水体

3.5 分类方法

选用最大似然分类(Maximum Likelihood Classification,MLC)、支持向量机分类(Support Vector Machine,SVM)、人工神经网络分类(Artificial Neural Network,ANN)开展反射率空间序列分类。基于参数化密度分布模型的MLC是遥感影像分类最常用手段之一,它具有清晰的参数解释能力、易于与先验知识融合、算法简单、分类精度较高,和计算时间快等优点[30]。SVM是一种不通过概率密度估计直接构造分类面的全新的模式识别方法,通过引进核函数把低维特征空间中的样本数据映射到高维特征空间来实现分类,常被用于分类回归分析,具有突出的分类性能[31]。ANN是一种非参数的分类方法,具有良好的适应能力和复杂的映射能力,以模拟大脑结构和机能为基础,实现非线性的数据模式识别,能够有效地结合影像的光谱和纹理特征提高分类精度[32]

3.6 精度评价

利用相同的验证样本对分类精度进行精度检验。采用拟合分析方法对反射率空间序列分类的结果进行对比分析,并对2 m和8 m分辨率下纹理特征加入前后的分类结果进行精度评价。选取混淆矩阵的4个指标进行表示,包括Kappa系数(Kappa Coefficient)、总体分类精度(Overall Accuracy, OA)、制图精度(Producer’s Accuracy, PA)和用户精度(User’s Accuracy, UA)[33]

4 结果与讨论

4.1 空间分辨率对多光谱遥感分类精度的影响

从反射率空间序列分类结果可以看出(图4),ANN分类精度最高,其次是SVM,MLC的精度最低。利用单景影像的光谱信息分类,ANN方法得到的最高精度达到92.38%,Kappa系数达到0.8861。
Fig.4 Overall accuracy of the classification for three methods at different spatial resolutions

图4 3种分类方法的总体精度曲线及相应趋势线
注:Poly.(MLC) 代表MLC总体分类精度的趋势线;Poly. (SVM) 代表SVM总体分类精度的趋势线;Poly. (ANN) 代表ANN总体分类精度的趋势线

回归拟合可以准确表达2个变量之间的关系,由于受空间数据的限制以及数据重采样等过程造成的误差影响,不能无限地加密空间序列,而采用拟合法可以定量分析多光谱遥感分类的最佳空间分辨率。通过添加趋势线分析整个反射率空间序列的总体精度变化趋势,选用拟合程度最高的二次多项式方程求得趋势线的最大值作为最佳空间分辨率,如式2所示。
y MLC = - 0.0931 x 2 + 0.8757 x + 89.094 R 2 = 0.94 y SVM = - 0.0900 x 2 + 0.8841 x + 90.242 = 0.97 y ANN = - 0.1021 x 2 + 1.0979 x + 89.684 = 0.90 (2)
x MLC = 4.7 x SVM = 4.9 x ANN = 5.3
通过对总体精度的拟合曲线分析,得到利用3种分类方法对反射率分类的最佳空间分辨率在5 m,有学者利用IKONOS影像得到不同地物类型的最佳空间分辨率范围在3~7 m,而本文通过对更广的空间尺度遥感影像分类分析,进一步明确了地物遥感分类的最佳空间分辨率,本文的研究结果比先前学者得到的结论更加精确[6,34],这说明遥感分类的最佳空间分辨率不会受到光谱信息的影响,同时也证明了回归分析可以用于对遥感空间序列分类精度的拟合分析。
图4可看出,随着空间分辨率的变化3种分类方法的总体精度变化趋势大致相同,但在不同的空间分辨率范围内,分类精度变化的速度不同。空间分辨率在2~20 m时,随着空间分辨率的降低3种分类法的精度变化较为稳定,降低趋势缓和,且总体分类精度一致保持在90%以上。但是当空间分辨率低于20 m后,MLC和SVM分类精度快速降低到90%以下,当空间分辨率低于30 m时,ANN的分类精度也随之降低到90%以下,在整个空间序列内分辨率在20~30 m区间分类精度变化最为显著,因此,20~30 m空间分辨率范围是多光谱遥感分类获得较高精度的一个重要临界位置,由此可以为多光谱遥感分类数据空间分辨率的选择提供有效参考。

4.2 纹理特征对不同地物分类的影响

利用ANN分类方法对2 m和8 m空间分辨率的反射率数据及纹理与反射率结合数据分别进行分类,分类结果如图5所示,精度如表2所示。其中,PA指制图精度,UA指用户精度,OA指总体分类精度。
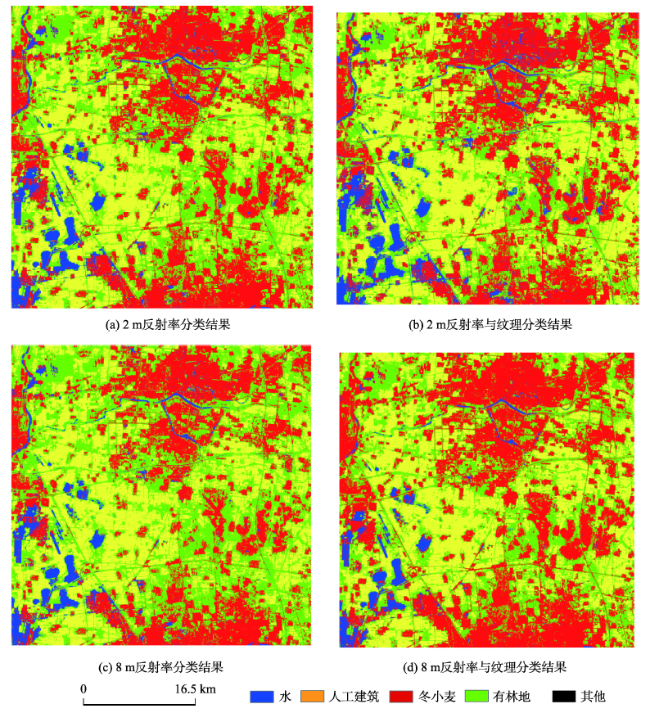
Fig.5 Classification results before and after introducing texture features at 2 m and 8 m spatial resolution

图5 2 m和8 m分辨率下纹理特征加入前后的分类结果图

Tab. 2 Classification accuracy of four classes

表2 4种典型地类的分类精度

数据类别 OA/% Kappa系数 冬小麦/% 有林地/% 水体/% 人工建筑/%
PA UA PA UA PA UA PA UA
2 m反射率 91.95 0.8789 93.91 94.49 89.10 82.33 96.92 94.03 88.79 98.65
2 m反射率_纹理 93.62 0.9000 95.40 95.76 91.28 87.27 98.46 89.51 90.30 99.00
8 m反射率 90.59 0.8585 93.03 94.44 88.94 78.19 96.92 94.03 84.19 98.58
8 m反射率_纹理 93.64 0.9100 92.78 97.39 94.84 84.10 91.54 99.17 95.14 96.31
从分类结果精度可看出,利用光谱与纹理特征结合分类精度高于仅利用光谱特征分类的精度,说明纹理特征与光谱信息结合可以提高遥感分类精度,但不同分辨率下精度变化不同,引入纹理特征后,在8 m分辨率下的总体分类精度高于2 m分辨率的精度,同时我们发现,纹理特征的加入对4种地类的影响程度各不相同。利用公式计算引入纹理特征前后的精度变化,如图6所示。
C A i = A C tei - A C rei (3)
式中:CAi指空间分辨率为i时的精度变化;ACreiACtei分别指空间分辨率为i时加入纹理前后的分类精度。
Fig. 6 Accuracy changes of four classes before and after adding texture features

图6 添加纹理特征前后各地物的精度变化
注:PA 代表制图精度,UA代表用户精度

对照引入纹理特征前后的分类精度,分析在不同空间分辨率下纹理特征的加入对4种地类分类精度的影响。① 在2种空间分辨率下,纹理特征加入前后冬小麦分类精度都在90%以上,可能与本文的数据时间选择有一定关系,春季是冬小麦识别的最佳时期,该时期冬小麦与其他地类的光谱信息差异最大,区分明显[35]。纹理特征加入后,冬小麦分类精度在2 m分辨率下提高了1.47%,在8 m分辨率下提高2.95%,纹理特征对冬小麦分类精度作用不明显,尤其在空间分辨率为2 m时,破碎度较高的小地块易形成混合像元,导致纹理特征加入后其精度变化不大。② 水体在不同分辨率下的分类精度都较高,尤其是引入纹理特征前水体分类就达到了较高的精度,这与水体的光谱特征密切相关,由于水体的光谱反射率较低,与其他地类差异最为明显,仅利用光谱信息就可以达到较为理想的分类精度。如图6,加入纹理特征后,2种空间分辨率下的水体的分类精度都没有较大的改善,在2 m分辨率下用户精度降低了4.52%,制图精度提高了1.54%,在8 m分辨率下用户精度提高了5.14%,制图精度降低了5.38%,与其他地类相比,纹理特征的引入对水体分类精度没有明显的改善。在图5中(a)与(b)、(c)与(d)相比,在图5(b)和图5(d)中分类结果水体区域增加,但与实际情况对比,增加的部分并非水体,由此可见纹理特征的加入对水体而言成为了冗余信息,使其与其他地物的差异程度降低,因此水体的分类精度没有得到明显改善,冗余信息的加入甚至加重了水体的错分现象。③ 纹理特征对人工建筑分类的影响作用最显著,在8 m空间分辨率下人工建筑分类精度提高了10.95%,可能在该空间分辨率下人工建筑的形态较为均一,纹理特征明显,但是纹理的加入对2 m分辨率的人工建筑分类精度仅提高了1.51%,说明纹理特征对分类精度的影响与空间分辨率有着密切的关系。④ 仅利用光谱信息分类的有林地精度最低,虽然利用反射率对有林地的分类效果不理想,但是添加纹理特征后精度有了较大程度的改善,在2 m分辨率下,UA和PA分别提高了2.18%和4.94%,在8 m分辨率下UA和PA分别提高了5.90%和5.91%,2种评价精度同时得到提高说明纹理特征有助于提高有林地的分类效果。虽然加入纹理后有林地分类精度提高幅度较大,但是用户精度仍然低于85%,所以有林地分类精度的提高需要进一步探究。综上,不同地物类型受纹理特征的影响程度不同,并与空间分辨率有着密切关系,因此纹理特征对多光谱遥感分类的影响并不是分辨率越高分类精度越高,在适宜的分辨率下进行分类识别才能达到更好的效果。

5 结论

本研究通过分析2~90 m反射率空间序列的 分类精度,采用回归拟合得到多光谱遥感分类的最佳空间分辨率在5 m,并分析了分类精度随空间分辨率变化的变化趋势,研究结果发现在该序列内20~30 m范围是分类精度变化最显著的区域,这对多光谱遥感分类空间分辨率的选择提供了有力参考。同时,分析了2 m和8 m空间分辨率下纹理特征的加入对不同地类分类精度的影响。通过对比 4种典型地类分类精度发现,纹理特征的加入对不同空间分辨率、不同地类分类精度的影响不同,且在8 m空间分辨率下的各地类的分类精度提高程度大于2 m分辨率的。结果表明,可以结合光谱信息及纹理特征,针对不同地物类型通过对空间分辨率的优选提高分类精度。
今后将尺度序列的范围及研究区范围进一步扩大,探究粗空间分辨率遥感分类的规律。同时,纹理特征对不同分辨率下的分类精度影响不同,究竟分辨率为多少时最佳还需要进一步研究。另外,针对植被类型,不同生长期的数据对其有一定程度的影响,不同物候期,植被纹理特征不同,与其他地类的区分度也不同,纹理特征在不同物候期对植被分类的影响程度也需要进一步研究。

The authors have declared that no competing interests exist.

[1]
Cihlar J.Land cover mapping of large areas from satellites: status and research priorities[J]. International Journal of Remote Sensing, 2000,21(6-7):1093-1114.Although land cover mapping is one of the earliest applications of remote sensing technology, routine mapping over large areas has only relatively recently come under consideration. This change has resulted from new information requirements as well as from new developments in remote sensing science and technology. In the near future, new data types will become available that will enable marked progress to be made in land cover mapping over large areas at a range of spatial resolutions. This paper is concerned with mapping strategies based on ''coarse'' and ''fine'' resolution satellite data as well as their combinations. The status of land cover mapping is discussed in relation to requirements, data sources and analysis methodologies - including pixel or scene compositing, radiometric corrections, classification and accuracy assessment. The overview sets the stage for identifying research priorities in data pre-processing and classification in relation to forthcoming improvements in data sources as well as new requirements for land cover information.

DOI

[2]
Lv Z, He H, Benediktsson J A, et al.H. A generalized image scene decomposition-based system for supervised classification of very high resolution remote sensing imagery[J]. Remote Sensing, 2016,8(10):814.Very high resolution (VHR) remote sensing images are widely used for land cover classification. However, to the best of our knowledge, few approaches have been shown to improve classification accuracies through image scene decomposition. In this paper, a simple yet powerful observational scene scale decomposition (OSSD)-based system is proposed for the classification of VHR images. Different from the traditional methods, the OSSD-based system aims to improve the classification performance by decomposing the complexity of an image content. First, an image scene is divided into sub-image blocks through segmentation to decompose the image content. Subsequently, each sub-image block is classified respectively, or each block is processed firstly through an image filter or spectral patial feature extraction method, and then each processed segment is taken as the feature input of a classifier. Finally, classified sub-maps are fused together for accuracy evaluation. The effectiveness of our proposed approach was investigated through experiments performed on different images with different supervised classifiers, namely, support vector machine, k-nearest neighbor, naive Bayes classifier, and maximum likelihood classifier. Compared with the accuracy achieved without OSSD processing, the accuracy of each classifier improved significantly, and our proposed approach shows outstanding performance in terms of classification accuracy.

DOI

[3]
Marceau D J, Hay G J.Remote sensing contribution to the scale issue[J]. Canadian Journal of Remote Sensing, 2000,25(4):357-366.Au cours de la derni01¨re d0108cennie, le probl01¨me d''0108chelle a attir0108 l''attention d''un nombre croissant de chercheurs de diverses disciplines. Il a 0108t0108 fortement sugg0108r0108 qu''une science de l''0108chelle soit 0108tablie. Alors qu''il est largement reconnu que la t0108l0108d0108tection peut apporter une contribution significative au probl01¨me d''0108chelle, tr01¨s peu d''0108tudes ont 0108t0108 men0108es dans le but de synth0108tiser le travail d0108j0102 accompli et sugg0108rer de futures directions de recherche. Cet article propose un cadre conceptuel 0102 travers lequel les principales contributions de la t0108l0108d0108tection au probl01¨me d''0108chelle sont revues. Les donn0108es de t0108l0108d0108tection sont pr0108sent0108es comme un cas particulier du probl01¨me des unit0108s spatiales modifiables. Il est ensuite d0108crit comment les solutions propos0108es au probl01¨me des unit0108s spatiales modifiables ont 0108t0108 et peuvent 0109tre appliqu0108es dans le contexte de la t0108l0108d0108tection afin d''investiguer les diff0108rentes composantes du probl01¨me d''0108chelle. Finalement, le r0107le important de la t0108l0108d0108tection dans le d0108veloppement d''une science de l''0108chelle est soulign0108.

DOI

[4]
Hsieh P F, Lee L C, Chen N Y.Effect of spatial resolution on classification errors of pure and mixed pixels in remote sensing[J]. IEEE Transactions on Geoscience and Remote Sensing, 2001,39(12):2657-2663.It is observed in remote sensing that a finer spatial resolution does not necessarily improve the classification performance. These observations have been understood by using the conceptual explanation that "boundary effect" and "within-class variability" work against one another. Though easily understood, this conceptual explanation cannot be readily used for a quantitative investigation. The authors design a simulation scheme to evaluate systematically the impacts of various parameters on the classification accuracy. The authors employ a model for the class spectral covariance of pure pixels and a linear mixing model for the spectral responses of mixed pixels. Based on these models, the authors derive the statistical characteristics for mixed pixels and assess the corresponding classification errors. As the ratio of ground sampling distance to field size decreases, the classification error associated with pure pixels tends to increase, whereas the classification error associated with mixed pixels tends to decrease from the smaller area of mixed pixels. The simulation results show that the overall classification error first decreases with decreasing ratio of ground sampling distance to field width, reaches a minimum value, and then may increase with further decreasing ratio. The study on the classification error may help the development of classification schemes for high spatial resolution imagery

DOI

[5]
Chen D, Stow D A, Gong P.Examining the effect of spatial resolution and texture window size on classification accuracy: An urban environment case[J]. International Journal of Remote Sensing, 2004,25(11):2177-2192.The purpose of this paper is to evaluate spatial resolution effects on image classification. Classification maps were generated with a maximum likelihood (ML) classifier applied to three multi-spectral bands and variance texture images. A total of eight urban land use/cover classes were obtained at six spatial resolution levels based on a series of aggregated Colour Infrared Digital Orthophoto Quarter Quadrangle (DOQQ) subsets in urban and rural fringe areas of the San Diego metropolitan area. The classification results were compared using overall and individual classification accuracies. Classification accuracies were shown to be influenced by image spatial resolution, window size used in texture extraction and differences in spatial structure within and between categories. The more heterogeneous are the land use/cover units and the more fragmented are the landscapes, the finer the resolution required. Texture was more effective for improving the classification accuracy of land use classes at finer resolution levels. For spectrally homogeneous classes, a small window is preferable. But for spectrally heterogeneous classes, a large window size is required.

DOI

[6]
明冬萍,王群,杨建宇.遥感影像空间尺度特性与最佳空间分辨率选择[J].遥感学报,2008,12(4):529-537.尺度概念是理解地球系统复杂性的关键,尺度问题被认为是对地观测的主要挑战之一,而结合具体研究应用领域,由地学现象的尺度本身出发,选择所需遥感影像的最佳尺度和分辨率,是非常有现实意义的.本文在深入剖析了遥感影像的尺度特性和遥感影像尺度选择的意义的基础上,探讨了基于地统计学方法定量选择遥感影像最佳空间分辨率的方法.阐明了传统局部方差方法不能得到理想结果的原因:传统的局部方差方法的实质是基于变化地面面积计算影像局部方差的均值,而基于这样不同甚至是相差悬殊的地面面积进行局部方差计算,其结果必然不具有可比性.对此,本文提出了基于可变窗口与可变分辨率的改进局部方差方法,即依次降低空间分辨率时,高分辨率采用大窗口尺寸,低分辨率采用小窗口尺寸来维持计算窗口内的地面面积的一致,由此计算出的局部方差作比较来判定遥感影像最佳分辨率.进行了系列实验分析,得到了相关结论,分析得出这种基于地统计的方法来选择遥感影像最佳分辨率的方法,对遥感和GIS研究与地学应用具有一定的理论意义和指导意义.

DOI

[ Ming D P, Wang Q, Yang J Y.The characteristics of spatial scale of remote sensing images and the selection of optimal spatial resolution[J]. Journal of Remote Sensing, 2008,12(4):529-537. ]

[7]
韩鹏,龚健雅.遥感尺度选择问题研究进展[J].遥感信息,2008(1):96-99.

[ Han P, Gong J Y.A review on the choice of optimal scale in remote sensing[J]. Remote Sensing Information, 2008(1):96-99. ]

[8]
陈春雷,武刚.多源遥感影像的最优尺度选择[J].浙江农林大学学报,2011,28(1):164-72.遥感信息普遍存在着尺度效应,合适的空间分辨率可以反映特定目标的空间结构特性。基于地理学第一规律,选择了目前主要采用的2种方法——局部变异和变异函数对最优尺度的选择进行研究,并针对传统方法的局限性提出了改进方案。通过同一地区的遥感卫星Landsat 7,Spot-5/HRG和QuickBird遥感影像,对不同的景观区域采用不同的方法进行了比较研究。根据实验,得出了局部变异适合微观、变异函数则更适用于宏观问题的结论,并得到了不同数据源在不同景观类型下的最优尺度。最后,根据最优尺度选择的结果,讨论了不同数据源的适用性。 图4表4 参19

DOI

[ Chen C L, Wu G.The selection of optimal scale for multi-source remote sensing images[J]. Journal of Zhejiang A & F University, 2011,28(1):164-72. ]

[9]
Shaban M A, Dikshit O.Improvement of classification in urban areas by the use of textural features: the case study of Lucknow City, Uttar Pradesh[J]. International Journal of Remote Sensing, 2001,22(4):565-593.Investigations have been carried out for digital spectral and textural classification of an Indian urban environment using SPOT images with grey level co-occurrence matrix (GLCM), grey level difference histogram (GLDH), and sum and difference histogram (SADH) approaches. The results indicate that a combination of texture and spectral features significantly improves the classification accuracy compared with classification with pure spectral features only. This improvement is about 9% and 17% for an addition of one and two texture features, respectively. GLDH and SADH give statistically similar results to GLCM, and take less computing time than GLCM. Conventional separability measures like transformed divergence, Bhattacharya distance, etc. are not effective in feature selection when classification is carried out with spectral and texture features. An alternative approach using simple statistics such as average coefficient of variation, skewness, and kurtosis and correlation amongst feature sets has shown greater feature selection potential when a combination of spectral and texture features is used.

DOI

[10]
卫春阳,徐丹丹,董凯凯,等.遥感影像空间格局变异函数分析研究进展[J].地球信息科学学报,2017,19(4):540-548.随着多光谱传感器的广泛运用,利用地物光谱响应特征提取地表信息的技术日益成熟,但是由于地表状况的复杂性和光谱响应的局限性,光谱方法在指示平均大小、空间异向性、空间分布、空间异质性等格局信息方面存在不足,因此挖掘遥感影像的空间格局特征日益受到研究者的重视。已有研究发现,变异参数与地表场景参数存在一定的对应关系,通过变异参数可以实现地表场景参数的提取,因此变异函数分析方法被广泛应用于真实遥感影像格局分析中,具体包括平均尺度提取、周期性格局探测、空间异质性表征与空间异向性描述等地表格局参数量化方面、最佳尺度选择与影像纹理分析等遥感影像信息提取方面。尽管变异函数分析方法在上述应用领域中都发挥了重要作用,但是当前利用变异函数进行遥感影像空间格局分析大多局限于定性描述层面,缺乏精确化的量化描述与分析,限制了变异函数分析方法应用的进一步拓展,究其原因在于对遥感影像格局变异函数分析的内在机制缺乏深入了解。本文回顾了近20年来变异函数分析方法在遥感格局分析领域的主要应用,并对该方法本身的优势和存在的不足进行了总结,可为变异函数这一工具在遥感影像格局分析方面的有效应用提供参考。

[ Wei C Y, Xu D D, Dong K K, et al.Advances in the analysis of the pattern of remote sensing images based on semi-variogram[J]. Journal of Geo-information Science, 2017,19(4):540-548. ]

[11]
Yan L, Roy D P.Conterminous United States crop field size quantification from multi-temporal Landsat data[J]. Remote Sensing of Environment, 2016,172:67-8661First-ever quantitative CONUS crop field size map and histogram61CONUS-wide object extraction from Landsat time series61Over 4.1 million crop fields were extracted automatically.61Validated using pixel and object based accuracy metrics

DOI

[12]
Bartholome E, Belward A S.GLC2000: A new approach to global land cover mapping from Earth observation data[J]. International Journal of Remote Sensing, 2005,26(9):1959-1977.A new global land cover database for the year 2000 (GLC2000) has been produced by an international partnership of 30 research groups coordinated by the European Commission's Joint Research Centre. The database contains two levels of land cover information—detailed, regionally optimized land cover legends for each continent and a less thematically detailed global legend that harmonizes regional legends into one consistent product. The land cover maps are all based on daily data from the VEGETATION sensor on‐board SPOT 4, though mapping of some regions involved use of data from other Earth observing sensors to resolve specific issues. Detailed legend definition, image classification and map quality assurance were carried out region by region. The global product was made through aggregation of these. The database is designed to serve users from science programmes, policy makers, environmental convention secretariats, non‐governmental organizations and development‐aid projects. The regional and global data are available free of charge for all non‐commercial applications from http://www.gvm.jrc.it/glc2000.

DOI

[13]
Khatami R, Mountrakis G, Stehman S V.A meta-analysis of remote sensing research on supervised pixel-based land-cover image classification processes: General guidelines for practitioners and future research[J]. Remote Sensing of Environment, 2016,177:89-100.Classification of remotely sensed imagery for land-cover mapping purposes has attracted significant attention from researchers and practitioners. Numerous studies conducted over several decades have investigated a broad array of input data and classification methods. However, this vast assemblage of research results has not been synthesized to provide coherent guidance on the relative performance of different classification processes for generating land cover products. To address this problem, we completed a statistical meta-analysis of the past 15 years of research on supervised per-pixel image classification published in five high-impact remote sensing journals. The two general factors evaluated were classification algorithms and input data manipulation as these are factors that can be controlled by analysts to improve classification accuracy. The meta-analysis revealed that inclusion of texture information yielded the greatest improvement in overall accuracy of land-cover classification with an average increase of 12.1%. This increase in accuracy can be attributed to the additional spatial context information provided by including texture. Inclusion of ancillary data, multi-angle and time images also provided significant improvement in classification overall accuracy, with 8.5%, 8.0%, and 6.9% of average improvements, respectively. In contrast, other manipulation of spectral information such as index creation (e.g. Normalized Difference Vegetation Index) and feature extraction (e.g. Principal Components Analysis) offered much smaller improvements in accuracy. In terms of classification algorithms, support vector machines achieved the greatest accuracy, followed by neural network methods. The random forest classifier performed considerably better than the traditional decision tree classifier. Maximum likelihood classifiers, often used as benchmarking algorithms, offered low accuracy. Our findings will help guide practitioners to decide which classification to implement and also provide direction to researchers regarding comparative studies that will further solidify our understanding of different classification processes. However, these general guidelines do not preclude an analyst from incorporating personal preferences or considering specific algorithmic benefits that may be pertinent to a particular application.

DOI

[14]
Foody G M, Mathur A.A relative evaluation of multiclass image classification by support vector machines[J]. IEEE Transactions on Geoscience and Remote Sensing, 2004,42(6):1335-1343.Support vector machines (SVM) have considerable potential as classifiers of remotely sensed data. A constraint on their application in remote sensing has been their binary nature, requiring multi-class classifications to be based upon a large number of binary analyses. Here, an approach for multi-class classification of airborne sensor data by a single SVM analysis is evaluated against a series of classifiers that are widely used in remote sensing, with particular regard to the effect of training set size on classification accuracy. In addition to the SVM, the same data sets were classified using a discriminant analysis, decision tree and multilayer perceptron neural network. The accuracy statements of the classifications derived from the different classifiers were compared in a statistically rigorous fashion that accommodated for the related nature of the samples used in the analyses. For each classification technique, accuracy was positively related with the size of the training set. In general, the most accurate classifications were derived from the SVM approach, and with the largest training set the SVM classification was significantly (p<0.05) more accurate (93.75%) than that derived from the discriminant analysis (90.00%) and decision tree algorithms (90.31%). Although each classifier could yield a very accurate classification, >90% correct, the classifiers differed in the ability to correctly label individual cases and so may be suitable candidates for an ensemble based approach to classification.

DOI

[15]
Ren J, Chen Z, Zhou Q, et al.Regional yield estimation for winter wheat with MODIS-NDVI data in Shandong, China[J]. International Journal of Application Earth Observation, 2008,10(4):403-413.The significance of crop yield estimation is well known in agricultural management and policy development at regional and national levels. The primary objective of this study was to test the suitability of the method, depending on predicted crop production, to estimate crop yield with a MODIS-NDVI-based model on a regional scale. In this paper, MODIS-NDVI data, with a 25002m resolution, was used to estimate the winter wheat ( Triticum aestivum L.) yield in one of the main winter-wheat-growing regions. Our study region is located in Jining, Shandong Province. In order to improve the quality of remote sensing data and the accuracy of yield prediction, especially to eliminate the cloud-contaminated data and abnormal data in the MODIS-NDVI series, the Savitzky–Golay filter was applied to smooth the 10-day NDVI data. The spatial accumulation of NDVI at the county level was used to test its relationship with winter wheat production in the study area. A linear regressive relationship between the spatial accumulation of NDVI and the production of winter wheat was established using a stepwise regression method. The average yield was derived from predicted production divided by the growing acreage of winter wheat on a county level. Finally, the results were validated by the ground survey data, and the errors were compared with the errors of agro-climate models. The results showed that the relative errors of the predicted yield using MODIS-NDVI are between 614.62% and 5.40% and that whole RMSE was 214.1602kg02ha 611 lower than the RMSE (233.3502kg02ha 611 ) of agro-climate models in this study region. A good predicted yield data of winter wheat could be got about 40 days ahead of harvest time, i.e. at the booting-heading stage of winter wheat. The method suggested in this paper was good for predicting regional winter wheat production and yield estimation.

DOI

[16]
Yang Y J, Zhan Y L, Tian Q J, et al.Crop classification based on GF-1/WFV NDVI time series[J]. Transactions of the Chinese Society of Agricultural Engineering, 2015,31(24):155-161.NDVI (Normalized Difference Vegetation Index) time series has been widely used in collecting vegetation information, while most of the present researches about NDVI time series are limited to moderate or low resolution remote sensing images, which affect the accuracy of vegetation information extraction. With the successful launch of the first satellite GF-1 of China High-resolution Earth Observation System, more opportunities have emerged for the construction of NDVI time series with high temporal and high spatial resolution. In this paper, we attempted to build 16 m resolution NDVI time series using images with wide field of view of GF-1 satellite. Different crops have different NDVI time sequence curves during the whole growth period. However, it should be noted that the same crop has a relatively stable growth process and pattern in the same area, which is the basis for the crop classification by using the time series data. While crop phenological characteristics vary largely during a growing cycle, they vary relatively smaller in the different growing cycles. Adopting data containing a complete crop growth cycle can contribute to the extraction of crop phenological information in the construction of NDVI time series. Furthermore, it can avoid the shortage of using data in a calendar year (January to December) to build NDVI time series. In order to carry out studies on crop classification based on GF-1/WFV NDVI time series data, Tangshan, which is located in Hebei Province, China, was chosen as the study area. Through the analysis of NDVI time series curves of samples, we can draw that NDVI time series was able to clearly distinguish crop phenological differences, capture the growth of crop specific features, and identify crop planting patterns in the study area. Irrigation period had the salient features different from that of upland crops before planting paddy rice, which formed the obvious differences compared with other crops. As far as winter wheat was concerned, its NDVI peak was the unique features different from others in overwintering stage. In addition, by analyzing NDVI time series curves in the study area, crop planting patterns can be summarized as follows: winter wheat and summer corn belonged to the planting patterns of two seasons a year, while the rice or peanuts was in a year planting patterns. Based on GF-1/WFV NDVI time series, maximum likelihood method, Mahalanobis distance, minimum distance, neural network, SVM classification methods were used to classify crop in the study area. The results demonstrated that SVM had the best classification accuracies compared to other classification methods, and its overall classification accuracy reached 96.33%. This research showed that GF-1/WFV NDVI with high resolution can be used for crop classification, and can be applied to large area crop classification of remote sensing due to the characteristics of wide coverage. Furthermore, the Harmonic Analysis of Time Series (HANTS) method was used for NDVI time series smoothing, and the results indicated that the processed NDVI time series can better represent different crop phenological characteristics. Then SVM method was used for classifying crop based on smoothed NDVI time series, and the overall classification accuracy was up to 97.57%, which was superior to the one based on the unsmoothed data. The study opens a new era for the domestic high resolution data on agricultural monitoring, and provides insightful reference for the study on the time series of remote sensing classification research.

DOI

[17]
Li X, Ling F, Du Y, et al.A spatial-temporal hopfield neural network approach for super-resolution land cover mapping with multi-temporal different resolution remotely sensed images[J]. ISPRS Journal of Photogrammetry and remote Sensing, 2014,93:76-87.The mixed pixel problem affects the extraction of land cover information from remotely sensed images. Super-resolution mapping (SRM) can produce land cover maps with a finer spatial resolution than the remotely sensed images, and reduce the mixed pixel problem to some extent. Traditional SRMs solely adopt a single coarse-resolution image as input. Uncertainty always exists in resultant fine-resolution land cover maps, due to the lack of information about detailed land cover spatial patterns. The development of remote sensing technology has enabled the storage of a great amount of fine spatial resolution remotely sensed images. These data can provide fine-resolution land cover spatial information and are promising in reducing the SRM uncertainty. This paper presents a spatial emporal Hopfield neural network (STHNN) based SRM, by employing both a current coarse-resolution image and a previous fine-resolution land cover map as input. STHNN considers the spatial information, as well as the temporal information of sub-pixel pairs by distinguishing the unchanged, decreased and increased land cover fractions in each coarse-resolution pixel, and uses different rules in labeling these sub-pixels. The proposed STHNN method was tested using synthetic images with different class fraction errors and real Landsat images, by comparing with pixel-based classification method and several popular SRM methods including pixel-swapping algorithm, Hopfield neural network based method and sub-pixel land cover change mapping method. Results show that STHNN outperforms pixel-based classification method, pixel-swapping algorithm and Hopfield neural network based model in most cases. The weight parameters of different STHNN spatial constraints, temporal constraints and fraction constraint have important functions in the STHNN performance. The heterogeneity degree of the previous map and the fraction images errors affect the STHNN accuracy, and can be served as guidances of selecting the optimal STHNN weight parameters.

DOI

[18]
Dash J, Jeganathan C, Atkinson PM.The use of MERIS terrestrial chlorophyll index to study spatio-temporal variation in vegetation phenology over India[J]. Remote Sensing of Environment, 2010,114(7):1388-402.India has a diverse set of vegetation types ranging from tropical evergreen to dry deciduous. The phenology of these natural vegetation types is often controlled by climatic condition. Estimating phenological variables will help in understanding the response of tropical and subtropical vegetation to climate change. The study investigated the annual and inter-annual variation in vegetation phenology in India using satellite remote sensing. The study used time-series data of the only available satellite measured index of terrestrial chlorophyll content (MERIS Terrestrial Chlorophyll Index) from 2003 to 2007 at 4.6 km spatial resolution. A strong coincidence was observed with expected phenological pattern, in particular, in inter-annual and latitudinal variability of key phenological variables. For major natural vegetation type the onset of greenness had greater latitudinal variation compared to the end of senescence and there was a small or no leafless period. In the 2003 04 growing season a late start for the onset of greenness was detected at low-to-mid latitudes and it was attributed to the extreme cold weather during the early part of 2003. The length of growing season varied from east to west for the major cropping areas in the Indo-Gangetic plain, for both the first and second crops. For the first time, this study attempted to establish a broad regional phenological pattern for India using remotely sensed estimation of canopy chlorophyll content using five years of data. The overall patterns of phenological variables detected from this study broadly coincide with the pattern of natural vegetation phenology revealed in earlier community level studies. The results of this study suggest the need for an organised network combining ground and space observation which is at presently missing in India.

DOI

[19]
Yang Y J, Huang Y, Tian Q J, et al.The extraction model of paddy rice information based on GF-1 satellite WFV images[J]. Spectroscopy and Spectral Analysis, 2015,35(11):3255-3261.In the present,using the characteristics of paddy rice at different phenophase to identify it by remote sensing images is an efficient way in the information extraction.According to the remarkably properties of paddy rice different from other vegetation,which the surface of paddy fields is with a large number of water in the early stage,NDWI(normalized difference water index)which is used to extract water information can reasonably be applied in the extraction of paddy rice at the early stage of the growth.And using NDWI ratio of two phenophase can expand the difference between paddy rice and other surface features,which is an important part for the extraction of paddy rice with high accuracy.Then using the variation of NDVI(normalized differential vegetation index)in different phenophase can further enhance accuracy of paddy rice information extraction.This study finds that making full advantage of the particularity of paddy rice in different phenophase and combining two indices(NDWI and NDVI)associated with paddy rice can establish a reasonable,accurate and effective extraction model of paddy rice.This is also the main way to improve the accuracy of paddy rice extraction.The present paper takes Lai'an in Anhui Province as the research area,and rice as the research object.It constructs the extraction model of paddy rice information using NDVI and NDWI between tillering stage and heading stage.Then the model was applied to GF1-WFV remote sensing image on July 12,2013 and August 30,2013.And it effectively extracted out of paddy rice distribution in Lai'an and carried on the mapping.At last,the result of extraction was verified and evaluated combined with field investigation data in the study area.The result shows that using the extraction model can quickly and accurately obtain the distribution of rice information,and it has the very good universality.

DOI PMID

[20]
Vivone G, Alparone L, Chanussot J, et al.A critical comparison among pan sharpening algorithms[J]. IEEE Transactions on Geoscience and Remote Sensing, 2014,53(5):2565-2586In this paper state-of-the-art and advanced methods for multispectral pansharpening are reviewed and evaluated on two very high resolution datasets acquired by IKONOS-2 (four bands) and WorldView-2 (eight bands). The experimental analysis allows us to highlight the performances of the two main pansharpening approaches (i.e. component substitution and multiresolution analysis).

DOI

[21]
Dalponte M, Bruzzone L, Gianelle D.Tree species classification in the Southern Alps based on the fusion of very high geometrical resolution multispectral/ hyperspectral images and LiDAR data[J]. Remote Sensing of Environment, 2012,123:258-270.78 Hyperspectral data allow one to distinguish similar species. 78 Downscaling the spectral resolution reduces the discrimination ability of the data. 78 Multispectral data are effective for macro-classes discrimination. 78 The addition of LiDAR data increase the classification accuracy. 78 High point density LiDAR data allow higher class accuracy than low point density data.

DOI

[22]
张周威,余涛,孟庆岩,等.空间重采样方法对遥感影像信息影响研究[J].华中师范大学学报(自科版),2013,47(3):426-430.在对原始影像进行几何校正时需要对影像进行重采样,必然会导致光谱信息的失真,如何保持原始影像的光谱信息一直是研究的热点问题.从影像应用质量评价的角度,对3种不同类型的遥感影像质量进行了评价与分析,通过对多幅不同空间分辨率的遥感影像重采样后进行比较,评价了重采样后遥感影像的质量.研究表明,影像重采样后的信息量随着空间分辨率的提高基本保持不变,随着空间分辨率的降低,信息量也逐步减少的结论,为评价遥感影像重采样后影像信息量损失情况的多尺度效应提供参考.

DOI

[ Zhang Z W, Yu T, Meng Q Y, et al.Research on the effects of spatial resampling method on the information of remote sensing images[J]. Journal of Huazhong Normal University (Nat. Sci.), 2013,47(3):426-430. ]

[23]
Fardin M, Hassan G.Improving hyperspectral image classification by combining spectral, texture, and shape features[J]. International Journal of Remote Sensing, 2015,36(4):1070-1096.Several studies have already demonstrated the efficiency of utilizing spatial information in representation and interpretation of hyperspectral (HS) images. Texture and shape features are known as two important categories of spatial information in various applications of image processing. This study tries to utilize texture and shape features extracted from HS images, as well as spectral information, in order to reduce overall classification errors. These features include morphological profiles (MPs), global Gabor features, and features extracted from conventional and segmentation-based grey-level co-occurrence matrices (GLCMs). Various combinations of these spatial features along with spectral information are fed into a support vector machine (SVM) classifier, and the best combinations for different situations are determined. Experiments on the widely used Indian Pines, Pavia University, and Salinas HS data sets demonstrate the efficiency of the proposed framework in comparison with some recent spectral鈥搒patial classification methods.

DOI

[24]
Kiema J B K. Texture analysis and data fusion in the extraction of topographic objects from satellite imagery[J]. International Journal of Remote Sensing, 2002,23(4):767-776.This paper examines the influence of multisensor data fusion on the automatic extraction of topographic objects from SPOT panchromatic imagery. The suitability of various grey level co-occurrence based texture measures, as well as different pixel windows is also investigated. It is observed that best results are obtained with a 3 2 3 pixel window and the texture measure homogeneity. The synthetic texture image derived together with a Landsat Thematic Mapper (TM) imagery are then fused to the SPOT data using the additional channel concept. The object feature base is expanded to include both spectral and spatial features. A maximum likelihood classification approach is then applied. It is demonstrated that the segmentation of topographic objects is significantly improved by fusing the multispectral and texture information.

DOI

[25]
Dash M, Liu H.Feature selection for classification[J]. Intelligent Data Analysis: An International Journal, 1997,1(1-4):131-156.

DOI

[26]
Vanniel T G, Mcvicar T R, Datt B.On the relationship between training sample size and data dimensionality of broadband multi-temporal classification[J]. Remote Sensing of Environment, 2005,98(4):468-480.The number of training samples per class ( n ) required for accurate Maximum Likelihood (ML) classification is known to be affected by the number of bands ( p ) in the input image. However, the general rule which defines that n should be 10 p to 30 p is often enforced universally in remote sensing without questioning its relevance to the complexity of the specific discrimination problem. Furthermore, identifying this many training samples is often problematic when many classes and/or many bands are used. It is important, then, to test how this generally accepted rule matches common remote sensing discrimination problems because it could be unnecessarily restrictive for many applications. This study was primarily conducted in order to test whether the general rule defining the relationship between n and p was well-suited for ML classification of a relatively simple remote sensing-based discrimination problem. To summarise the mean response of n -to- p for our study site, a Monte Carlo procedure was used to randomly stack various numbers of bands into thousands of separate image combinations that were then classified using an ML algorithm. The bands were randomly selected from a 119-band Enhanced Thematic Mapper-plus (ETM+) dataset comprised of 17 images acquired during the 2001–2002 southern hemisphere summer agricultural growing season over an irrigation area in south-eastern Australia. Results showed that the number of training samples needed for accurate ML classification was much lower than the current widely accepted rule. Due to the asymptotic nature of the relationship, we found that 95% of the accuracy attained using n02= 0230 p samples could be achieved by using approximately 2 p to 4 p samples, or ≤02102/027th the currently recommended value of n . Our findings show that the number of training samples needed for a simple discrimination problem is much less than that defined by the general rule and therefore the rule should not be universally enforced; the number of training samples needed should also be determined by considering the complexity of the discrimination problem.

DOI

[27]
Foody G M, Mathur A, Sanchez-Hernandez C, et al.Training set size requirements for the classification of a specific class[J]. Remote Sensing of Environment, 2006,104(1):1-14.The design of the training stage of a supervised classification should account for the properties of the classifier to be used. Consideration of the way the classifier operates may enable the training stage to be designed in a manner which ensures that the aim of the classification is satisfied with the use of a small, inexpensive, training set. It may, therefore, be possible to reduce the training set size requirements from that generally expected with the use of standard heuristics. Substantial reductions in training set size may be possible if interest is focused on a single class. This is illustrated for mapping cotton in north-western India by support vector machine type classifiers. Four approaches to reducing training set size were used: intelligent selection of the most informative training samples, selective class exclusion, acceptance of imprecise descriptions for spectrally distinct classes and the adoption of a one-class classifier. All four approaches were able to reduce the training set size required considerably below that suggested by conventional widely used heuristics without significant impact on the accuracy with which the class of interest was classified. For example, reductions in training set size of 65 90% from that suggested by a conventional heuristic are reported with the accuracy of cotton classification remaining nearly constant at 65 95% and 65 97% from the user's and producer's perspectives respectively.

DOI

[28]
Wang C Y, Liu Z J, Yan C Y.An experimental study on imaging spectrometer data feature selection and wheat type identification[J]. Journal of Remote Sensing, 2006,10(2):249-254.With the development of imaging spectrometer technology,the ground objects' consecutive information from it makes it possible to identify different vegetation types,though some relevant research was carried out in the past few years,most are about forestry,yet few about crops.Further,there exist strong correlation between bands of imaging spectrometer,so how to reduce as much as possible the redundant information and reserve useful information appear much more important.This paper first did feature selection based on genetic algorithm(GA) and wheat biophysical characteristics.In feature selection using GA,for the training samples,when combined bands reach 4,the JM distance of optimal combination reach much high level,when bands go on increasing,the average JM distance increases slowly until when bands reach 8,the distance does not increase further,so the optimal bands combination can be obtained.In feature selection using wheat biophysical characteristics,we found that there appear strong correlative bands for wheat protein and dry gluten with spectra,so the sensitive bands can be obtained.Combining these two feature selection steps,the ultimate optimal bands combination was given.After feature selection,we use the selected bands and classifier Fuzzy-Artmap to classify the imaging spectrometer data.It showed that for 4 wheat types,they can be identified clearly,the average classification accuracy is above 90%.

DOI

[29]
齐腊,刘良云,赵春江,等.基于遥感影像时间序列的冬小麦种植监测最佳时相选择研究[J].遥感技术与应用,2008,23(2):154-160.lt;p>遥感影像植被分类的最佳时相对作物种植面积遥感监测非常重要。根据2005~2006年北京冬小麦不同物候期的Landsat TM影像和2006年Spot\|2影像,计算了各时期影像中主要植被类型的光谱可分性距离,分析了北京郊区主要植被物候差异和光谱可分性;对各生育期的遥感影像及其主要组合进行了监督分类,采用总体精度和分类效率指标两个参数,结合地面GPS调查数据,对分类结果进行了精度评价。结果表明:北京地区小麦监测最佳时相是4月上旬,影像分类的总体精度为92.9%,明显优于其它单时相影像的分类结果;发现北京郊区冬小麦光谱分类的最佳时相组合为4月上旬(起身期)和5月下旬(灌浆期),分类总体精度为94%。</p>

DOI

[ Qi L, Liu L Y, Zhao C J.Study on optimum time selection of the monitoring of winter wheat planting based on the time series of remote sensing images[J]. Remote Sensing Technology Application, 2008,23(2):154-160. ]

[30]
Islam A E, Tanton T W.Improvements in land use mapping for irrigated agriculture from satellite sensor data using a multi-stage maximum likelihood classification[J]. International Journal of Remote Sensing, 2003,24(21):4197-4206.

DOI

[31]
Hao P, Zhan Y L, Wang L, et al.Feature selection of time series MODIS data for early crop classification using random forest: A case study in Kansas, USA[J]. Remote Sensing, 2015,7(5):5347.Currently, accurate information on crop area coverage is vital for food security and industry, and there is strong demand for timely crop mapping. In this study, we used MODIS time series data to investigate the effect of the time series length on crop mapping. Eight time series with different lengths (ranging from one month to eight months) were tested. For each time series, we first used the Random Forest (RF) algorithm to calculate the importance score for all features (including multi-spectral data, Normalized Difference Vegetation Index (NDVI), Normalized Difference Water Index (NDWI), and phenological metrics). Subsequently, an extension of the Jeffries atusita (JM) distance was used to measure class separability for each time series. Finally, the RF algorithm was used to classify crop types, and the classification accuracy and certainty were used to analyze the influence of the time series length and the number of features on classification performance; the features were added one by one based on their importance scores. Results indicated that when the time series was longer than five months, the top ten features remained stable. These features were mainly in July and August. In addition, the NDVI features contributed the majority of the most significant features for crop mapping. The NDWI and data from multi-spectral bands also contributed to improving crop mapping. On the other hand, separability, classification accuracy, and certainty increased with the number of features used and the time series length, although these values quickly reached saturation. Five months was the optimal time series length, as longer time series provided no further improvement in the classification performance. This result shows that relatively short time series have the potential to identify crops accurately, which allows for early crop mapping over large areas.

DOI

[32]
Kumar P, Gupta D K, Mishra V N, et al.Comparison of support vector machine, artificial neural network, and spectral angle mapper algorithms for crop classification using LISS IV data[J]. International Journal of Remote Sensing, 2015,36(6):1604-1617.The Resourcesat-2 is a highly suitable satellite for crop classification studies with its improved features and capabilities. Data from one of its sensors, the linear imaging and self-scanning (LISS IV), which has a spatial resolution of 5.8 m, was used to compare the relative accuracies achieved by support vector machine (SVM), artificial neural network (ANN), and spectral angle mapper (SAM) algorithms for the classification of various crops and non-crop covering a part of Varanasi district, Uttar Pradesh, India. The separability analysis was performed using a transformed divergence (TD) method between categories to assess the quality of training samples. The outcome of the present study indicates better performance of SVM and ANN algorithms in comparison to SAM for the classification using LISS IV sensor data. The overall accuracies obtained by SVM and ANN were 93.45% and 92.32%, respectively, whereas the lower accuracy of 74.99% was achieved using the SAM algorithm through error matrix analysis. Results derived from SVM, ANN, and SAM classification algorithms were validated with the ground truth information acquired by the field visit on the same day of satellite data acquisition.

DOI

[33]
Verma N K, Lamb D W, Reid N, et al.A comparative study of land cover classification techniques for “farms capes” using very high resolution remotely sensed data[J]. Photogrammetry Engineering and Remote Sensing, 2014,80(5):461-470.ABSTRACT High spatial resolution images (~10 cm) are routinely available from airborne platforms. Few studies have examined the applicability of using such data to characterize land cover in “farmscapes” comprising open pasture and remnant vegetation communities of varying density. Very high spatial resolution remotely sensed imagery has been used to classify land cover classes on a ~5000 ha extensive grazing farm in Australia. This “farmscape” consisted of open pasture fields, scattered trees, and remnant vegetation (woodlands). The relative performances of object-based and pixel-based approaches to classification were tested for accuracy and applicability. Maximum likelihood classification (MLC) was used for pixel-based classification while the k-nearest neighbor (k-NN) technique was used for object-based classification. A range of image sampling scales was tested for image segmentation. At an optimal sampling scale, the pixel-based classification resulted in an overall accuracy of 77 percent, while the object-based classification achieved an overall accuracy of 86 percent. While both the object- and pixel-based classification techniques yielded higher quantitative accuracies, a “more realistic” land cover classification, with few errors due to intermixing of similar classes, was achieved using the object-based method.

DOI

[34]
Chen J, Deng M, Xiao P F, et al.Optimal spatial scale choosing for high resolution imagery based on texture features frequency analysis[J]. Journal of Remote Sensing, 2011,15(3):492-511.

[35]
Qiu B, Luo Y, Tang Z, et al.Winter wheat mapping combining variations before and after estimated heading dates[J]. ISPRS Journal of Photogrammetry and remote sensing, 2017,123:35-46.Accurate and updated information on winter wheat distribution is vital for food security. The intra-class variability of the temporal profiles of vegetation indices presents substantial challenges to current time series-based approaches. This study developed a new method to identify winter wheat over large regions through a transformation and metric-based approach. First, the trend surfaces were established to identify key phenological parameters of winter wheat based on altitude and latitude with references to crop calendar data from the agro-meteorological stations. Second, two phenology-based indicators were developed based on the EVI2 differences between estimated heading and seedling/harvesting dates and the change amplitudes. These two phenology-based indicators revealed variations during the estimated early and late growth stages. Finally, winter wheat data were extracted based on these two metrics. The winter wheat mapping method was applied to China based on the 250 m 8-day composite Moderate Resolution Imaging Spectroradiometer (MODIS) 2-band Enhanced Vegetation Index (EVI2) time series datasets. Accuracy was validated with field survey data, agricultural census data, and Landsat-interpreted results in test regions. When evaluated with 653 field survey sites and Landsat image interpreted data, the overall accuracy of MODIS-derived images in 2012 2013 was 92.19% and 88.86%, respectively. The MODIS-derived winter wheat areas accounted for over 82% of the variability at the municipal level when compared with agricultural census data. The winter wheat mapping method developed in this study demonstrates great adaptability to intra-class variability of the vegetation temporal profiles and has great potential for further applications to broader regions and other types of agricultural crop mapping.

DOI

Outlines

/