
Journal of Geo-information Science >
The Expressive Methods and Visual Patterns of Geo-informatic Graphic for Zoning Knowledge
Received date: 2017-08-11
Request revised date: 2017-11-30
Online published: 2018-03-02
Supported by
Special Fund for Basic Project of Science and Technology, No.2013FY112800
Copyright
Geographical regionalization is a traditional and important content of geographical research. Geographers have carried out research on the dominant factors, characteristics of various geographical regions and the relationship of constraints and dependencies among these geographic elements over the years, accumulating a wealth of procedural knowledge as well as producing a large number of geographical regionalization plans. Some of them are multi-angle, multi-time and serialized. Map visualization is an effective tool and information carrier for expressing the zoning knowledge. However, the current research has always focused on the theory, method and technology of regional division and seldom pay attention to the combination of zoning knowledge and visualization method. In the process of compiling the national zoning atlas (the new century edition), we sorted out academic papers, monographs, reports and atlas related to zoning and found that most of the zoning knowledge existed in the form of text. Visualization is only used to represent the partitioned results. The combination of zoning knowledge and visualization theory and method is very weak, and the visualization expressive content is limited as well as the form of visualization, which is not enough to reflect the profound knowledge connotation and association of geographical zoning. It leads to the lack of zoning knowledge utilization. It hinders the knowledge acquisition in the zoning map. The cartography of new period has changed gradually from the presentation of the data to the expression of knowledge and guide the reader to find out rules which can also show the depth of scientific research to promote the re-use of knowledge. This article starts from making a cognition for prior knowledge of geographical zoning, and establishes the expressive content system of the knowledge of geographical zoning. Then, we study the visualization expressive method for the different knowledge of zoning maps, and discuss visual method of the comprehensive multi-dimensional zoning knowledge based on geo-informatic graphic. Finally, we use a visual case study, which shows that this paper provides an efficient strategy for knowledge representation and discovery, and it can be a further support for research decision-making of various regional factors.
Key words: zoning; visualization; geo-informatic graphic; knowledge representation
LI Daichao , WANG Yingjie , QI Junhui , ZHANG Shengrui , FANG Lei , WANG Yinyin , ZHANG Tongyan . The Expressive Methods and Visual Patterns of Geo-informatic Graphic for Zoning Knowledge[J]. Journal of Geo-information Science, 2018 , 20(2) : 147 -158 . DOI: 10.12082/dqxxkx.2018.170380
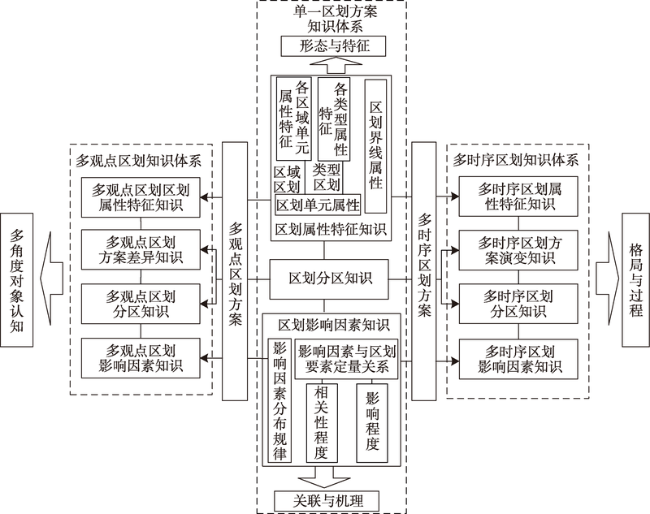
Fig. 1 The content system of map presentations of geographic-zoning knowledge图1 区划知识的地图表达内容体系 |
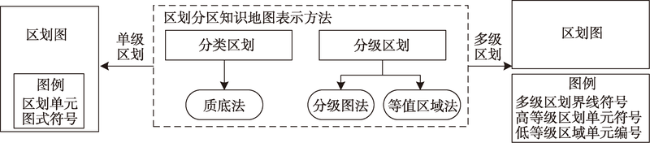
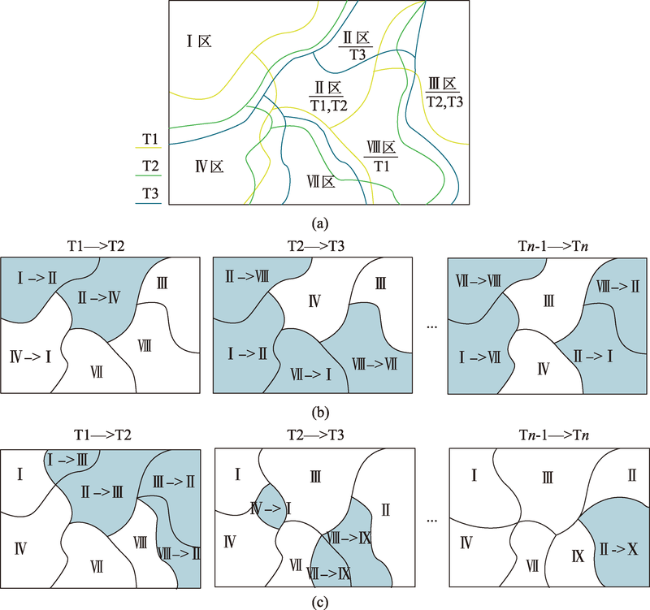
Fig. 2 Visualization on the knowledge of regionalism图2 区划分区知识的可视化表达方法 |
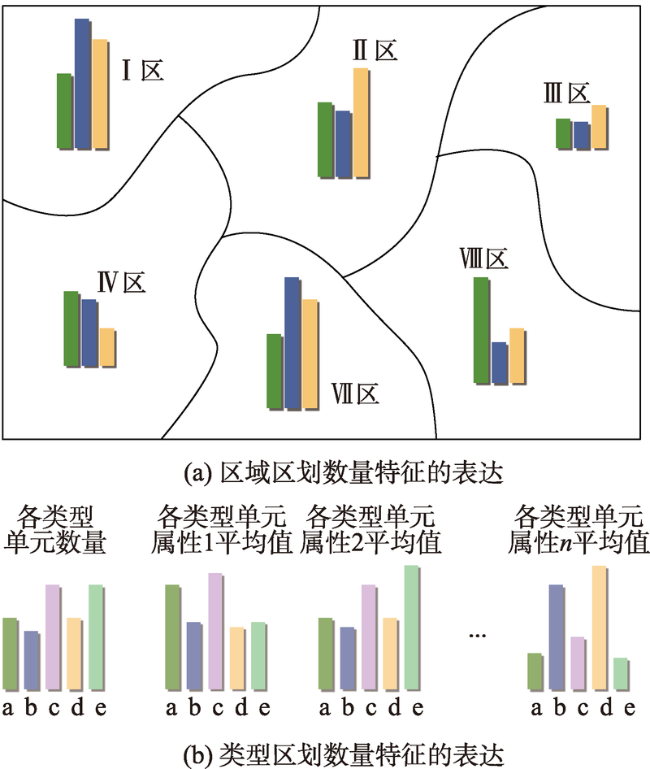
Fig. 3 Visualization on the knowledge of quantitative attributive of zoning图3 区划数量特征知识的可视化表达方法 |
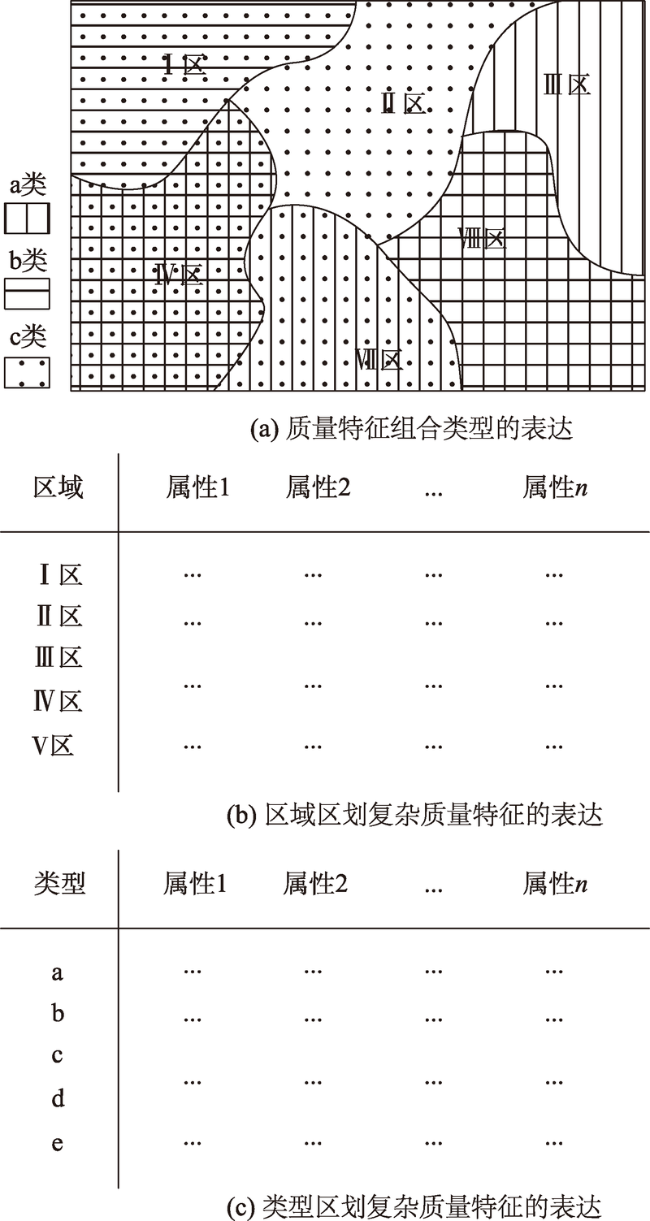
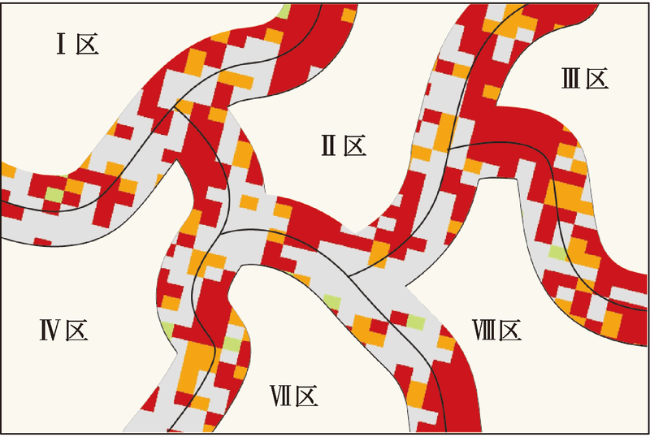
Fig. 4 Visualization on the knowledge of quality attributive of zoning图4 区划质量特征知识的可视化表达方法 |
Fig. 5 Visualization on the knowledge of attributive characteristics of regional boundary line图 5 区划界线属性特征知识的可视化表达方法 |
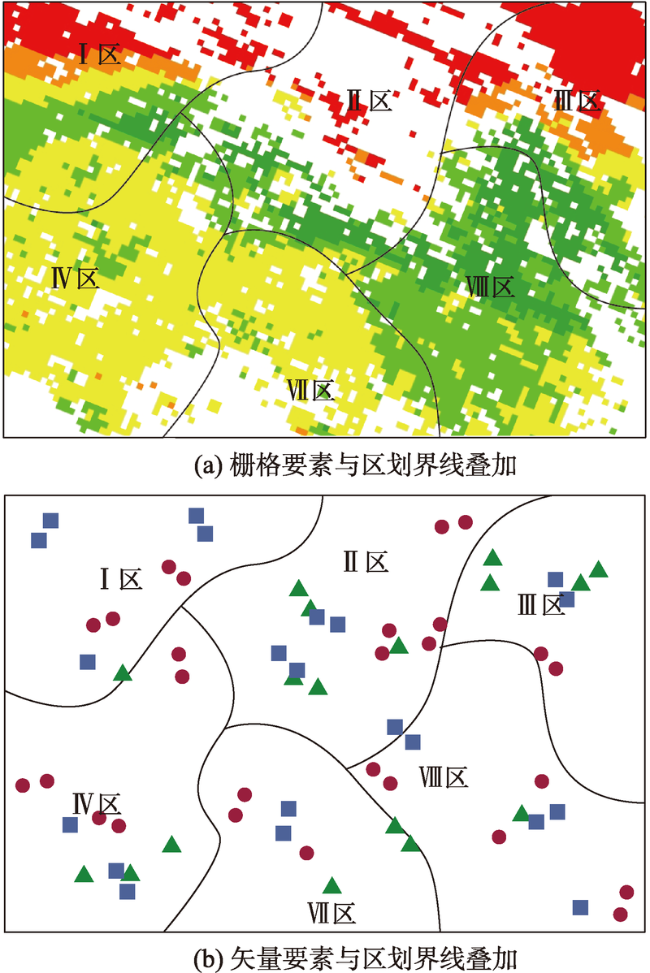
Fig. 6 Visualization on the spatial distribution knowledge of regional related factors图6 区划影响因素的空间分布知识的可视化表达方法 |
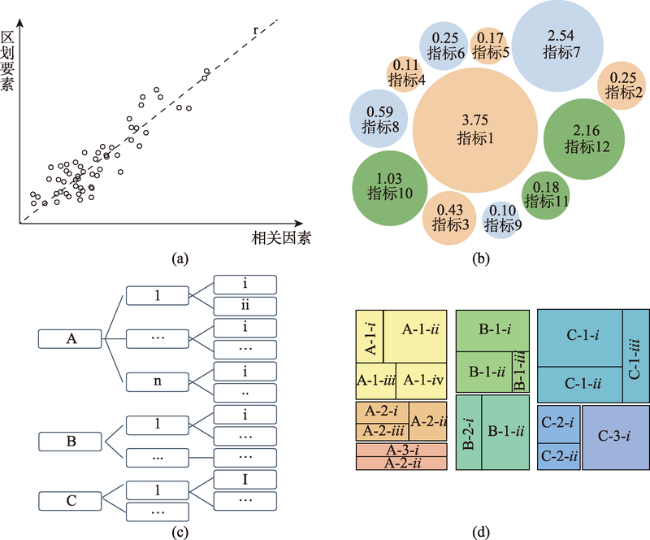
Fig. 7 Visualization on the quantitative relation knowledge of regional elements and its relevant factors图7 区划影响因素与区划要素的定量化关系可视化表达方法 |
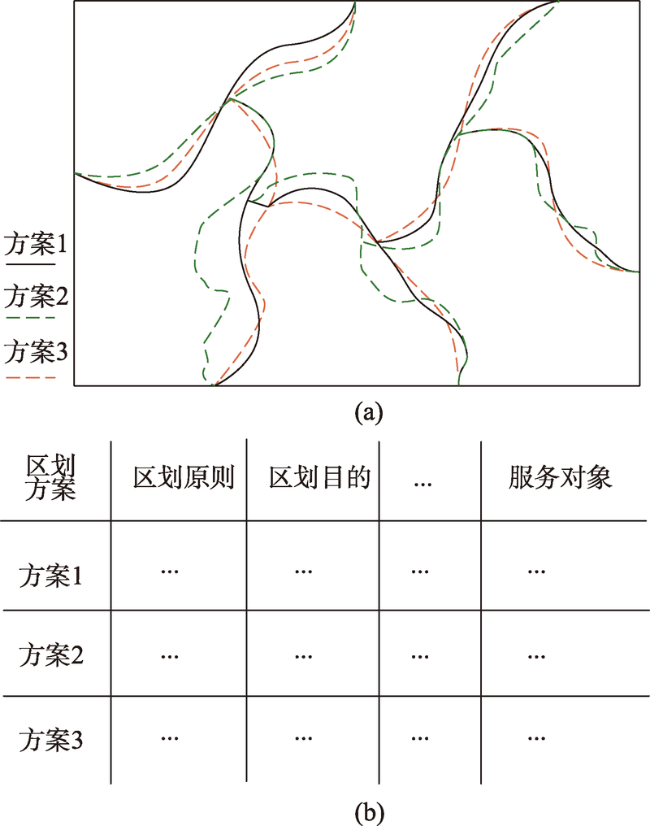
Fig. 8 Visualization on the knowledge of the difference of zoning views图 8 多观点区划方案差异知识的可视化表达方法 |
Fig. 9 Visualization on the knowledge of the differences of multi-sequential zonings图 9 多时序区划方案差异知识的可视化表达范式 |
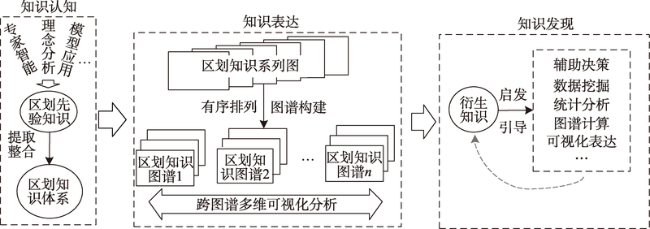
Fig. 10 Discovery mechanisms of visualization knowledge of geographic zoning图10 区划的可视化知识发现机制 |
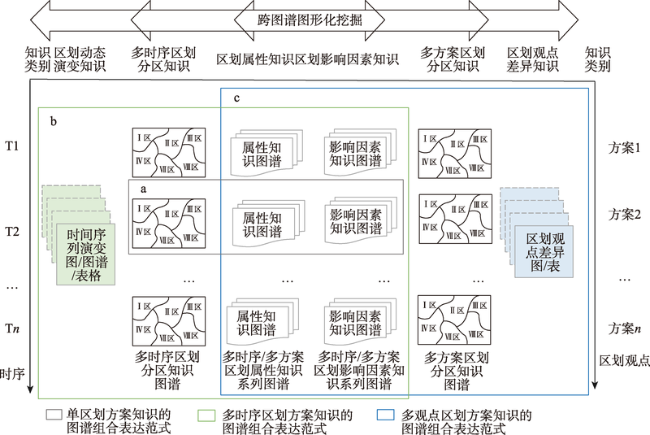
Fig. 11 Visual patterns of zoning knowledge based on geo-informatic graphic图11 区划知识的图谱组合表达范式 |
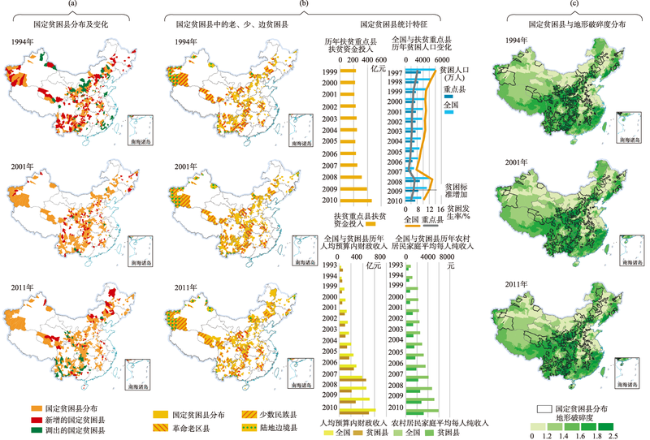
Fig. 12 Visualization of multi-sequential national-level poor county zoning knowledge based on geo-informatic graphic图12 多时序国定贫困县类型区划知识地图组合表达范式与知识发现 |
The authors have declared that no competing interests exist.
| [1] |
[
|
| [2] |
[
|
| [3] |
[
|
| [4] |
[
|
| [5] |
[
|
| [6] |
[
|
| [7] |
[
|
| [8] |
[
|
| [9] |
[
|
| [10] |
[
|
| [11] |
[
|
| [12] |
[
|
| [13] |
[
|
| [14] |
[
|
| [15] |
[
|
| [16] |
[
|
| [17] |
[
|
| [18] |
[
|
| [19] |
[
|
| [20] |
[
|
| [21] |
[
|
| [22] |
[
|
| [23] |
[
|
| [24] |
|
| [25] |
[
|
| [26] |
[
|
| [27] |
[
|
| [28] |
[
|
/
| 〈 |
|
〉 |