
Journal of Geo-information Science >
Spatiotemporal Distribution and Variation Trend of Evapotranspiration in Ili River Valley
Received date: 2017-03-15
Request revised date: 2017-07-19
Online published: 2018-03-02
Supported by
National Natural Science Foundation of China, No.U1703341, 41764003, 41461006
Copyright
Evapotranspiration (ET) plays an important role in the hydrological processes as it can substantially influence the amount and spatial distribution of water resources at regional scale. Quantitative estimation of spatiotemporal distribution and variation of surface ET is essential for understanding the hydrological cycle and water resources management. In this paper, the spatiotemporal characteristics and variation trend of ET and PET(Potential Evapotranspiration) are studied using MOD16 data during 2000-2014 in the"Wet Island of Tianshan Mountain"—Ili River valley, Xinjiang, China. The results showed that: (1) the accuracy of the MOD16-ET in Ili River valley can meet the requirements, and can be used to study the spatiotemporal distribution of surface ET; (2) the mean annual ET and PET were 392.35 and 1331.19 mm respectively, and ET/PET ratio fluctuates between 0.26 and 0.33. The low ratio of ET/PET indicates that the study area was affected by water deficit. The seasonal variation of ET and PET were a unimodal pattern in the growing season. ET/PET ratio was 0.29 in autumn, and the study area suffered drought in this period. Temperature was the main factor influencing the spatiotemporal distribution of ET and PET; (3) the spatial distribution of ET and PET are opposite. The upstream area of Kashgar river and Künes river in the south had sufficient water supply, while the Yining city, the area of Khorgos river, Qapqal County and the downstream area of Tekkas river suffered from drought and water shortage;(4) During 2000-2014, ET decreased, and PET increased, which showed that the drought in Ili River valley was aggravated in the past 15 years.
Key words: MOD16; ET; PET; spatiotemporal distribution; variation trend; Ili River valley
ADILAI Wufu , YUSUFUJIANG Rusuli , REYILAI Kadeer , JIANG Hong . Spatiotemporal Distribution and Variation Trend of Evapotranspiration in Ili River Valley[J]. Journal of Geo-information Science, 2018 , 20(2) : 217 -227 . DOI: 10.12082/dqxxkx.2018.170102
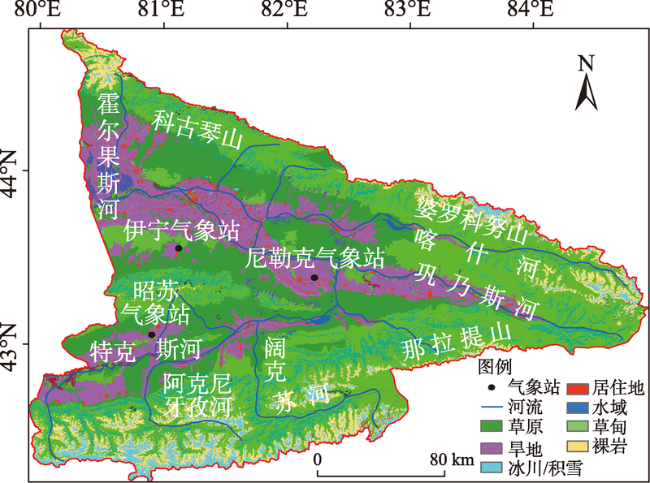
Fig. 1 The spatial distribution of land use/cover and meteorological station of the study area图1 研究区土地利用/覆被和气象观测站分布图 |
Tab. 1 The Basic information of meteorological observation station表1 气象观测站基本信息 |
| 站点 | 覆被类型 | 经度/E | 纬度/N | 海拔高度/m |
|---|---|---|---|---|
| 伊宁 | 旱地,草原 | 81°20′ | 43°57′ | 662.5 |
| 尼勒克 | 旱地,草原 | 82°34′ | 43°48′ | 1105.1 |
| 昭苏 | 旱地,草甸草原 | 81°08′ | 43°09′ | 1851.0 |
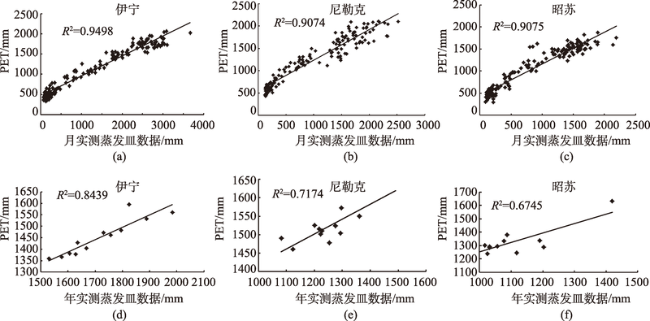
Fig. 2 Relationship between MOD16 PET product and annual-monthly ET from meteorological station图2 气象站年,月实测ET和MOD16-PET的关系 |
Tab. 2 The accuracy validation results of MOD16 PET product and annual-monthly ET from meteorological station表2 气象站年月实测ET和MOD16-PET数据精度验证结果 |
| 站点 | 相关系数(月) | 相关系数(年) | RMSE/mm | EA/% |
|---|---|---|---|---|
| 伊宁 | 0.95 | 0.84 | 275 | 84 |
| 尼勒克 | 0.91 | 0.72 | 277 | 78 |
| 昭苏 | 0.91 | 0.67 | 233 | 79 |
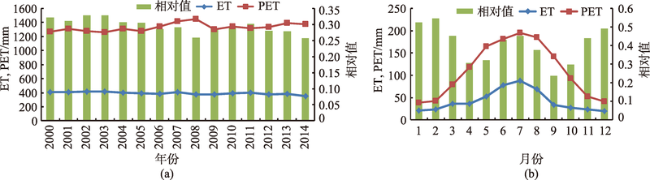
Fig. 3 Annual and monthly variation of ET and PET in Ili River valley from 2000 to 2014图3 2000-2014年伊犁河谷ET、PET不同年月变化 |
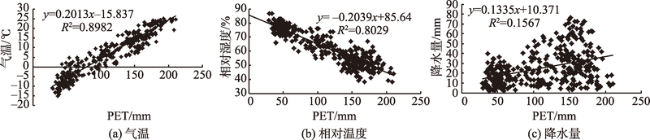
Fig. 4 The relationship between meteorological factors and MOD16-PET图4 主要气象因子与PET的关系 |
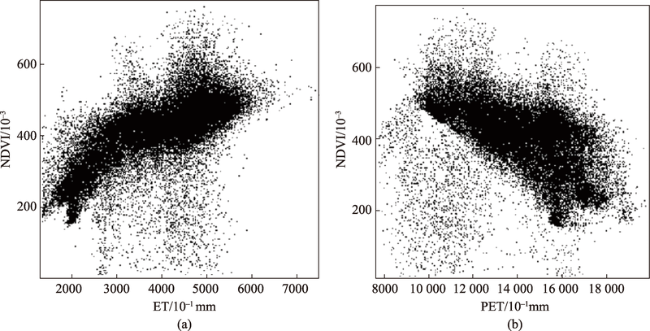
Fig. 5 The relationship between NDVI and ET, and between NDVI and PET, respectively图5 ET、PET与NVDI的关系 |
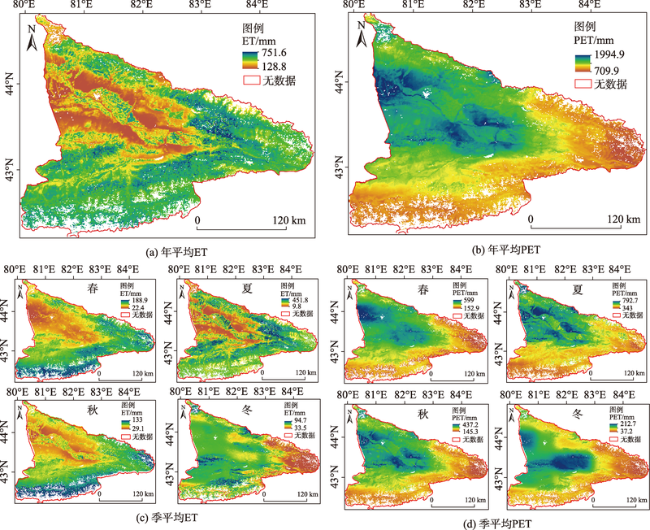
Fig. 6 The spatial distribution of annual and seasonal ET, PET in Ili River valley图6 伊犁河谷年与季节平均ET、PET空间分布 |
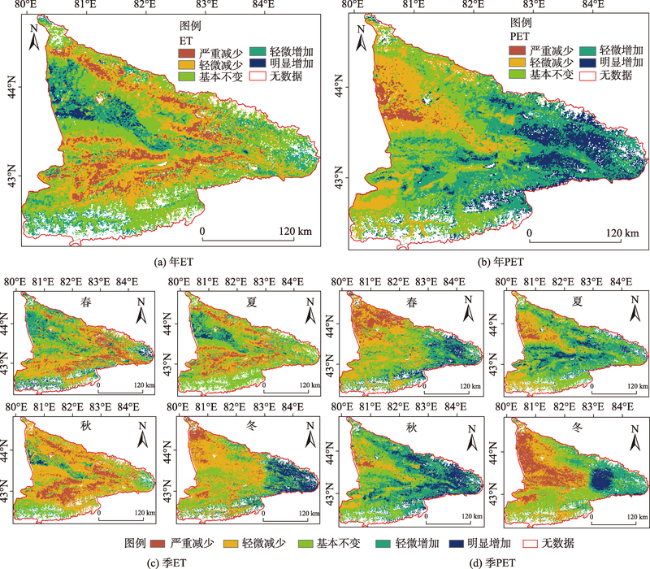
Fig. 7 The variation trend of annual and seasonal ET, PET in Ili River valley from 2000 to 2014图7 2000-2014年伊犁河谷多年与不同季节ET、PET变化趋势 |
The authors have declared that no competing interests exist.
| [1] |
[
|
| [2] |
|
| [3] |
[
|
| [4] |
[
|
| [5] |
|
| [6] |
|
| [7] |
|
| [8] |
|
| [9] |
|
| [10] |
[
|
| [11] |
[
|
| [12] |
[
|
| [13] |
|
| [14] |
|
| [15] |
[
|
| [16] |
[
|
| [17] |
[
|
| [18] |
[
|
| [19] |
[
|
| [20] |
[
|
| [21] |
[
|
| [22] |
[
|
| [23] |
[
|
| [24] |
[
|
| [25] |
[
|
| [26] |
[
|
| [27] |
[
|
| [28] |
|
| [29] |
|
| [30] |
[
|
| [31] |
|
| [32] |
|
/
| 〈 |
|
〉 |