
Journal of Geo-information Science >
Identification and Spatial Interaction of Urban Functional Regions in Beijing Based on the Characteristics of Residents' Traveling
Received date: 2017-11-11
Request revised date: 2018-01-17
Online published: 2018-03-20
Supported by
The Open Fund of National Key Laboratory of Virtual Reality Technology and Systems, No.01117220010020.
Copyright
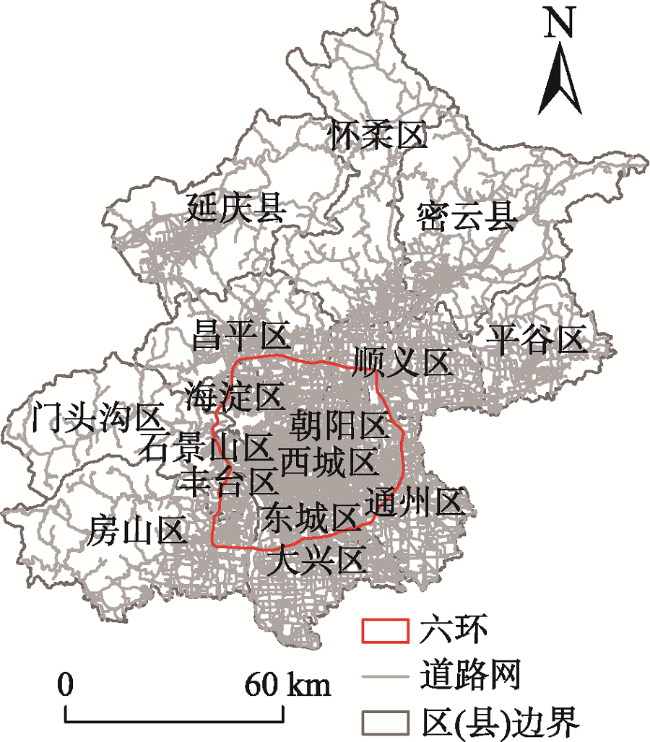
Affected by the differentiation of regional functions, the urban residents' activities presents specific timing characteristics. Different traveling patterns could indicate differences in regional functions. Meanwhile, the interactive features of regional function can be reflected by the spatial interaction activities of residents' trips. The advent of the big data era makes the individual geographical big data represented by the GPS data feasible to reflect residents' trip characteristics from the micro perspective. In this paper, the individual geographical big data and data mining method are employed to study the diversities and connections of urban regional functions under the perspective of residential perception. The study area enclosed by the Sixth Ring Road in Beijing is divided into regular grids, for the convenience of extracting timing characteristics of residential activities from 3 months' GPS data on taxis. Specifically, the cluster analysis based on expectation maximization algorithm, the point of interest and the daily traveling characteristics of residents are used to identify functional regions into six types, such as residential districts and commercial entertainment districts. Finally, the spatial interaction characteristics between functional areas are analyzed from two dimensions of distance and time, revealing that functional complementation weakens the influence of distance on the spatial interaction strength and the functional interaction indicates significant temporal differences.
CHEN Zedong , QIAO Bowen , ZHANG Jing . Identification and Spatial Interaction of Urban Functional Regions in Beijing Based on the Characteristics of Residents' Traveling[J]. Journal of Geo-information Science, 2018 , 20(3) : 291 -301 . DOI: 10.12082/dqxxkx.2018.170531
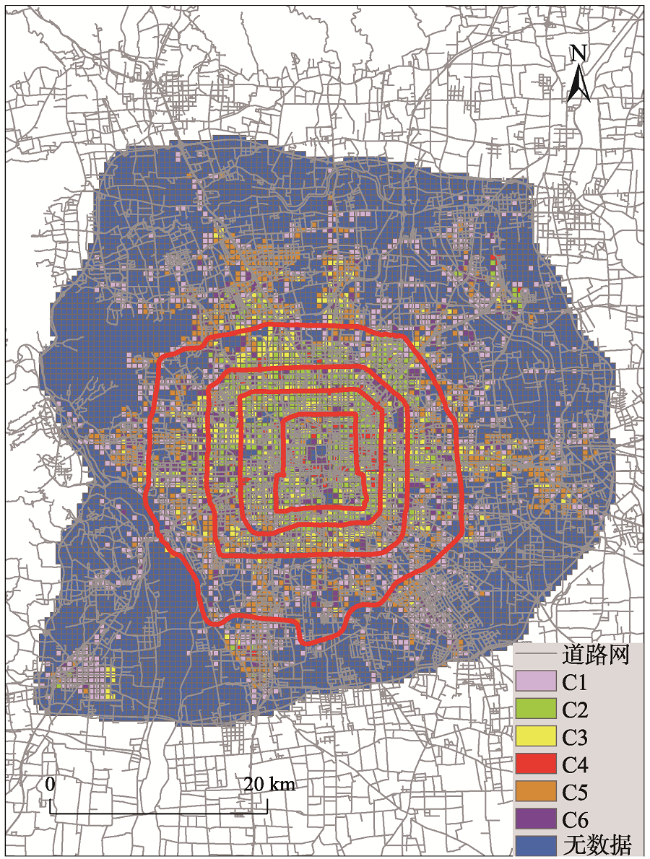
Fig. 1 Division results of urban land within the sixth ring road of Beijing图1 北京六环地块划分结果 |
Tab. 1 Pick-ups and drop-offs of taxi GPS表1 出租车GPS上下车点对序列 |
| 出租车 编号 | 出行 日期 | 上车点 时间 | 上车点 坐标 | 下车点 时间 | 下车点 坐标 |
|---|---|---|---|---|---|
| 111 | 2016-05-02 | 8:8:35 | 116.69 °E 39.85 °N | 8:22:21 | 116.67 °E 39.88 °N |
| 116 | 2016-05-03 | 6:56:21 | 115.97 °E 40.44 °N | 7:29:05 | 115.97 °E 40.45 °N |
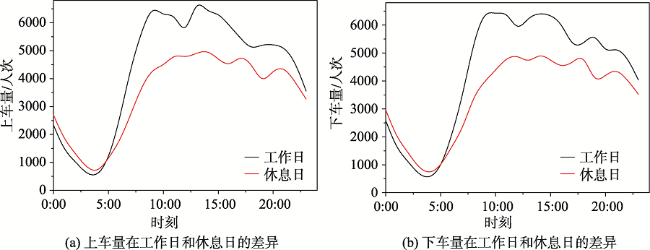
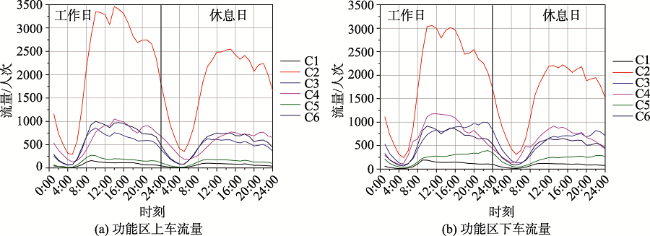
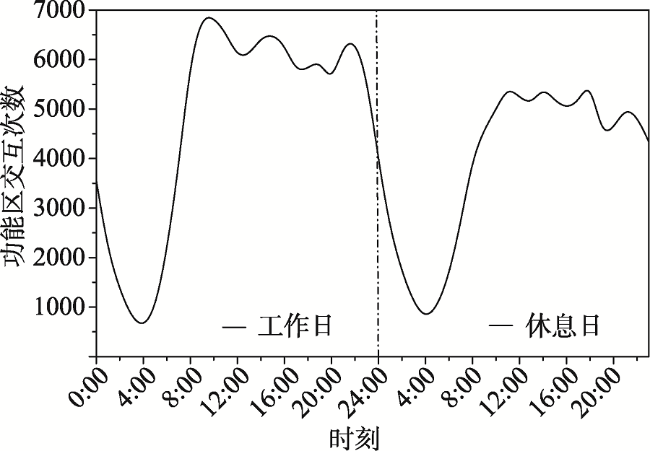
Fig. 2 The comparison of daily average amount of pick-ups and drop-offs between weekdays and weekends图2 工作日和休息日每时刻平均上下车数量对比 |
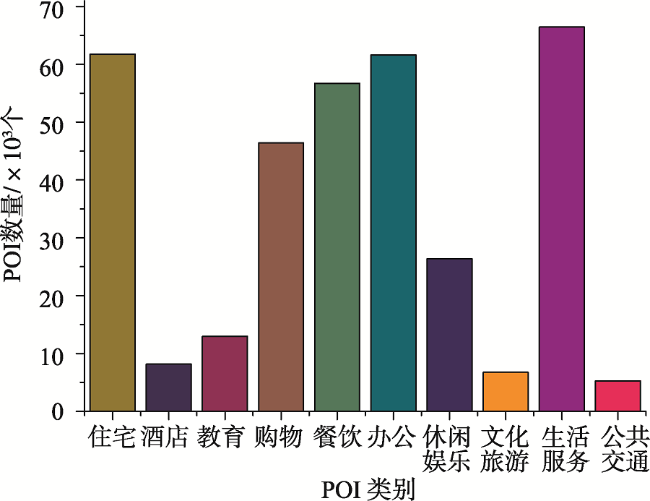
Fig. 3 Classification statistics of POIs within the sixth ring road of Beijing in 2016图3 2016年北京六环内兴趣点分类统计 |
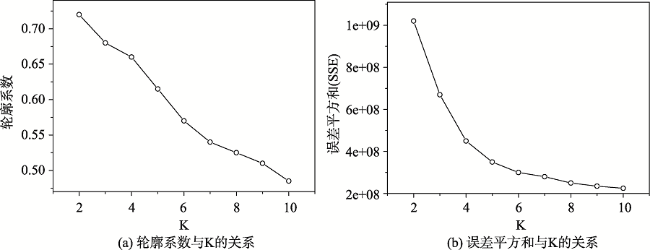
Fig. 4 The changes of Silhouette and SSE results with respect to different K values图4 轮廓系数和误差平方和与K的关系 |
Fig. 5 The results of parcel clustering图5 地块聚类结果 |
Tab. 2 POI exponential distribution of functional regions表2 功能区POI指数分布 |
| POI类别 | C1 | C2 | C3 | C4 | C5 | C6 | ||||||
|---|---|---|---|---|---|---|---|---|---|---|---|---|
| FDnor | FDP | FDnor | FDP | FDnor | FDP | FDnor | FDP | FDnor | FDP | FDnor | FDP | |
| 住宅 | 0.0000 | 0.00 | 0.8731 | 13.48 | 1.0000 | 22.32 | 0.4755 | 5.28 | 0.5479 | 32.49 | 0.3079 | 10.95 |
| 交通 | 0.0000 | 0.00 | 0.9231 | 14.25 | 0.2514 | 5.61 | 1.0000 | 11.07 | 0.1677 | 9.94 | 0.4402 | 15.65 |
| 办公 | 0.0000 | 0.00 | 0.7378 | 11.39 | 0.3532 | 7.88 | 1.0000 | 11.07 | 0.1050 | 6.22 | 0.3519 | 12.51 |
| 餐饮 | 0.0000 | 0.00 | 0.4702 | 7.26 | 0.2729 | 6.09 | 1.0000 | 11.07 | 0.1089 | 6.46 | 0.1461 | 5.20 |
| 酒店 | 0.0000 | 0.00 | 0.7792 | 12.03 | 0.4608 | 10.28 | 1.0000 | 11.07 | 0.1577 | 9.35 | 0.2488 | 8.85 |
| 教育 | 0.0000 | 0.00 | 0.7631 | 11.79 | 1.0000 | 22.32 | 0.5565 | 6.16 | 0.2359 | 13.99 | 0.3104 | 11.04 |
| 购物 | 0.0000 | 0.00 | 0.3473 | 5.36 | 0.1754 | 3.91 | 1.0000 | 11.07 | 0.0609 | 3.61 | 0.1281 | 4.56 |
| 生活服务 | 0.0000 | 0.00 | 0.5352 | 8.26 | 0.4275 | 9.54 | 1.0000 | 11.07 | 0.1690 | 10.02 | 0.1803 | 6.41 |
| 文化旅游 | 0.0000 | 0.00 | 0.6990 | 10.79 | 0.3230 | 7.21 | 1.0000 | 11.07 | 0.0537 | 3.18 | 0.5810 | 20.66 |
| 休闲娱乐 | 0.0000 | 0.00 | 0.3502 | 5.39 | 0.2165 | 4.84 | 1.0000 | 11.07 | 0.0800 | 4.74 | 0.1172 | 4.17 |
注:FDnor为频数密度;FDP为频数密度百分比/% |
Fig. 6 Residents travel flow of six functional areas between weekdays and weekends图6 工作日/休息日六种功能区居民出行流量 |
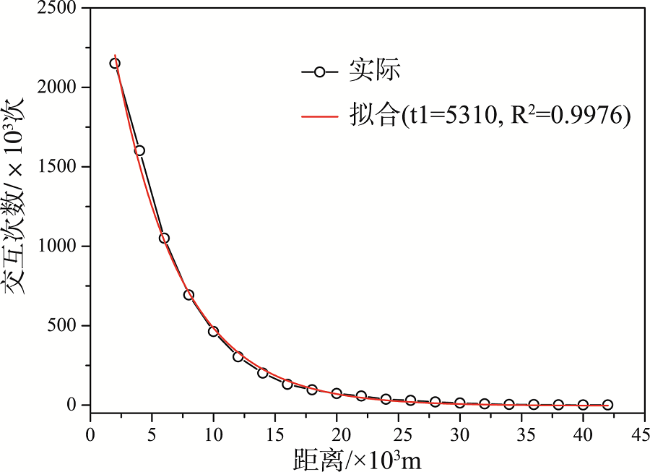
Fig. 7 Interaction strength with distance distribution of functional areas图7 功能区交互强度与距离分布 |
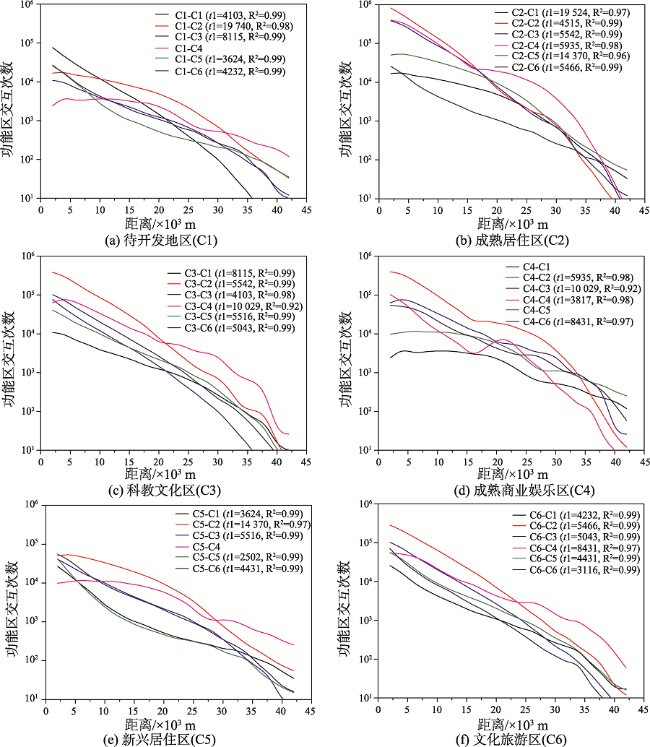
Fig. 8 Interaction strength with distance distribution between six functional areas图8 6种功能区之间交互强度与距离分布 |
Tab. 3 Time constants of distance attenuation fitting between six functional areas表3 6种功能区交互距离衰减时间常数 |
| C1 | C2 | C3 | C4 | C5 | C6 | |
|---|---|---|---|---|---|---|
| C1 | 4103 | 19 740 | 8115 | ∞ | 3624 | 4232 |
| C2 | 19 740 | 4518 | 5542 | 5935 | 14 370 | 5466 |
| C3 | 8115 | 5542 | 4103 | 10 029 | 5516 | 5043 |
| C4 | ∞ | 5936 | 10 029 | 3817 | ∞ | 8431 |
| C5 | 3624 | 14730 | 5516 | ∞ | 2502 | 4431 |
| C6 | 4232 | 5466 | 5043 | 8431 | 4431 | 3116 |
Fig. 9 Interaction strength with time distribution of functional areas图9 功能区交互强度与时间分布 |
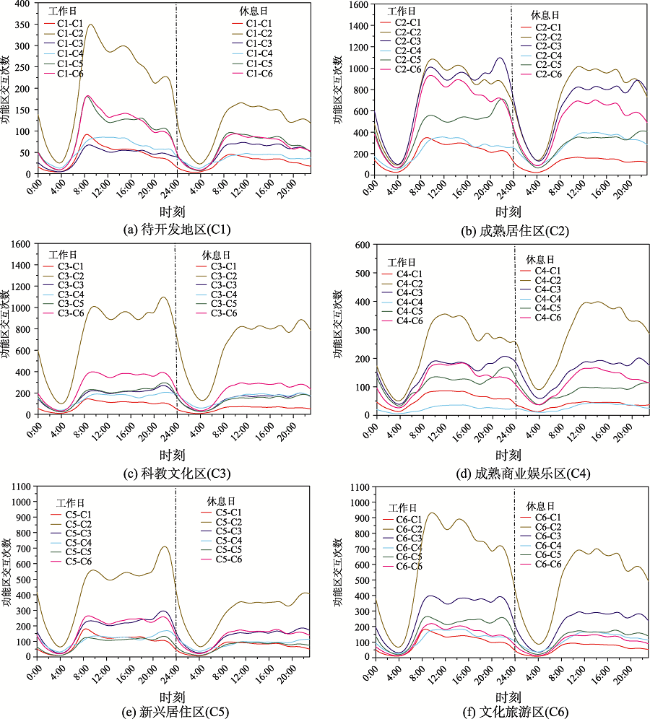
Fig. 10 Interaction strength with time distribution between six functional areas图10 6种功能区之间交互强度与时间分布 |
The authors have declared that no competing interests exist.
| [1] |
[
|
| [2] |
[
|
| [3] |
|
| [4] |
[
|
| [5] |
[
|
| [6] |
[
|
| [7] |
[
|
| [8] |
[
|
| [9] |
|
| [10] |
[
|
| [11] |
|
| [12] |
|
| [13] |
[
|
| [14] |
|
| [15] |
[
|
| [16] |
|
| [17] |
[
|
| [18] |
[
|
| [19] |
|
| [20] |
|
| [21] |
[
|
| [22] |
|
| [23] |
|
| [24] |
[
|
| [25] |
[
|
| [26] |
|
| [27] |
[
|
| [28] |
[Discovering zones of different functions using bus smart card data and points of interest: A case study of Beijing[D]. Hangzhou: Zhejiang University, 2014.]
|
| [29] |
|
| [30] |
|
| [31] |
[
|
/
| 〈 |
|
〉 |