
Journal of Geo-information Science >
Multi-index Analysis of Spatial Patterns of Urban Aerosol Optical Depth
Received date: 2017-12-04
Request revised date: 2017-12-26
Online published: 2018-03-20
Supported by
National Natural Science Foundation of China, No. 41371392, 71573242, 71273252.
Copyright
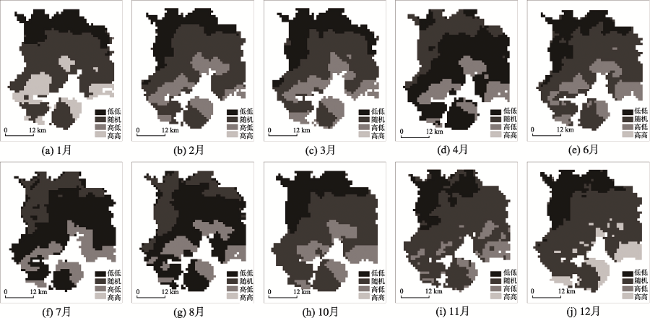
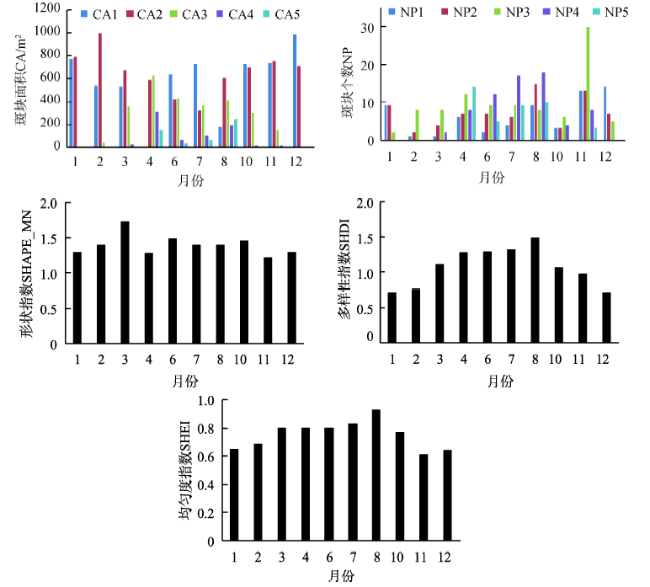
In this study, a time series of MODIS -Aqua images were used to retrieve the atmospheric aerosol optical depth (AOD) of Xiamen City. Then, the spatio-temporal variations of AOD in different months of the year 2014/2015 except May and September were analyzed in respect of quantity, spatial configuration and structure, respectively. The analysis was implemented by integrating multiple indexes related to spatial autocorrelation and landscape metrics. The results showed that distribution of AOD had obvious spatial and temporal variations in the study area. The low-AOD patches were dominant over forests, while middle/high-AOD patches were dominant over built-up areas. The AOD showed significant seasonal variations, which increased in spring and summer and decreased in autumn and winter. The spatial clustering pattern of AOD, characterized by the indexes related to spatial autocorrelation, showed that low-low (LL) clustering pattern was in the northern mountains of the mainland, while high-high (HH) and high-low (HL) clustering patterns were in the newly developed northeast urban area of Xiamen Island and the urban areas of the mainland satellite towns along the coast. In terms of landscape metrics, high-AOD patches increased from autumn and winter to spring and summer, accompanied by an increase of both complexity and heterogeneity of the landscape structure. It is a useful tool to unfold more thorough, detailed and comprehensive description of the characteristics of AOD variation by using the multi-index analysis. Results of this study can help to assess the impact of aerosol on environment and climate, and provide decisions supporting for the sustainable development of cities.
ZHAO Xiaofeng , LIU Jiahui , ZHAO Yanchuang , WANG Feifei , Li Guilin . Multi-index Analysis of Spatial Patterns of Urban Aerosol Optical Depth[J]. Journal of Geo-information Science, 2018 , 20(3) : 360 -367 . DOI: 10.12082/dqxxkx.2018.170588
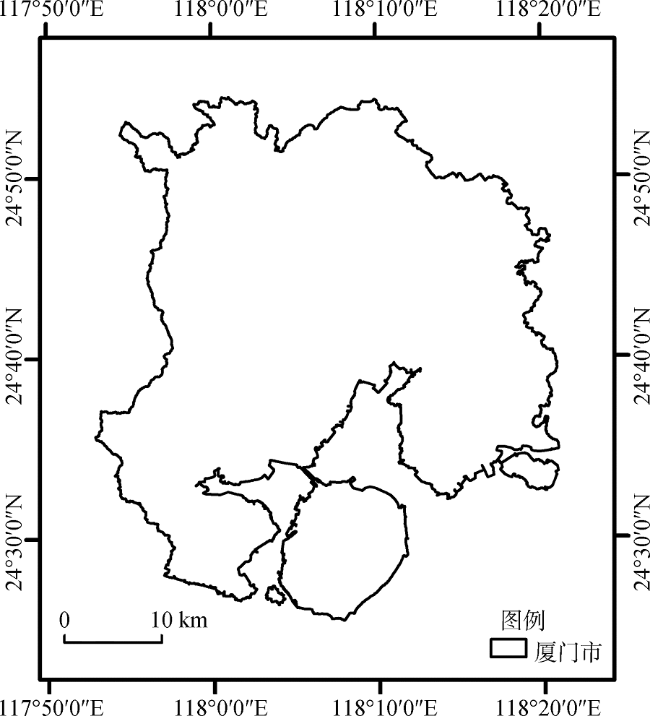
Fig. 1 The study area of Xiamen city图1 厦门市位置图 |
Tab. 1 The MODIS -Aqua images used in this study表1 本研究所使用的卫星数据 |
| 月份 | ||||||||||||
|---|---|---|---|---|---|---|---|---|---|---|---|---|
| 1 | 2 | 3 | 4 | 5 | 6 | 7 | 8 | 9 | 10 | 11 | 12 | |
| 数目/幅 | 5 | 1 | 3 | 5 | 0 | 1 | 1 | 2 | 0 | 9 | 3 | 7 |
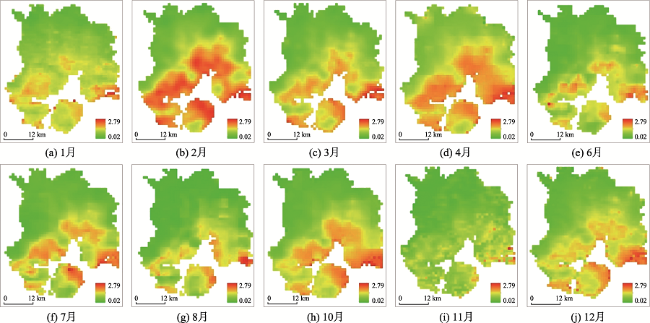
Fig. 2 Spatial distribution of AOD over Xiamen city in different months of the year from Mar. 2014 to Feb.2015图2 2014年3月-2015年2月厦门各月大气气溶胶光学厚度空间分布 |
Tab. 2 Thresholds used in the segmentation表2 密度分割所使用的阈值 |
| 气溶胶光学厚度值范围 | 风险等级 | 代表意义 |
|---|---|---|
| 0-0.5 | 1 | 低 |
| 0.5-1.0 | 2 | 较低 |
| 1.0-1.5 | 3 | 中 |
| 1.5-1.7 | 4 | 高 |
| >1.7 | 5 | 较高 |
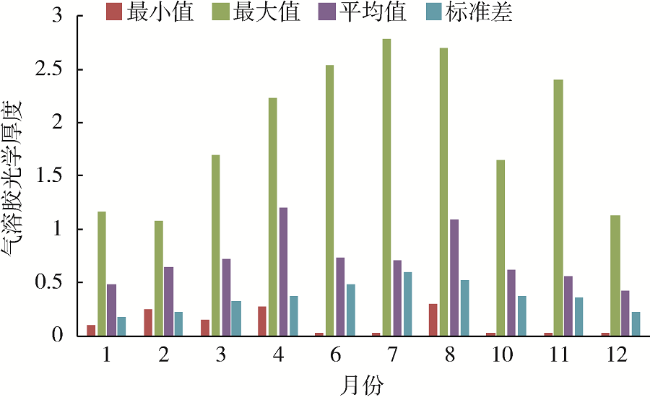
Fig. 3 The descriptive statistics of monthly AOD over Xiamen city图3 厦门各月大气气溶胶光学厚度统计信息 |
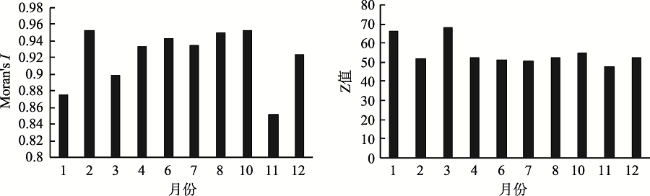
Fig. 4 Moran’s I and Z values of AOD over Xiamen city in different months图4 厦门各月份大气气溶胶光学厚度的全局自相关系数和Z值 |
Fig. 5 Anselin Local Moran’s I of AOD over Xiamen city in different months of the year from 2014 to 2015图5 2014年3月至2015年2日研究区各月份气溶胶光学厚度局部自相关聚类图 |
Fig. 6 Changes of AOD landscape metrics over Xiamen city图6 厦门大气气溶胶景观指数的变化 |
The authors have declared that no competing interests exist.
| [1] |
|
| [2] |
|
| [3] |
|
| [4] |
[
|
| [5] |
[
|
| [6] |
|
| [7] |
|
| [8] |
|
| [9] |
[
|
| [10] |
[
|
| [11] |
[
|
| [12] |
[
|
| [13] |
[
|
| [14] |
百度百科.厦门[EB/OL]., 2015-12-07.
[BaiduBaike.Xiamen[EB/OL]. , 2015-12-07. ]
|
| [15] |
厦门网.厦门遭遇史上最大雾霾,连续6天轻度污染[EB/OL]., 2014-01-04/2015-12-07.
[Xiamen Portal. Xiamen suffered the most intense haze in the past years and had been polluted for 6 days [EB/OL]. 2014-01- 4/2015-12-07. ]
|
| [16] |
|
| [17] |
[
|
| [18] |
[
|
| [19] |
[
|
| [20] |
[
|
| [21] |
|
/
| 〈 |
|
〉 |