
Journal of Geo-information Science >
Remote Sensing Analysis of Changes of Urban Thermal Environment of Fuzhou City in China in the Past 20 Years
Received date: 2017-07-22
Request revised date: 2017-12-22
Online published: 2018-03-20
Supported by
Natural Science Foundation of Fujian Province, China, No.2017J01463, 2009J01210
Education Department of Fujian Province, China, No.JA09059.
Copyright
Urbanization is taking place at an unprecedented rate around the world, particularly in China in the latest two decades. The effects of the intensive land-use / land-cover changes on urban surface temperatures and the consequences of these changes to human health are becoming progressively larger problems. Fuzhou, which is the capital city of Fujian province, is located in the coastal area of southeastern China. It has experienced a significant change of urban thermal environment during this period, and was recently named as one of the “new four furnace cities” in China. To study the process of changes in the thermal environment of Fuzhou city in the past 22 years, three Landsat images acquired in the years of 1994, 2003 and 2016, respectively, were used. HUTS is a widely used thermal sharpener method, which uses Normalized Difference Vegetation Index (NDVI) and surface albedo (α) to downscale the spatial resolution of thermal infrared data. It was applied to obtain LST images of higher spatial resolution (30 m) in the study area. The three downscaled LST images were then normalized, rescaled and overlaid to produce difference images to find out the changes of the thermal environment between different dates. Furthermore, by introducing simulations of different landscape patterns, these changes were evaluated and analyzed from the perspective of landscape ecology. The research results showed that, in 1994-2016, the high temperature area was increased from 35.75 km2 to 184.11 km2 with the city expansion. High temperature patches were expanded from city center to suburbs. On the other hand, the area and density of the high temperature patches were remarkably declined with the urban renewal. The Urban-Heat-Island Ratio Index (URI) rose up from 0.39 to 0.52, indicating that the urban heat island effect in the study area has been enhanced. Overall, the thermal environment of main urban area in Fuzhou has changed greatly in the past 22 years. Aggregation of high temperature patches was mitigated in Gulou, Taijiang and southern Jin'an Districts. Meanwhile, the temperature increased significantly in most area of Cangshan District, Mawei District and Minhou County due to rapid urbanization.
HOU Haoran , DING Feng , LI Qinsheng . Remote Sensing Analysis of Changes of Urban Thermal Environment of Fuzhou City in China in the Past 20 Years[J]. Journal of Geo-information Science, 2018 , 20(3) : 385 -395 . DOI: 10.12082/dqxxkx.2018.170342
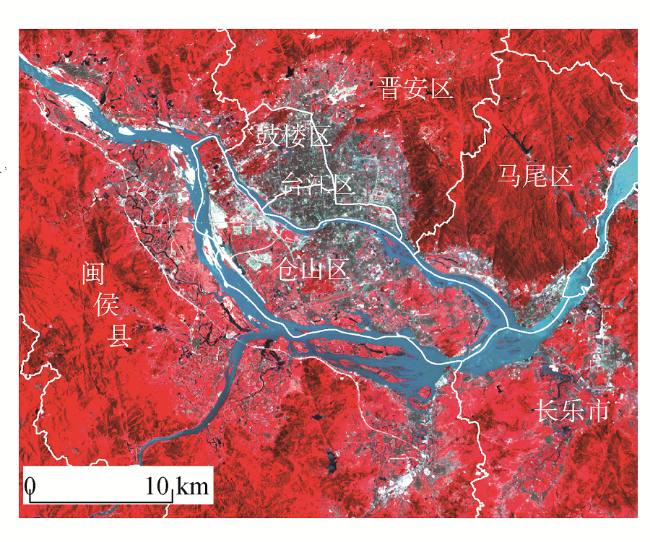
Fig. 1 Location of the study area (Landsat 7 imagery acquired on May 29, 2003, RGB432)图1 福州市位置图(2003年5月29日Landsat 7影像,RGB432标准假彩色合成) |
Tab. 1 Landsat data used in this study表1 本研究使用的Landsat数据 |
| 日期 | 卫星 | 传感器 | 多光谱波段 分辨率/m | 热红外波段 分辨率/m |
|---|---|---|---|---|
| 1994-05-12 | Landsat 5 | TM | 30 | 120 |
| 2003-05-29 | Landsat 7 | ETM+ | 30 | 60 |
| 2016-07-27 | Landsat 8 | OLI/TIRS | 30 | 100 |
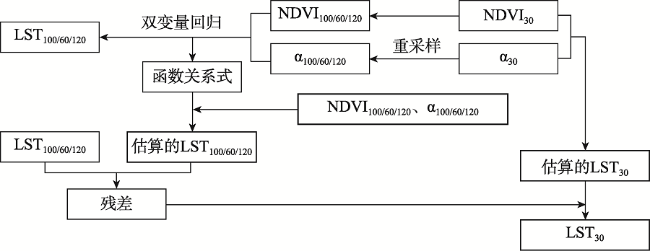
Fig. 2 Procedures of the HUTS method图2 HUTS算法流程 |
Tab. 2 Regression equations and correlation coefficients of the HUTS method表2 HUTS算法拟合方程与相关系数R2 |
| 日期 | 函数关系式 | R2 |
|---|---|---|
| 1994-05-12 | LST=-102.968×NDVI4-81.018×NDVI3×α-452.939×NDVI2×α2-3470.743×NDVI×α3-6711.404×α4+ 185.304×NDVI3+124.925×NDVI2×α+1989.608×NDVI×α2+7339.745×α3-98.337×NDVI2-208.730×NDVI× α-2543.358×α2+3.451×NDVI+307.084×α+287.112 | 0.693 |
| 2003-05-29 | LST=-83.076×NDVI4-210.457×NDVI3×α+1191.840×NDVI2×α2+1632.957×NDVI×α3-5267.525×α4 +202.028×NDVI3-145.967×NDVI2×α-2091.112×NDVI×α2+4130.058×α3 -126.477×NDVI2+527.870×NDVI×842.025×α2-9.252×NDVI+21.155×α+301.247 | 0.722 |
| 2016-07-27 | LST=18.931×NDVI4-173.263×NDVI3×α+22.455×NDVI2×α2+480.325×NDVI×α3-26.323×α4+8.589×NDVI3 +264.135×NDVI2×α-275.787×NDVI×α2+64.599×α3-47.393×NDVI2-52.674×NDVI×α-64.338×α2 +11.217×NDVI+27.213×α+307.319 | 0.734 |
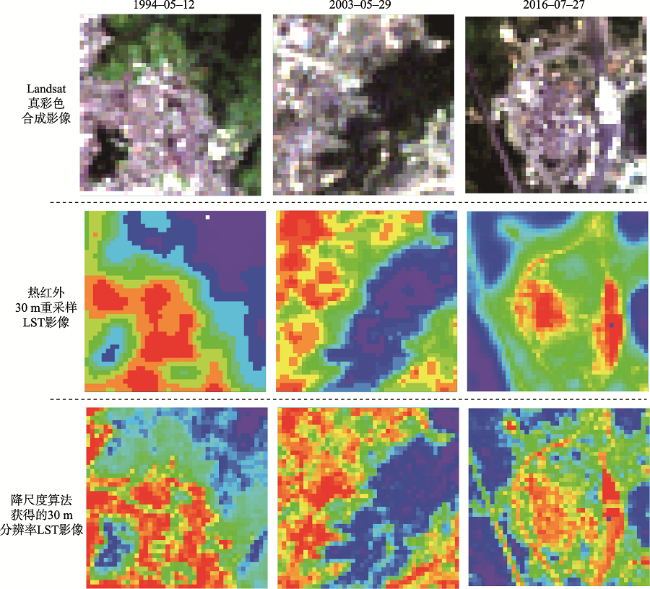
Fig. 3 1.2 km×1.2 km subarea from images in 1994, 2003 and 2016图3 3个时相(1.2 km × 1.2 km)不同处理结果图 |
Tab. 3 Statistics of downscaled images and RMSE (K)表3 降尺度影像的统计信息和均方根误差(RMSE)(K) |
| 统计量 | 1994-05-12 | 2003-05-29 | 2016-07-27 | |||
|---|---|---|---|---|---|---|
| 原始 | 降尺度 | 原始 | 降尺度 | 原始 | 降尺度 | |
| 最大值 | 303.1 | 304.3 | 306.8 | 304.2 | 316.5 | 314.5 |
| 最小值 | 283.1 | 282.2 | 289.2 | 287.4 | 297.7 | 297.8. |
| 均值 | 296.7 | 296.7 | 295.7 | 295.7 | 305.7 | 305.5 |
| 标准差 | 0.940 | 0.651 | 1.878 | 1.604 | 2.858 | 2.554 |
| RMSE | 0.781 | 1.010 | 1.507 | |||
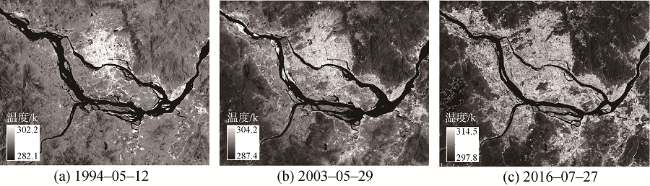
Fig. 4 LST imageries of the study area图4 福州市3个时相的地表温度影像 |
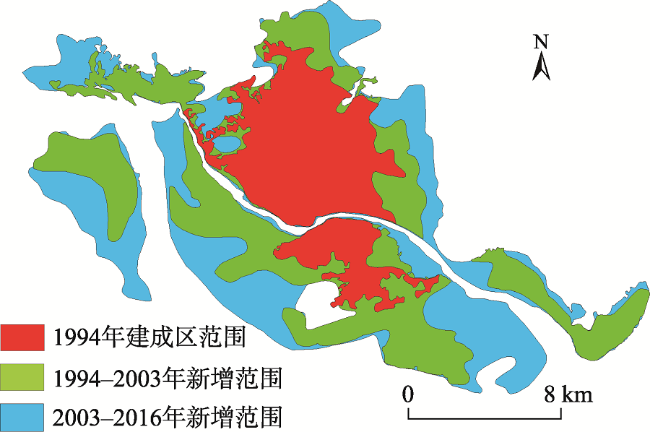
Fig. 5 Spatial and temporal changes of urban built-up area of Fuzhou from1994 to 2016图5 福州市建成区时空动态变化 |
Tab. 4 Built-up areas and its related indicators of Fuzhou in 1994, 2003 and 2016, respectively表4 福州市各年份建成区面积及其相关指标 |
| 年份 | 1994-05-12 | 2003-05-29 | 2016-07-27 | 1994-2003年 | 2003-2016年 |
|---|---|---|---|---|---|
| 面积/km2 | 73.08 | 180.38 | 274.83 | 107.30 | 94.45 |
| 年均增长率/% | - | - | - | 16.31 | 3.64 |
| 城市扩展强度 | - | - | - | 6.12 | 2.57 |
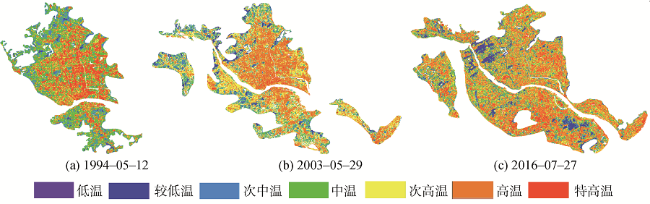
Fig. 6 Images of graded radiant temperature of urban built-up area in three years图6 3个时相建成区内温度等级分布图 |
Tab. 5 Area and percentage of each LST level and URI indexes of urban built-up areas in 1994, 2003 and 2016表5 福州市建成区各年地表温度等级的面积、比例和URI |
| 温度等级 | 1994-05-12 | 2003-05-29 | 2016-07-27 | |||
|---|---|---|---|---|---|---|
| 面积/km2 | 占比/% | 面积/km2 | 占比/% | 面积/km2 | 占比/% | |
| 1级(低温) | 0.75 | 1.02 | 3.64 | 2.02 | 2.56 | 0.93 |
| 2级(较低温) | 3.76 | 5.15 | 7.48 | 4.15 | 10.61 | 3.86 |
| 3级(次中温) | 7.57 | 10.36 | 21.03 | 11.66 | 24.51 | 8.92 |
| 4级(中温) | 25.23 | 34.53 | 43.58 | 24.16 | 53.04 | 19.30 |
| 5级(次高温) | 19.57 | 26.78 | 59.00 | 32.71 | 111.64 | 40.62 |
| 6级(高温) | 10.39 | 14.23 | 36.31 | 20.13 | 60.85 | 22.14 |
| 7级(特高温) | 5.79 | 7.93 | 9.33 | 5.17 | 11.62 | 4.23 |
| URI | 0.39 | 0.46 | 0.52 | |||
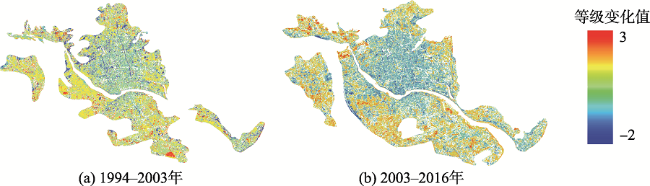
Fig. 7 Spatio-temporal variations of the LST levels in built-up area of Fuzhou图7 福州市建成区内温度等级时空变化 |
Tab. 6 Contagion indexes (CONTAG) in 1994, 2003 and 2016, respectively表6 3个时相的蔓延度指数(CONTAG) |
| 1994-05-12 | 2003-05-29 | 2016-07-27 | |
|---|---|---|---|
| CONTAG | 40.72 | 52.38 | 41.91 |
Tab. 7 Patch Density (PD) and Aggregation Index (AI) of high temperature patches表7 3个时相热岛温度等级斑块密度(PD)和聚合度指数(AI) |
| 温度等级 | 1994-05-12 | 2003-05-29 | 2016-07-27 | |||
|---|---|---|---|---|---|---|
| PD | AI | PD | AI | PD | AI | |
| 5级(次高温) | 53.75 | 62.53 | 36.40 | 67.33 | 17.52 | 67.42 |
| 6级(高温) | 76.08 | 50.79 | 24.68 | 79.45 | 67.44 | 64.80 |
| 7级(特高温) | 73.68 | 68.77 | 113.70 | 51.75 | 102.20 | 37.25 |
The authors have declared that no competing interests exist.
| [1] |
|
| [2] |
|
| [3] |
|
| [4] |
[
|
| [5] |
[
|
| [6] |
|
| [7] |
|
| [8] |
|
| [9] |
[
|
| [10] |
|
| [11] |
|
| [12] |
福州市统计局.2016福州统计年鉴[EB/OL]. .
[Fuzhou City Bureau of Statistics. 2016 Fuzhou Statistical Yearbook[EB/OL]. ]
|
| [13] |
[
|
| [14] |
|
| [15] |
|
| [16] |
|
| [17] |
|
| [18] |
[
|
| [19] |
[
|
| [20] |
[
|
| [21] |
|
| [22] |
|
| [23] |
|
| [24] |
|
| [25] |
Yale University. Yale guide to Landsat 8 image processing[EB/OL]. .
|
| [26] |
|
| [27] |
|
| [28] |
|
| [29] |
[
|
| [30] |
[
|
| [31] |
[
|
| [32] |
[
|
| [33] |
中华人民共和国国家环保部.中华人民共和国环境保护行业标准(试行):HJ/T192-2015[S].北京:中国环境科学出版社,2015.
[Ministry of Environmental Protection of People's Republic of China. Technical criterion for ecosystem status evaluation HJ/T192-2015[S]. Beijing: China Environmental Science Press, 2015.]
|
| [34] |
中华人民共和国住房城乡建设部.城市生态建设环境绩效评估导则(试行)[S].北京:中国建筑工业出版社,2015.
[Ministry of Housing and Urban-Rural of People's Republic of China. Environmental performance evaluation of urban ecological construction[S]. Beijing: China Architecture Building Press, 2015.]
|
| [35] |
|
| [36] |
[
|
| [37] |
[
|
| [38] |
[
|
| [39] |
|
| [40] |
[
|
| [41] |
[
|
| [42] |
[
|
/
| 〈 |
|
〉 |