Remote Sensing Analysis of Environmental Changes in Mega Cities along the Maritime Silk Road

  • FENG Suyun , 1, 2 ,
  • ZHANG Kaixuan 1 ,
  • LU Linlin , 2, *
Expand
  • 1. School of Geomatics, Liaoning Technical University, Fuxin 123000
  • 2. Key Laboratory of Digital Earth Science, Institute of Remote Sensing and Digital Earth , Chinese Academy of Sciences, Beijing 100094
Corresponding author: LU Linlin, E-mail: lull@radi.ac.cn

Online published: 2018-05-20

Supported by

National Natural Science Foundation of China, No.41471369;The Strategic Priority Research Program of the Chinese Academy of Sciences, No.XDA19030502; The International Partnership Program of Chinese Academy of Sciences, No.131C11KYSB20160061.

Copyright

《地球信息科学学报》编辑部 所有

Abstract

With the rapid process of urbanization, it is very important for sustainable urban development that how to evaluate the changes of urban environmental quality in time and accurately, and thus make reasonable urban developmental plans. In this paper, the fine particulate matter (PM2.5) concentration data, land surface temperature (LST) data, normalized difference vegetation index (NDVI) data and supplementary information data of urban land use obtained by satellite remote sensing were obtained and synthetically used to assess the urban environment changes in mega cities along the Maritime Silk Road. The dynamic changes of urban environmental quality of 12 mega cities along the Maritime Silk Road were analyzed based on the comprehensive evaluation index (CEI) from 2000 to 2013. The results showed that, from 2000 to 2013, approximately 75 percent of the mega cities along the Maritime Silk Road showed different degrees of environmental deterioration. The area of environmental deterioration and moderately environmental deterioration accounted for 31.33 percent (4732.39 km2) of the total urban areas in the 12 mega cities. And 29.48 percent (3765.83 km2) of the total expanded urban areas from 2000 to 2013 exhibited environmental degradation or moderately environmental degradation. The rise of average land surface temperature, the sharp decrease of vegetation coverage and the increase of the fine particulate matter concentration all had an impact on the urban environmental quality changes of the mega cities along the Maritime Silk Road. Among them, the significant increase of the fine particulate matter (PM2.5) concentration in the air was one of the main manifestations for the environmental degradation of the expanded urban areas from 2000 to 2013 in mega cities along the Maritime Silk Road. These findings suggested that more attentions should be paid to urban environment issues to ensure sustainable urban development along the Maritime Silk Road.

Cite this article

FENG Suyun , ZHANG Kaixuan , LU Linlin . Remote Sensing Analysis of Environmental Changes in Mega Cities along the Maritime Silk Road[J]. Journal of Geo-information Science, 2018 , 20(5) : 602 -612 . DOI: 10.12082/dqxxkx.2018.180083

1 引言

“一带一路”是“丝绸之路经济带”和“21世纪海上丝绸之路”的简称,它高举和平发展的旗帜,积极发展与沿线国家的经济合作伙伴关系,共同打造政治互信、经济互融、文化包容的利益共同体、命运共同体和责任共同体,其促进了城市经济的发展。据联合国统计,2016年全球共计31个人口超过一千万的超大城市,其中18个分布在一带一路区域[1,2]。特别是海上丝绸之路沿线,分布着12个超大城市,共居住着18 540.8万人口。这些城市的发展及环境的变化,严重影响着当地居民的生活和健康。
在过去的几十年间,全球超大城市经历了快速的工业化和城市化,造成自然资源的减少,环境质量的下降等问题[3,4]。这些超大城市大多面临着空气污染物(如PM2.5,PM10,O3,NOX等)含量的急剧增加[5,6,7]、淡水资源缺乏[8]、优质土壤减少[9]、城市霾日数增多[10]、植被覆盖度下降[11]、城市热岛效应加剧[12]等严重的环境问题。由于综合国力的限制,一带一路沿线的大多数发展中国家将经济发展放在首位,忽视环境保护,相对于发达国家,城市化造成的环境退化问题更为严重[13,14,15]。Dewan等[13]利用卫星图像和社会经济数据评估1975-2003年孟加拉国达卡的土地利用/覆盖变化和城市扩张,研究表明城市迅速扩张导致该城市水体、耕地、植被和湿地面积的显著减少。Doygon[14]对土耳其卡赫拉曼马拉什城市扩张对橄榄林的影响进行量化研究,结果表明城市扩张是造成该区域1985-2006年橄榄园面积大幅度减少的主要原因。Zhang等[18]利用共享经济途径和城市用地动态模型研究分析出北京、天津、河北沿线城市扩张造成粮食产量、碳储存量、淡水资源储存量的急剧下降。Liao等[5]利用WRF/Chem模型对长江三角洲地区城市化对空气质量的影响的研究表明城市化造成地表PM10含量的减少,O3含量的增加。同时,环境质量的退化严重危害着人们的健康,主要表现为诱发呼吸道疾病与生理机能障碍等各种疾病。据2016年世界卫生数据统计,2012年全球约有700万人口因此失去生命[15]
城市可持续发展是一个动态的不断平衡生态环境与人类活动的过程,既包括经济的可持续发展,又包括社会和生态环境的可持续发展[8]。及时、精确地对城市环境的变化做出评价,研究城市扩张对城市环境的影响,进而制定出合理的发展方案,对城市可持续发展至关重要。国际社会提出了一系列的环境指标,用于评价城市环境质量和可持续发展水平。例如,联合国可持续发展委员会(United Nations Commission on Sustainable Development)提出的可持续发展框架、欧洲环境署提出的城市代谢框架(Urban Metabolism Framework)、欧洲改善生活和工作条件基金会提出的城市可持续发展指标(Urban Sustainability Indicators)、城市中国计划提出的中国城市可持续发展指数(China Urban Sustainability Index)、欧盟统计局提出的城市统计(Cities Statistics)、其他的如城市蓝图(City Blueprints)、环境发展指标(Environmental Performance Index)、全球城市指标方案(Global City Indicators Programme)等。
遥感的发展使大范围的城市环境动态监测成为可能。近年来,越来越多的遥感数据被用于城市环境质量评价。如Peng等[16]利用MODIS数据分析了全球419个大城市2003-2008年城市与郊区热岛差异;Sun等[11]利用1982-2006年监测得到的归一化植被指数数据分析出城市化造成中国大部分城市地区,尤其东部地区植被覆盖度的急剧下降; Fang等[17]基于卫星遥感数据利用自适应性建模方法模拟出中国地区2013-2014年地表PM2.5浓度变化。
为综合评价海上丝绸之路沿线12个超大城市快速发展给城市环境变化带来的影响,为城市可持续发展方案的制定提供合理的决策依据,本文基于He等[3]提出的综合评价指标(Comprehensive Evaluation Index,CEI),综合利用地表温度数据(LST)、归一化植被指数(NDVI)、PM2.5浓度分布及全球建成区分布等多源遥感数据,分析2000-2013年海上丝绸之路沿线12个超大城市地区的环境质量动态变化。

2 研究区概况及数据源

2.1 研究区概况

本文研究区域为海上丝绸之路沿线12个超大城市,包括:印度的班加罗尔、金奈、德里、加尔各答及孟买;埃及的开罗;孟加拉的达卡;中国的广州、深圳;印度尼西亚的雅加达;巴基斯坦的卡拉奇;菲律宾的马尼拉。12个超大城市位于31°~121° E, 6°~30° S之间(图1,表1[18]
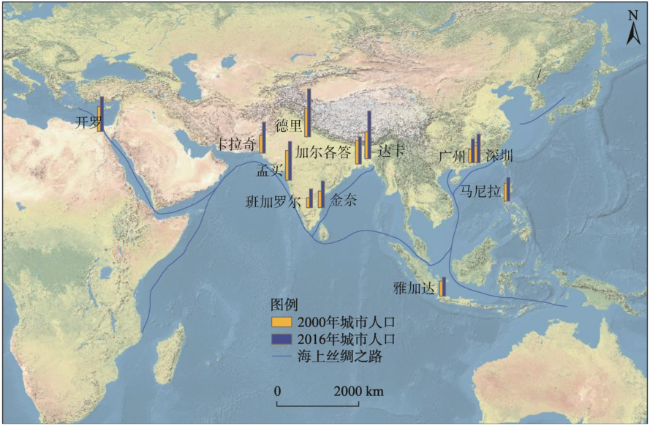
Fig. 1 Distribution of mega cities along the Maritime Silk Road

图1 海上丝绸之路沿线超大城市分布图

Tab. 1 Population statistics of 12 mega cities

表1 12个超大城市人口统计

城市 开罗 卡拉奇 德里 孟买 班加罗尔 加尔各答
2000年城市人口/千人 13 626 10 032 15 732 16 367 5567 13 058
2016年城市人口/千人 19 128 17 121 26 454 21 357 10 456 14 980
年增长率/% 2.1 3.3 3.2 1.7 3.9 0.9
城市 达卡 金奈 广州 深圳 马尼拉 雅加达
2000年城市人口/千人 10 285 6353 7330 6550 9962 8390
2016年城市人口/千人 18 237 10 163 13 070 10 828 13 131 10 483
年增长率/% 3.6 2.9 3.6 3.1 1.7 1.4

2.2 数据源

本文测定12个超大城市地区环境质量变化,主要利用的遥感影像数据如表2所示。首先,实验所需的PM2.5浓度数据从达尔豪西大学大气成分分析组获得(http://fizz.phys.dal.ca/~atmos/martin/?page_ id=140),具有1 km的空间分辨率。该数据记录了基于MODIS数据、多角度成像光谱辐射计(MISR)、海洋观测宽视场传感器(Sea WIFS)观测和哥达德地球观测系统化学传输模型(GEOS-Chem)计算得到的年均PM2.5浓度分布。为减少该数据误差的影响,本文计算了原始数据当年及前后年份的滑动平均值,作为研究采用的年均PM2.5浓度分布数据。
Tab. 2 The remote sensing data used in this study

表2 实验采用的遥感数据

数据 数据信息 空间分辨率 时段 数据来源
PM2.5浓度分布 MODIS+MISR+Sea WIFS传感器+GEOS-Chem传输模型 1 km 2000-2013 达尔豪西大学大气成分分析组
地表温度数据 MOD11A2 1 km 2000-2013 美国国家航天太空总署
归一化植被指数 SPOT/VGT 10-day composite 1 km 2000-2013 比利时弗拉芒技术研究院
全球建成区分布 Landsat 38 m 2000,2014 欧盟联合研究中心
地表温度数据(LST)为全球1 km地表温度/发射率8 d合成L3产品(MOD11A2)。该数据从美国国家航天太空总署(National Aeronautics and Space Administration,NASA)获取(https://modis-land.gsfc.nasa.gov/temp.html)。依据前人研究[19,20],本次实验仅使用夜间数据,然后计算得出2000-2013年年均夜间地表温度。
植被覆盖度数据(Vegetation Cover,VC)由从比利时弗拉芒技术研究院(VTIO Belgium)下载的归一化植被指数(NDVI)(http://www.vito-eodata.be/PDF/portal/Application.html#Home)计算得到,其中NDVI数据为10 d合成数据。首先,由10 d合成数据计算年均NDVI值。然后,利用式(1)分别计算2000年及2013年像元i处的VC值[21]
V C i = N i - N min N max - N min (1)
式中:VCi是像元i处的VC值;Ni是像元i处的NDVI值;Nmin,Nmax分别为12个超大城市NDVI最小、最 大值。
实验采用欧盟联合研究中心(Joint Research Center,JRC)基于2000年和2014年收集的多时相Landsat影像处理得到的全球建成区分布产品,作为海上丝绸之路沿线城市空间分布和城市扩张动态变化的基础数据[22]。为开展城市环境分析,我们将该数据转换为WGS84地理坐标系,并重采样生成1 km的建成区密度数据。利用优化阈值法,提取每个超大城市的城市中心及郊区边界,用于超大城市环境质量变化的空间格局分析。

3 环境变化评价方法

为全面反映海上丝绸之路沿线12个超大城市地区环境质量变化情况,本文基于联合国可持续发展委员会提出的可持续发展框架,利用PM2.5数据、地表温度数据(LST)及植被覆盖度(VC)来综合评价城市环境变化。

3.1 综合评价指标计算

本文利用He等[3]提出的综合评价指标(CEI)对海上丝绸之路沿线12个超大城市地区环境质量变化进行评价。综合评价指标(CEI)计算了PM2.5数据、地表温度数据(LST)及植被覆盖度(VC)的几何平均值,采用公式如下:
CE I i = Δ P M i + 1 × Δ V C i + 1 × Δ LS T i + 1 3 (2)
式中:CEIi是像元i处的环境变化量,范围为1-101,值越大表示环境退化越严重;ΔPMi、ΔVCi和ΔLSTi分别表示2000-2013年像元i处PM2.5浓度、VC、LST归一化变化量。
ΔLSTi和ΔPMi利用式(3)计算:
Δ V i = ( V i 2013 - V i 2000 ) - mi n v ma x v - mi n v × 100 (3)
式中:ΔVi表示PM2.5或LST归一化变化量;Vi2000,Vi2013分别表示像元i处PM2.5浓度或LST在2000年和2013年的值;minv,maxv分别表示12个超大城市2000-2013年PM2.5或LST最小、最大变化量,ΔVi越大,表示环境质量变化越差。
ΔVCi计算方式如下:
Δ V C i = ma x vc - ( V C i 2013 - V C i 2000 ) ma x vc - mi n vc × 100 (4)
式中:VCi2000,VCi2013分别表示2000、2013年像元i处VC值;minvc,maxvc分别表示12个超大城市2000-2013年植被覆盖度最小、最大变化量。

3.2 环境质量评估

He等[3]提出综合评价指标(CEI),应用于国内城市地区的环境变化监测,并用生态足迹、自然资源消耗等多种统计数据对监测结果进行了验证,发现它和统计数据分析结果具有一致性,能够较好的反映城市环境质量变化。本文计算了海上丝绸之路沿线12个超大城市地区的CEI及其均值和标准差,结合He等[23]提出的分类方法,将研究区域环境质量变化划分为5种类型:改善、逐步改善、未变、逐步恶化、恶化(表3)。然后依据式(5)分别计算超大城市地区5种环境质量区域的面积百分比:
P n = Are a n Are a 2013 × 100 % (5)
式中:Arean表示研究区域第nn=1,2,3,4,5)类环境质量所占的城市面积;Area2013为2013年城市总面积。如:P1=Area1/Area2013,表示研究区域环境质量 改善所占的百分比。其中,Area1表示研究区域环境质量改善的城市面积;Area2013表示2013年城市 总面积。
本研究分别对海上丝绸之路沿线超大城市的城市行政区、城市用地和2000-2013年城市扩张用地的环境变化进行了分析。城市用地指各超大城市行政边界以内的依据欧盟全球建成区分布产品提取的建成区区域。城市扩张用地指2000-2013年新增的建成区区域。
Tab. 3 Classification criteria for comprehensive evaluation indexes in study area

表3 研究区域综合评价指标分类标准

类型
改善 逐步改善 未变 逐步恶化 恶化
分类依据 <u-1.5δ u-1.5δ~u-0.5δ u-0.5δ~u+0.5δ u+0.5δ~u+1.5δ >u+1.5δ
综合评价指标 <33.93 33.93~42.56 42.56~51.20 51.20~59.83 >59.83

注:u,δ分别为12个超大城市地区环境质量综合评价指标(CEI)的均值和标准差

4 环境变化分析

4.1 城市环境变化空间格局

图2-4分别展示了12个超大城市2000-2013年PM2.5、LST及VC归一化变化结果。实验表明,2000-2013年,约80%的城市植被覆盖度处于下降趋势;其中约50%的城市2013年夜间平均地表温度较于2000年有所上升;12个超大城市PM2.5浓度均有所增加。12个超大城市中,加尔各答ΔPM2.5浓度最小值为92,远高于其他城市地区,其次是达卡与金奈,分别为75和46;开罗、达卡及马尼拉ΔLST最小值分别为38、37和36;班加罗尔ΔVC最小值为41较于其他城市均较高,其次是孟买和金奈分别为37和36。
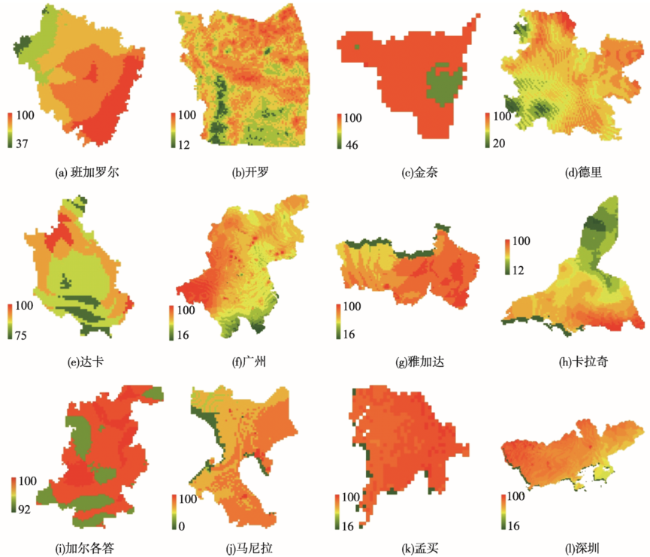
Fig. 2 The normalized variation of PM2.5 concentrations from 2000 to 2013 in 12 mega cities

图2 12个超大城市2000-2013年PM2.5浓度归一化变化

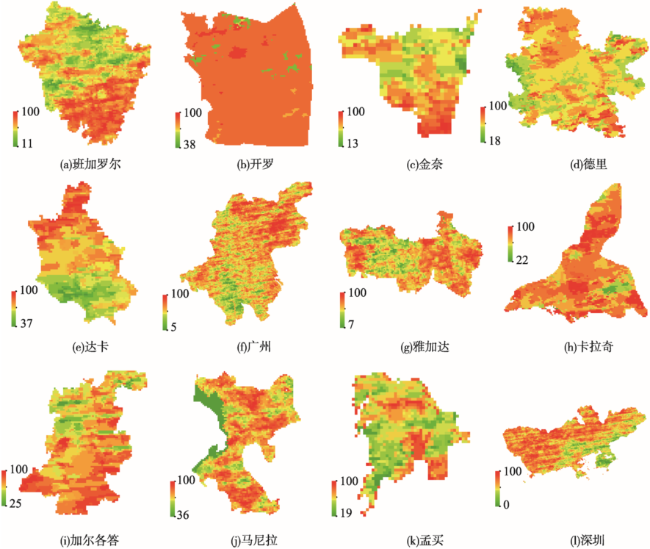
Fig. 3 The normalized variation of LST from 2000 to 2013 in 12 mega cities

图3 12个超大城市2000-2013年LST归一化变化

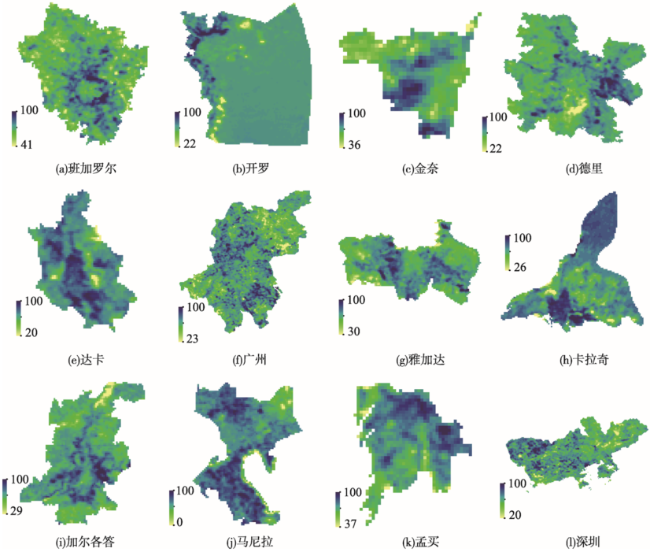
Fig. 4 The normalized variation of VC from 2000 to 2013 in 12 mega cities

图4 12个超大城市2000-2013年VC归一化变化

4.2 城市用地环境质量变化分析

研究表明,2000-2013年约75%的城市出现不同程度的环境退化现象。在整个研究区域,城市环境恶化及逐步恶化面积占城市建成区总面积的31.33%(4732.39 km2),改善的仅占3.39%(511.84 km2)。12个超大城市中,加尔各答、达卡、广州、班加罗尔及深圳环境退化较为严重。其中,加尔各答环境退化最为严重,整个城市中心及城郊地区环境质量均处于退化状态(图5),城市恶化面积占该城市总面积的89.51%(795.08 km2)(图6,表4)。2000-2013年该城市地区平均ΔPM2.5浓度为94.98,远高于其它城市地区,ΔLST也相对较高,约为47.42,ΔVC为55.56。其次是达卡恶化面积占该城市总面积的52.40%(约240.06 km2),主要集中在中部地区,其中,约80%的中心城市地区环境质量处于恶化状态,城郊地区环境质量变化也不容乐观。该城市地区2000-2013年平均ΔPM2.5浓度仅次于加尔各答约为79.89,ΔLST为53.60仅次于孟买,ΔVC为54.93。广州、班加罗尔和深圳逐步恶化和恶化的城市面积占相应城市面积的40%~70%,3个城市地区平均ΔPM2.5浓度处于50-68之间,ΔVC处于52-64之间,其中班加罗尔及广州环境恶化及逐步恶化现象主要出现在中部的城市中心区域,而深圳环境退化现象主要出现在西部偏北地区,约50%的城市中心环境质量处于恶化或逐步恶化状态,相对而言,城郊地区环境质量变化较为平缓。
Tab. 4 Environmental quality changes from 2000 to 2013 in 12 mega cities

表4 12个超大城市用地环境质量变化

城市 2000年城市用地/km2 扩增
面积/km2
恶化 逐步恶化 未变 逐步改善 改善
面积/km2 百分比/% 面积/km2 百分比/% 面积/km2 百分比/% 面积/km2 百分比/% 面积/km2 百分比/%
班加罗尔 235.26 368.57 27.53 4.56 361.27 59.83 196.11 32.48 18.92 3.13 0.00 0.00
开罗 228.48 1098.38 0.00 0.00 0.00 0.00 49.11 3.70 1225.70 92.38 52.05 3.92
金奈 44.56 254.85 0.00 0.00 5.23 1.75 184.26 61.54 57.58 19.23 52.34 17.48
德里 249.07 1361.00 0.00 0.00 0.00 0.00 171.73 10.67 1405.58 87.30 32.76 2.03
达卡 131.48 326.65 240.06 52.40 193.33 42.20 23.82 5.20 0.92 0.20 0.00 0.00
广州 710.99 2591.42 237.56 7.19 1804.73 54.65 1110.82 33.64 130.52 3.95 18.78 0.57
雅加达 148.56 2445.84 0.00 0.00 3.52 0.14 775.59 29.90 1565.27 60.33 250.02 9.63
卡拉奇 64.31 410.15 0.00 0.00 0.00 0.00 173.94 36.66 286.99 60.49 13.53 2.85
加尔各答 93.53 824.28 795.08 89.51 93.15 10.49 0.00 0.00 0.00 0.00 0.00 0.00
马尼拉 52.12 888.83 0.00 0.00 40.59 4.31 618.07 65.69 264.76 28.14 17.53 1.86
孟买 32.56 504.72 0.00 0.00 60.23 11.21 388.14 72.24 57.36 10.68 31.55 5.87
深圳 368.57 1698.49 30.92 1.50 839.19 40.60 954.03 46.15 199.64 9.66 43.28 2.09
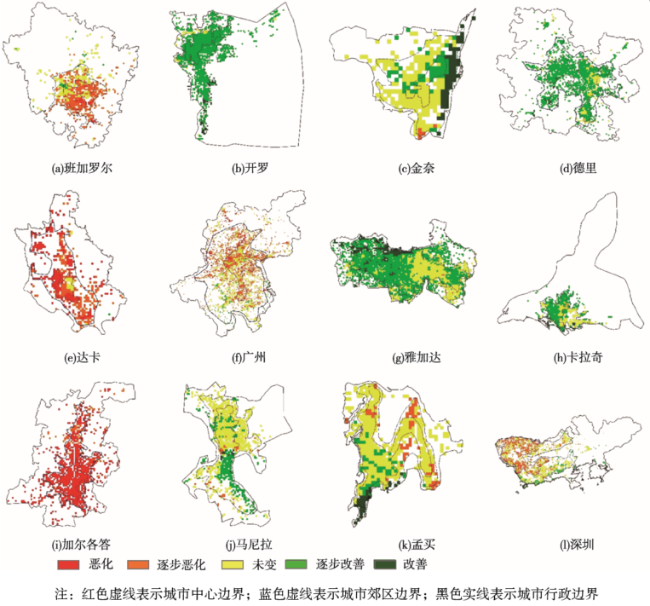
Fig.5 Environmental quality changes from 2000 to 2013 in 12 mega cities

图5 2000-2013年12个超大城市用地环境质量变化

4.3 城市扩张用地环境质量变化分析

2000-2013年12个超大城市扩张用地约为 12 773.18 km2,是2000年建成区总面积(2329.91 km2)的5倍,占2013年城市建成区面积的84.57%。12个超大城市中,加尔各答、达卡、广州及班加罗尔城市扩张用地环境质量恶化及逐步恶化面积均占据了相应城市扩张用地的60%以上(图7)。尤其加尔各答最为突出,无论是2000-2013年城市用地环境质量变化分析结果,还是城市扩张用地环境质量变化分析结果均显示,该城市环境质量处于逐步退化状态(图6-7),退化率达到了100%。雅加达、德里及开罗2000-2013年城市扩张用地环境质量变化较为平缓,3个城市地区平均ΔPM2.5浓度分别为30.69、37.46、26.15,相对较低;ΔLST分别为33.79、28.72、41.25;ΔVC分别为57.77、51.04、51.05。虽然德里城市地区2000-2013年平均PM2.5浓度变化相对较小,但空气中PM2.5浓度从2000年起均超过了95 ug/m3,在2010年甚至达到了120 ug/m3,这严重威胁着当地居民的健康。
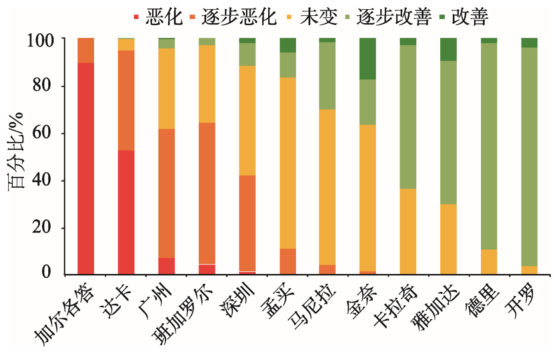
Fig.6 Analysis of environmental quality changes from 2000 to 2013 in 12 mega cities

图6 2000-2013年12个超大城市用地环境质量变化分析

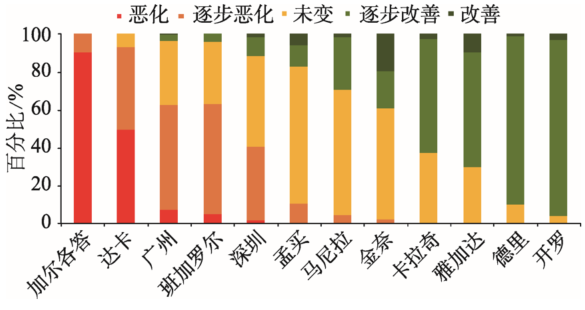
Fig. 7 Analysis of environmental quality changes of expanded urban areas from 2000 to 2013 in 12 mega cities

图7 2000-2013年12个超大城市扩张用地环境质量变化分析

为探究2000-2013年12个超大城市扩张用地呈现不同环境变化的原因,分析了ΔPM2.5浓度、ΔVC、ΔLST与CEI之间的相关性(表5)。实验得出ΔPM2.5与CEI相关性最高,约为0.919;ΔLST、ΔVC与CEI之间的相关系数分别为0.453,0.290。这表明PM2.5浓度的增加是海上丝绸之路沿线超大城市扩张用地环境退化的主要原因。
Tab. 5 Correlation coefficients between normalized variation of VC, LST, PM2.5 concentration and CEI

表5 VC、LST、PM2.5浓度归一化变化量与CEI之间的相关系数

CEI ΔPM2.5 ΔLST ΔVC
CEI 1
ΔPM2.5 0.919** 1
ΔLST 0.453** 0.143** 1
ΔVC 0.290** 0.202** 0.006* 1

注:**表示在0.01的置信水平上显著相关,*表示在0.05的置信水平上相关

图8展示了12个超大城市扩张用地ΔPM2.5浓度、ΔVC、ΔLST之间的比较结果。其中,加尔各答城市扩张用地平均ΔPM2.5浓度约为开罗地区ΔPM2.5浓度的3.63倍,ΔLST、ΔVC分别为均值最小值城市地区的1.65倍和1.15倍。世卫组织数据显示[16],自进入21世纪以来,印度大城市经济蓬勃发展,同时空气污染严重,估计2012年印度共有150万人死于空气污染,占该年全球死亡人数的11.6%。对于新扩张的城市用地,马尼拉年均夜间地表温度增长最大(图8)。Estoque等[24]基于Landsat数据分析发现,雅加达和马尼拉的平均陆表温度处于增长趋势,城市热岛效应加剧。位于印度南部的超大城市班加罗尔经历了大幅植被覆盖度下降。
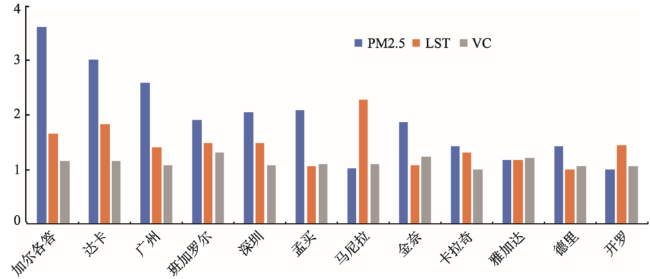
Fig.8 Comparisons of ΔVC, ΔLST, ΔPM2.5 concentration of expanded urban areas in 12 mega cities

图8 12个超大城市地区扩张用地ΔVC、ΔLST、ΔPM2.5浓度比较分析
注:VC、LST、PM2.5浓度分别为相应城市扩张用地归一化变化量与12个超大城市扩张用地ΔVC、ΔLST、ΔPM2.5浓度均值最小值的比值,如 VC=ΔVC/ΔVCmin,其中,ΔVCmin为12个超大城市扩张用地ΔVC均值中的最小值

5 结论

与传统的基于统计数据的环境质量变化评价方式相比较,本文采用的综合评价指标在空间上直观的展示了海上丝绸之路沿线12个超大城市地区2000-2013年环境质量变化情况。①2000-2013年城市环境质量变化分析结果显示,12个超大城市约80%的城市植被覆盖度处于下降趋势,约50%的城市夜间平均地表温度有所上升,12个城市PM2.5浓度均处于增长趋势。②2000-2013年城市用地环境质量变化研究结果表明,随着城市化进程的加快,海上丝绸之路沿线约75%的超大城市出现了不同程度的环境退化现象。城市扩张用地中,加尔各答、达卡、广州、班加罗尔及深圳环境退化较为严重,恶化及逐步恶化面积均占据相应城市扩张用地的40%以上。③VC、LST、PM2.5浓度的变化均对环境质量变化有一定影响,其中PM2.5浓度的增加是导致海上丝绸之路沿线超大城市环境退化的主要原因。综上研究结果,海上丝绸之路沿线12个超大城市地区面临着PM2.5浓度增加、地表温度上升及植被覆盖度下降的问题,从而导致了研究区域的环境质量退化现象。其中,PM2.5浓度的增加是主要因素。因此,各城市需要积极采取有效措施解决环境问题,特别是空气污染问题。
因2000年前地表温度数据的缺乏,本文仅研究了2000-2013年海上丝绸之路沿线12个超大城市建成区环境质量变化。遥感传感器的多样化发展、影像分辨率的不断提高将为城市环境变化监测提供更丰富、有效的遥感信息。本文在城市环境变化的研究中均等的考虑了各因子对环境质量的影响,发现各超大城市环境质量退化的主要因素不同。因此,在今后研究中可针对城市面临的具体环境问题,对各因子赋予不同的权重,评价城市环境的变化。此外,综合利用多源遥感数据和产品,采用时间序列分析、空间分析、回归分析等多种分析方法,精确评估城市环境质量变化时空格局及驱动因素变化,为城市可持续发展提供更好的决策依据。

The authors have declared that no competing interests exist.

[1]
United Nations, Department of Economic and Social Affairs, Population Division. The world's cities in 2016: data booklet, 2016 [EB/OL]. .

[2]
鹿琳琳,郭华东,Martino Pesaresi.“一带一路”城市化动态遥感视角[J].中国科学院院刊,2017,32(Z1):70-77.

[ Lu L L, Guo H D, Martino Pesaresi.Remote sensing of urbanization dynamics along the Belt and Road[J]. Bulletin of Chinese Academy of Sciences, 2017,32(Z1):70-77. ]

[3]
He C, Gao B, Huang Q, et al.Environmental degradation in the urban areas of China: Evidence from multi-source remote sensing data[J]. Remote Sensing of Environment, 2017,193:65-75.Abstract The rapid and timely evaluation of urban environmental change is highly important for understanding urban sustainability in China. However, the comprehensive understanding of urban environmental change in China based on multi-source remote sensing data remains inadequate because current studies have mainly focused on a single aspect of the urban environment using a specific source of remote sensing data. In this study, we developed a comprehensive evaluation index (CEI) combining the remote sensing data of the fine particulate matter (PM2.5) concentration, land surface temperature (LST) and vegetation cover (VC) to assess the urban environmental change in China at the national scale, among urban agglomerations and across the rapidly urbanized regions. We found a trend of environmental degradation in the urban areas of China between 2000 and 2012. Environmentally degraded and moderately degraded urban areas accounted for 48.14% of the total urban area in China. In particular, the expanded urban areas exhibited the most extensive environmental degradation, with 52.33% of the total expanded urban areas from 1992 to 2012 exhibiting environmental degradation or moderately environmental degradation. The increase in the PM2.5 concentration was one of the main manifestations of the environmental degradation in the expanded urban areas. We suggest that more attention should be paid to urban environmental issues during future urban development in China.

DOI

[4]
Zhu K, Xie M, Wang T, et al.A modeling study on the effect of urban land surface forcing to regional meteorology and air quality over South China[J]. Atmospheric Environment, 2017,152:389-404.The change of land-use from natural to artificial surface induced by urban expansion can deeply impact the city environment. In this paper, the model WRF/Chem is applied to explore the effect of this change on regional meteorology and air quality over South China, where people have witnessed a rapid rate of urbanization. Two sets of urban maps are adopted to stand for the pre-urbanization and the present urban land-use distributions. Month-long simulations are conducted for January and July, 2014. The results show that urban expansion can obviously change the weather conditions around the big cities of South China. Especially in the Pearl River Delta region (PRD), the urban land-use change can increase the sensible heat flux by 40 W/min January and 80 W/min July, while decrease the latent heat flux about -50 W/min January and -120 W/min July. In the consequent, 2-m air temperature (T) increases as much as 1 掳C and 2 掳C (respective to January and July), planetary boundary layer height (PBLH) rises up by 100-150 m and 300 m, 10-m wind speed (WS) decreases by -1.2 m/s and -0.3 m/s, and 2-m specific humidity is reduced by -0.8 g/kg and -1.5 g/kg. Also, the precipitation in July can be increased as much as 120 mm, with more heavy rains and rainstorms. These variations of meteorological factors can significantly impact the spatial and vertical distribution of air pollutants as well. In PRD, the enhanced updraft can reduce the surface concentrations of PMby -40 渭g/m(30%) in January and -80 渭g/m(50%) in July, but produce a correlating increase in the concentrations at higher atmospheric layers. However, according to the increase in Tand the decrease in surface NO, the surface concentrations of Oin PRD can increase by 2-6 ppb in January and 8-12 ppb in July. Meanwhile, there is a significant increase in the Oconcentrations at upper layers above PRD, which should be attributed to the increase in air temperature and the enhanced upward transport of Oand its precursors. As for some relative small cities, such as Haikou, there is very little variation in surface PMand Oin both months, implying less urbanization in these areas. Moreover, the depletion of Oby NO may be the main cause of the reduction of Oat upper layers in these small cities.

DOI

[5]
Liao J, Wang T, Jiang Z, et al.WRF/Chem modeling of the impacts of urban expansion on regional climate and air pollutants in Yangtze River Delta, China[J]. Atmospheric Environment, 2015,106:204-214.The Yangtze River Delta (YRD) region has experienced a rapid urbanization process accompanied with economic development during last decades. To investigate impacts of urbanization on regional climate and air quality, two-month (January and July 2010) simulations with two different land-use scenarios (USGS and MODIS land-use types) are conducted using the Advanced Weather Research and Forecasting/Chemistry (WRF/Chem) modeling system in this study. Results show that the conversion of vegetated and irrigated cropland into urban type significantly changes 2-m temperature and 10-m wind speed, which are obtained from differences of two simulations based on significance t-test at 95% confidence level. Changes of land-use cause an increase in 2-m temperature with maximum (minimum) value of 2.3°C (0.9°C) over urbanized area, a decrease in 10-m wind speed with magnitude of 0.6–1.2ms 611 for both the two months. Planetary boundary layer height (PBLH) differences show a maximum increase of 425m during daytime in July, and the increases are about 100m during nighttime for both January and July. Urbanization reduces near-surface PM 10 concentration due to increase of PBLH, with maximum decrease of 57.6μgm 613 during nighttime in July. The biggest increase of O 3 is around 6.8ppb during daytime in July and the difference is about 1.7–2.3ppb in January. Vertical profiles show that PM 10 concentrations decrease due to increase of mixing height during both daytime and nighttime. While for O 3 concentration, urbanization causes an increase during daytime due to higher air temperature and decrease of wind speed and leads to a decrease during nighttime. Overall, influences of urbanization on climate and air quality are important and significant over YRD region, which must be considered in any climate and air quality assessment.

DOI

[6]
Zhang Q, Geng, et al. Satellite remote sensing of changes in NOx emissions over China during 1996-2010[J]. Chinese Science Bulletin, 2012,57(22):2857-2864.

DOI

[7]
Egondi T, Muindi K, Kyobutungi C, et al.Measuring exposure levels of inhalable airborne particles (PM2.5) in two socially deprived areas of Nairobi, Kenya[J]. Environmental Research, 2016,148:500.61Air pollution in urban poor residential areas remain a health burden.61The level of PM2.5concentration in urban slum of Nairobi exhibit temporal variation.61The level of PM2.5concentration in Nairobi slums exceeds WHO recommended limits.

DOI PMID

[8]
Zhang D, Huang Q, He C, et al.Impacts of urban expansion on ecosystem services in the Beijing-Tianjin-Hebei urban agglomeration, China: A scenario analysis based on the Shared Socioeconomic Pathways[J]. Resources Conservation & Recycling, 2017,125:115-130.Understanding the impacts of urban expansion on ecosystem services (ESs) is important for sustainable development on regional and global scales. However, due to the uncertainty of future socioeconomic development and the complexity of urban expansion, assessing the impacts of future urban expansion on ESs remains challenging. In this study, we simulated the urban expansion in the Beijing-Tianjin-Hebei (BTH) urban agglomeration in China from 2013 to 2040, and assessed its potential impacts on ESs based on the Shared Socioeconomic Pathways (SSPs) and the Land Use Scenario Dynamics-urban (LUSD-urban) model. We found that urban land in the BTH urban agglomeration is expected to increase from 7605.2502km 2 in 2013 to 9401.75–11,936.0002km 2 in 2040. With continuing urban expansion, food production (FP), carbon storage (CS), water retention (WR), and air purification (AP) will decrease by 1.34–3.16%, 0.68–1.60%, 0.80–1.89%, and 0.37–0.87%, respectively. The conversion of cropland to urban land will be the main cause of ES losses. During 2013–2040, the losses of ESs caused by this conversion will account for 83.66–97.11% of the total losses in the whole region. Furthermore, the ES losses can cause considerable negative impacts on human well-being. The loss of FP will be equivalent to the food requirement of 3.68–8.61% of the total population in 2040, and the loss of CS will be 2.55–6.01% of the total standard coal consumption in 2013. To ensure sustainable development in the region, we suggest that effective policies and regulations should be implemented to protect cropland with high ES values from urban expansion.

DOI

[9]
Salvati L.Monitoring high-quality soil consumption driven by urban pressure in a growing city (Rome, Italy)[J]. Cities, 2013,31(2):349-356.The aim of this paper is to quantify the impact of urban expansion on soil quality in a sprawling Mediterranean region (Rome, Italy). The study verifies, at regional scale, if urban growth has consumed high-quality soil types at the expense of agricultural and forested land. At local scale, it tests if the recent urban diffusion has consumed more high-quality soil types than compact urban development. To verify these hypotheses, two high-resolution land-use maps for 1949 and 2008 were analyzed together with a 1:50,000 map of soil characteristics. Over an investigated area of 1500km 2 , urban fabric increased by 5.9% per year (from 8.2% in 1949 to 36.6% in 2008). In that period, urban areas consumed high-quality soil types in larger proportion than low-quality soil types while croplands and forests progressively occupied low quality and partly degraded soil types. Moreover, dispersed peri-urban settlements have been developed in Rome on high-quality soil types more frequently than dense urban settlements, suggesting that the recent low-density expansion impacts largely soil quality and land resources. This confirms that sprawl consumes high-quality land at higher rate than compact growth, possibly influencing the environmental quality of neighboring areas. Finally, the role of soil quality as a target for policies mitigating land consumption in -榮hrinking- Mediterranean cities is discussed.

DOI

[10]
史军,崔林丽.长江三角洲城市群霾的演变特征及影响因素研究[J].中国环境科学,2013,33(12):2113-2122.重建了长江三角洲1961~2007年霾气候数据序列,分析了霾日数的时空变化特征及城乡差异,并探讨了大气污染以及地面和近地层气象条件对霾发生的影响.结果表明,利用湿度—能见度指数参与霾气候序列重建的方法具有一定的合理性和科学性.过去47a间,长江三角洲霾日数总体上呈逐渐增多的趋势,并且四季霾日数都增加.空间上,整个长江三角洲霾日数基本上都呈增加趋势,并以杭州和南京增加最多.近30a来长江三角洲大城市、中等城市和城镇乡村站间霾日数变化具有明显差异.地面气象要素中风速和最长连续无降水日数与霾发生具有较好的对应关系.在霾天气过程和对应的清洁过程,近地层温度、位势高度和风场也都具有明显的差异.长江三角洲霾变化趋势与我国京津冀、珠江三角洲等地的变化一致.区域大气污染物排放量的增加,尤其是细颗粒物的增加是霾出现频率增加的可能原因,全球气候变化以及区域城市化造成的气象条件改变也有利于霾日的增加.

[ Shi J, Cui L L.Characteristics and influencing factors of haze in the Yangtze River Delta region[J],. China Environmental Science, 2013,33(12):2113-2122. ]

[11]
Sun J, Wang X, Chen A, et al.NDVI indicated characteristics of vegetation cover change in China's metropolises over the last three decades[J]. Environmental Monitoring and Assessment, 2011,179(1-4).Abstract How urban vegetation was influenced by three decades of intensive urbanization in China is of great interest but rarely studied. In this paper, we used satellite derived Normalized Difference Vegetation Index (NDVI) and socioeconomic data to evaluate effects of urbanization on vegetation cover in China's 117 metropolises over the last three decades. Our results suggest that current urbanization has caused deterioration of urban vegetation across most cities in China, particularly in East China. At the national scale, average urban area NDVI (NDVI(u)) significantly decreased during the last three decades (P < 0.01), and two distinct periods with different trends can be identified, 1982-1990 and 1990-2006. NDVI(u) did not show statistically significant trend before 1990 but decrease remarkably after 1990 (P < 0.01). Different regions also showed difference in the timing of NDVI(u) turning point. The year when NDVI(u) started to decline significantly for Central China and East China was 1987 and 1990, respectively, while NDVI(u) in West China remained relatively constant until 1998. NDVI(u) changes in the Yangtze River Delta and the Pearl River Delta, two regions which has been undergoing the most rapid urbanization in China, also show different characteristics. The Pearl River Delta experienced a rapid decline in NDVI(u) from the early 1980s to the mid-1990s; while in the Yangtze River Delta, NDVI(u) did not decline significantly until the early 1990s. Such different patterns of NDVI(u) changes are closely linked with policy-oriented difference in urbanization dynamics of these regions, which highlights the importance of implementing a sustainable urban development policy.

DOI PMID

[12]
季崇萍,刘伟东,轩春怡.北京城市化进程对城市热岛的影响研究[J].地球物理学报,2006,49(1):69-77.利用1971~2000年北京20个气象观测站逐日4个时次(02:00、08:00、14:00、20:00)的温度资料,选取具有代表性的城区和郊区多个站点的平均值对北京城市化进程对城市热岛效应的影响、城市热岛强度的日变化和长期变化进行了研究.分析结果指出:(1)北京城市热岛强度和总人口对数呈线性相关关系,其长期变化相关系数为076;(2)北京城市建成区的范围与城市热岛影响范围呈同步变化趋势;(3)不同时次城市热岛强度的长期变化指出,北京城市热岛强度以平均每10年022℃的速率加剧,其中1999年北京热岛强度达113℃(夜间,02:00);(4)夜间热岛强度明显大于日间.就10年平均而言, 20世纪80年代和90年代夜戒热岛强度均超过05℃;(5)一天4个时次热岛强度的季节变化趋势基本一致,均表现为冬季强、夏季弱.并且,夜间02:00时热岛最强,中午14:00时热岛最弱.

[ Ji C P, Liu W D, Xuan C Y.Impact of urban growth on the heat island in Beijing[J]. Chinese Journal of Geophysics, 2006,49(1):69-77. ]

[13]
Dewan, A. M, Yamaguchi, Y.Land use and land cover change in Greater Dhaka, Bangladesh: using remote sensing to promote sustainable urbanization[J]. Applied Geography, 2009,29(3):390-401.This study evaluates land use/cover changes and urban expansion in Greater Dhaka, Bangladesh, between 1975 and 2003 using satellite images and socio-economic data. Spatial and temporal dynamics of land use/cover changes were quantified using three Landsat images, a supervised classification algorithm and the post-classification change detection technique in GIS. Accuracy of the Landsat-derived land use/cover maps ranged from 85 to 90%. The analysis revealed that substantial growth of built-up areas in Greater Dhaka over the study period resulted significant decrease in the area of water bodies, cultivated land, vegetation and wetlands. Urban land expansion has been largely driven by elevation, population growth and economic development. Rapid urban expansion through infilling of low-lying areas and clearing of vegetation resulted in a wide range of environmental impacts, including habitat quality. As reliable and current data are lacking for Bangladesh, the land use maps produced in this study will contribute to both the development of sustainable urban land use planning decisions and also for forecasting possible future changes in growth patterns.

DOI

[14]
Doygun H.Effects of urban sprawl on agricultural land: A case study of Kahramanmaraş, Turkey[J]. Environmental monitoring and assessment, 2009,158(1-4):471.The main objective of this study is to quantify areal loss of olive groves due to urban sprawl of the city of Kahramanmara艧, . Spatial changes were analysed by interpreting the digitized data derived from a black-white monoscopic aerial photograph taken in 1985, panchromatic IKONOS image of 2000 and two pan-sharpened Quickbird images of 2004 and 2006. Data obtained revealed that the area of olive groves decreased by 25% from 460.55 ha in 1985 to 344.46 in 2006, while the number of parcels increased from 170 to 445. Of the total areal loss, 60% was due to building constructions, with the rest being due to clear-cut for new residential gardens composed of exotic , new buildings, or new roads. Rapid population growth, increased land prices due to urban expansion, and abandonment of agricultural practices to construction of multi-storey buildings were the main causes of the process that transformed the olive groves into urbanized areas. Results pointed to an urgent need to (1) revise the national and municipal land management practices, (2) balance the gap between the short- and long-term economic benefits that urban and community plans ignore, and (3) monitor land-use changes periodically by using high resolution satellite images.

DOI PMID

[15]
Organization W H.India takes steps to curb air pollution[J]. Bull World Health Organ, 2016,94(7):487-488.Abstract India's air pollution problem needs to be tackled systematically, taking an all-of-government approach, to reduce the huge burden of associated ill-health. Patralekha Chatterjee reports.

DOI PMID

[16]
Peng S, Piao S, Ciais P, et al.Surface urban heat island across 419 global big cities[J]. Environmental Science & Technology, 2012,46(2):696-703.Abstract Urban heat island is among the most evident aspects of human impacts on the earth system. Here we assess the diurnal and seasonal variation of surface urban heat island intensity (SUHII) defined as the surface temperature difference between urban area and suburban area measured from the MODIS. Differences in SUHII are analyzed across 419 global big cities, and we assess several potential biophysical and socio-economic driving factors. Across the big cities, we show that the average annual daytime SUHII (1.5 00± 1.2 00°C) is higher than the annual nighttime SUHII (1.1 00± 0.5 00°C) (P < 0.001). But no correlation is found between daytime and nighttime SUHII across big cities (P = 0.84), suggesting different driving mechanisms between day and night. The distribution of nighttime SUHII correlates positively with the difference in albedo and nighttime light between urban area and suburban area, while the distribution of daytime SUHII correlates negatively across cities with the difference of vegetation cover and activity between urban and suburban areas. Our results emphasize the key role of vegetation feedbacks in attenuating SUHII of big cities during the day, in particular during the growing season, further highlighting that increasing urban vegetation cover could be one effective way to mitigate the urban heat island effect.

DOI PMID

[17]
Fang X, Zou B, Liu X, et al.Satellite-based ground PM2.5 estimation using timely structure adaptive modeling[J]. Remote Sensing of Environment, 2016,186:152-163.Although ground-level measurement of PM 2.5 is relatively accurate, this method is limited in spatial and temporal coverage due to the high costs. Recently, satellite-retrieved aerosol optical depth (AOD), with high-resolution and wide spatial-temporal coverage has been increasingly applied to estimate PM 2.5 concentrations. However, these AOD-based PM 2.5 concentrations were spontaneously estimated using the structure fixed models across an entire study period. While these ‘structure fixed’ simplifications greatly facilitated the efficiency of model developments and enhanced their generalizability, they ignored the fact that the ‘contributors’ of PM 2.5 variation are not always coherent with time. For this, we propose a timely structure adaptive modeling (TSAM) method for satellite based ground PM 2.5 estimation in this study by considering the timely variations of modeling predictors and magnitude of predictors at respective optimal spatial scales. Meanwhile, the reliability of TSAM for estimating national scale daily PM 2.5 concentrations was tested by employing the AOD data from June 1, 2013 to May 31, 2014 over China with other multi-source auxiliary data such as meteorological factors, land use etc. While the fitting degree ( R 2 ) of the daily TSAM models is 0.82, the one in 10-fold validation is 0.80, which are relatively higher than previous studies. These results are significantly better than those from structure-fixed models in this study. Additionally, the TSAM simulated PM 2.5 concentrations show that the national annual PM 2.5 concentration in China during study period is 69.7102μg/m 3 with significant seasonal changes. These concentrations exceed the Level 2 of CNAAQS in more than 70% Chinese territory. Therefore, it can be concluded that the TSAM is a promising PM 2.5 modeling method that is superior to structure-fixed modeling and could be very useful for air pollution mapping over large geographic areas.

DOI

[18]
United Nations, Department of Economic and Social Affairs, Population Division[R]. World Urbanization Prospects: The 2014 Revision, 2014.

[19]
He C, Liu Z, Tian J, et al.Urban expansion dynamics and natural habitat loss in China: A multiscale landscape perspective[J]. Global Change Biology, 2014,20(9):2886-2902.AbstractChina's extensive urbanization has resulted in a massive loss of natural habitat, which is threatening the nation's biodiversity and socioeconomic sustainability. A timely and accurate understanding of natural habitat loss caused by urban expansion will allow more informed and effective measures to be taken for the conservation of biodiversity. However, the impact of urban expansion on natural habitats is not well-understood, primarily due to the lack of accurate spatial information regarding urban expansion across China. In this study, we proposed an approach that can be used to accurately summarize the dynamics of urban expansion in China over two recent decades (1992–2012), by integrating data on nighttime light levels, a vegetation index, and land surface temperature. The natural habitat loss during the time period was evaluated at the national, ecoregional, and local scales. The results revealed that China had experienced extremely rapid urban growth from 1992 to 2012 with an average annual growth rate of 8.74%, in contrast with the global average of 3.20%. The massive urban expansion has resulted in significant natural habitat loss in some areas in China. Special attention needs to be paid to the Pearl River Delta, where 25.79% or 151802km2 of the natural habitat and 41.99% or 76002km2 of the local wetlands were lost during 1992–2012. This raises serious concerns about species viability and biodiversity. Effective policies and regulations must be implemented and enforced to sustain regional and national development in the context of rapid urbanization.

DOI PMID

[20]
Zhou D, Zhao S, Zhang L, et al.The footprint of urban heat island effect in China[J]. Scientific Reports, 2015, 11160.Urban heat island (UHI) is one major anthropogenic modification to the Earth system that transcends its physical boundary. Using MODIS data from 2003 to 2012, we showed that the UHI effect decayed exponentially toward rural areas for majority of the 32 Chinese cities. We found an obvious urban/rural temperature “cliff”, and estimated that the footprint of UHI effect (FP, including urban area) was 2.3 and 3.9 times of urban size for the day and night, respectively, with large spatiotemporal heterogeneities. We further revealed that ignoring the FP may underestimate the UHI intensity in most cases and even alter the direction of UHI estimates for few cities. Our results provide new insights to the characteristics of UHI effect and emphasize the necessity of considering city- and time-specific FP when assessing the urbanization effects on local climate.

DOI PMID

[21]
孙久虎,刘晓萌,李佑钢,等.北运河地区植被覆盖的遥感估算及变化分析[J].水土保持研究,2006,13(6):97-99.植被覆盖度作为衡量地表植被覆盖的一个重要指标,是计算土壤侵蚀模数、分析土壤侵蚀的必要参数.根据1994年和2004年两期同时相的Landsat TM遥感图像资料,处理和分析并提取北运河地区的NDVI指数,利用像元二分模型原理定量估算植被覆盖度,得出其植被覆盖分类图.在此基础上分析了北运河地区10年来的植被覆盖变化特征.

DOI

[ Sun J H, Liu X M, Li Y G, et al.Remote sensing estimation and variation analysis of vegetation cover in North Canal area[J]. Research of Soil and Water Conservation, 2006,13(6):97-99.

[22]
Pesaresi M, Guo H, Blaes X, et al.A global human settlement layer from optical HR/VHR RS data: concept and first results[J]. IEEE Journal of Selected Topics in Applied Earth Observations & Remote Sensing, 2013,6(5):2102-2131.A general framework for processing high and very-high resolution imagery in support of a Global Human Settlement Layer (GHSL) is presented together with a discussion on the results of the first operational test of the production workflow. The test involved the mapping of 24.3 million km2 of the Earth surface spread in four continents, corresponding to an estimated population of 1.3 billion people in 2010. The resolution of the input image data ranges from 0.5 to 10 meters, collected by a heterogeneous set of platforms including satellite SPOT (2 and 5), CBERS 2B, RapidEye (2 and 4), WorldView (1 and 2), GeoEye 1, QuickBird 2, Ikonos 2, and airborne sensors. Several imaging modes were tested including panchromatic, multispectral and pan-sharpened images. A new fully automatic image information extraction, generalization and mosaic workflow is presented that is based on multiscale textural and morphological image features extraction. New image feature compression and optimization are introduced, together with new learning and classification techniques allowing for the processing of HR/VHR image data using low-resolution thematic layers as reference. A new systematic approach for quality control and validation allowing global spatial and thematic consistency checking is proposed and applied. The quality of the results are discussed by sensor, band, resolution, and eco-regions. Critical points, lessons learned and next steps are highlighted.

DOI

[23]
He C, Ma Q, Li T, Yang Y, et al.Spatiotemporal dynamics of electric power consumption in Chinese mainland from 1995 to 2008 modeled using dmsp/ols stable nighttime lights data[J]. Journal of Geographical Sciences, 2012,22(1):125-136.电力消费(EPC ) 是为评估电力使用的基本索引之一。在 EPC 的空间与时间的动力学上获得及时、精确的数据为理解和电力资源的实际推广是关键的。在这研究,一个 EPC 模型从防卫气象学的卫星程序用稳定的夜间灯时间系列数据被开发运作的 Linescan 系统(DMSP/OLS ) 。模型被用来重建在在县的中国大陆的 EPC 的空间模式从 1995 ~ 2008 铺平。另外, EPC 的空间与时间的动力学被分析,并且下列结论被得出。(1 ) EPC 模型可靠地与约 70% 精确性在中国大陆代表了 EPC 的空间与时间的动力学。(2 ) 在中国大陆的大多数区域的 EPC 在对中等层次低,与显著时间、空间的变化;高级 EPC, 58.26% 在东方中国被集中。六城市的凝块(Beijing-Tianjin-Tangshan 区域, Shanghai-Nanjing-Hangzhou 区域,珀尔河三角洲,山东半岛,辽宁省,和四川盆中间南方) 说明了中国大陆的 10.69% 全部的区域,但是消费了 39.23% 电。(3 ) 在从 1995 ~ 2008,和 64% 大陆区域增加的中国大陆的大多数区域的 EPC 在 EPC 显示出重要增加。EPC 的中等增加从 1995 ~ 2008 在 61.62% 东方中国和 80.65% 华中被发现,而 75.69% 西方的中国没在 EPC 显示出重要增加。同时,分别地, 77.27% , 89.35% ,和 66.72% Shanghai-Nanjing-Hangzhou 区域,珀尔河三角洲,和山东半岛在 EPC 显示出高速度的增加。EPC 的中等增加发生在 71.12% Beijing-Tianjin-Tangshan 区域和 72.13% 并且辽宁省中间南方,分别地当没有重要增加发生在 56.34% 四川盆时。

DOI

[24]
Estoque R C, Murayama Y, Myint S W.Effects of landscape composition and pattern on land surface temperature: An urban heat island study in the megacities of Southeast Asia[J]. Science of the Total Environment, 2017,577:349-359.Due to its adverse impacts on urban ecological environment and the overall livability of cities, the urban heat island (UHI) phenomenon has become a major research focus in various interrelated fields, including urban climatology, urban ecology, urban planning, and urban geography. This study sought to examine the relationship between land surface temperature (LST) and the abundance and spatial pattern of impervious surface and green space in the metropolitan areas of Bangkok (Thailand), Jakarta (Indonesia), and Manila (Philippines). Landsat-8 OLI/TIRS data and various geospatial approaches, including urban-rural gradient, multiresolution grid-based, and spatial metrics-based techniques, were used to facilitate the analysis. We found a significant strong correlation between mean LST and the density of impervious surface (positive) and green space (negative) along the urban-rural gradients of the three cities, depicting a typical UHI profile. The correlation of impervious surface density with mean LST tends to increase in larger grids, whereas the correlation of green space density with mean LST tends to increase in smaller grids, indicating a stronger influence of impervious surface and green space on the variability of LST in larger and smaller areas, respectively. The size, shape complexity, and aggregation of the patches of impervious surface and green space also had significant relationships with mean LST, though aggregation had the most consistent strong correlation. On average, the mean LST of impervious surface is about 3聽掳C higher than that of green space, highlighting the important role of green spaces in mitigating UHI effects, an important urban ecosystem service. We recommend that the density and spatial pattern of urban impervious surfaces and green spaces be considered in landscape and urban planning so that urban areas and cities can have healthier and more comfortable living urban environments.

DOI PMID

Outlines

/