Analysis on Spatial Distribution Characteristics of Restaurant Based on Network Spatial Point Model

  • ZENG Xuan ,
  • CUI Haishan , * ,
  • LIU Yihua
Expand
  • School of geographic science, Guangzhou University, Guangzhou 510006, China
*Corresponding author: CUI Haishan, E-mail:

Received date: 2017-12-08

  Request revised date: 2018-02-02

  Online published: 2018-06-20

Supported by

National Natural Science Foundation of China, No.41771096

Project of Internation as well as Hongkong, Macao&Taiwan Science and Technology Cooperation Innovation Platform in Universities in Guangdong Province, No.2014KGJHZ009

Copyright

《地球信息科学学报》编辑部 所有

Abstract

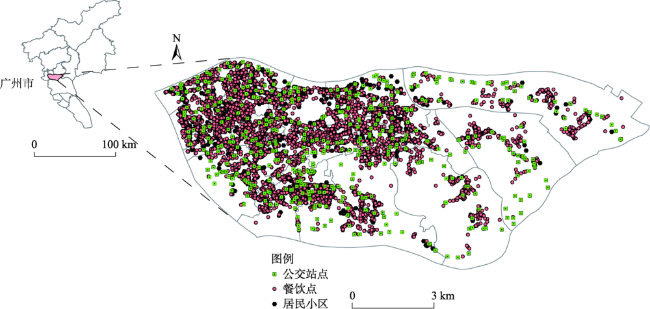
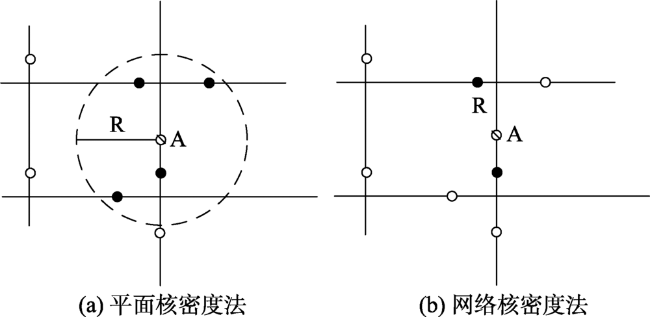
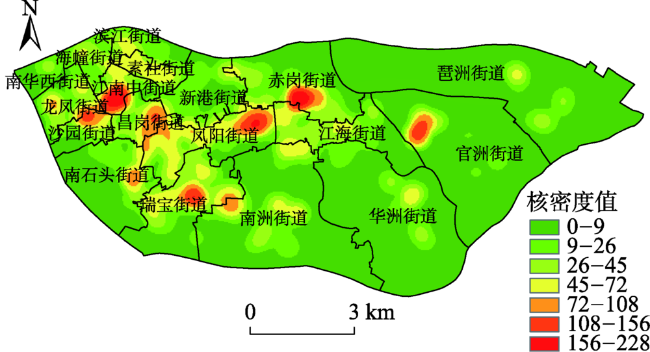
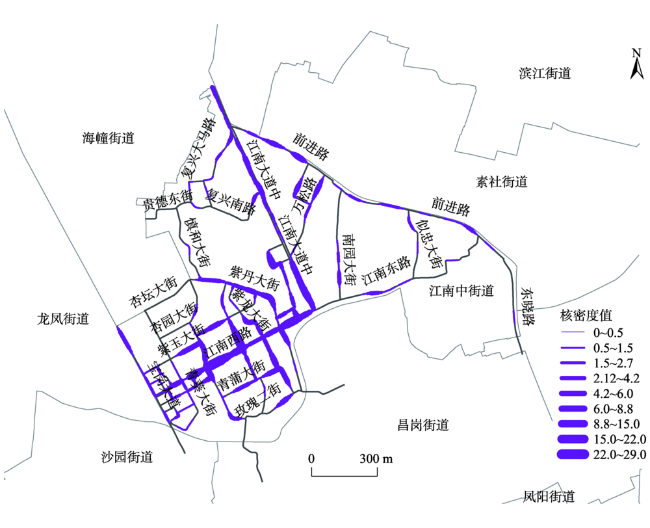
The catering industry has been considered as one of the most important indicators concerning economic development of a city. Using appropriate methods to study catering industry has been playing an important part in research fields such as city planning, business location and economic development. Many restaurants in a city can be abstracted as point objects in the study of geography. It is one of the most commonly used methods to study the spatial layout of facility events by using spatial point patterns. The traditional point pattern analysis methods are basically based on the Euclidean distance and assume that the plane space is a homogeneous and isotropic space. However, many geo-objects are usually distributed on the road network or along the road network, such as restaurants, banks, supermarkets and road traffic accidents. If the traditional method of plane space point analysis is applied to the trend events occurring along the road network, wrong aggregation mode may occur. By using the network spatial point pattern analysis method, the shortest path distance instead of the Euclidean distance can be used to study the distribution characteristics of the event points, and more accurate spatial analysis results can be obtained. Take Haizhu District of Guangzhou city as an example, on the basis of restaurants POI (point of interest) data, Kernel density estimation is adopted to analyze spatial distribution characteristics of restaurants. The network kernel density method is used to investigate the distribution characteristics of the hot roads, and double variable K function method is applied to analyze the relations between distribution of restaurants and bus stations and residential areas. The spatial pattern of Haizhu District restaurants shows much more dense in the West and comparatively sparser in the East. The restaurant hot spots are mainly concentrated along the streets of Jiangnan West and Jiangnan Zhong, and the density of the restaurants decreases with the increase of the distance from the hot spots. The degree of aggregation of restaurants, bus stations and residential areas is also investigated under the road network structure. The results show that restaurants have strong aggregation relations with bus stations, which indicates that the restaurant tends to close to the traffic stations, but have no significant aggregation relationship with the residential areas. As far as the spatial point objects along streets are concerned, better results can be obtained by using network analysis of spatial point pattern.

Cite this article

ZENG Xuan , CUI Haishan , LIU Yihua . Analysis on Spatial Distribution Characteristics of Restaurant Based on Network Spatial Point Model[J]. Journal of Geo-information Science, 2018 , 20(6) : 837 -843 . DOI: 10.12082/dqxxkx.2018.170596

1 引言

采用合适的方法研究城市服务设施点的空间分布特征,对城市管理、商业布局、辅助决策等具有重要的意义。目前,研究城市点事件的空间格局规律,常用的方法是空间点模式分析法[1,2,3,4,5,6]。传统空间点模式分析方法认为平面空间是均质的、各向同性的,没有考虑到将其应用到沿道路网分布的事件时会产生错误的聚集模式[7]。但在实际应用中,很多城市对象通常是沿着道路网络分布的,如城市街道旁的餐饮店、银行、交通事故等。鉴于此,国内外研究人员提出了网络空间点模式分析方法,用最短路径距离来代替欧氏距离量算事件点的空间分布特征,弥补传统分析方法的不足,并应用到不同领域。例如,Xie等[8,9]提出了网络核密度估计方法,分析道路网络上交通事故的分布特征,禹文豪等[10]采用网络核密度估计方法分析了城市服务设施热点分布特性,郑滋椀[11]采用该方法研究了犯罪事件在道路网络中的时空分布特征。Okaba和Yamada 等[12,13,14,15]将平面K函数法延伸到网络空间,进而提出网络K函数法(Network K-function Method),并开发了用于网络空间点模式的分析工具——SANET,针对空间点事件开展了研究。Garrocho-Rangel等[16]采用网络K函数法分析了城市内部经济单位的集聚模式、规模和强度,杨珏婕等[17]利用该方法对西双版纳人工林的分布格局进行探究。邬伦等[18]采用网络单变量和双变量K函数法分析香港岛餐饮店的空间分布模式,王结臣等基于平面和网络的视角,运用K函数法分析南京市ATM网点空间分布特征及与地铁站点之间的依赖关系[19]
餐饮业作为城市服务业重要的组成部分,是城市经济发展的重要指标,加强对餐饮业的研究,有助于掌握城市发展空间格局,进而提升城市综合竞争力。目前,利用网络空间点模式分析方法对城市餐饮店的空间分布格局及其影响因素研究较少。本文以广州市海珠区为例,利用平面核密度法得到餐饮业聚集分布区域,进而采用网络核密度估计方法和网络双变量K函数法,分析餐饮店分布的热点路段,并探讨在不同尺度下餐饮店分布与交通站点,居民小区的相关性。

2 研究区概况与数据源

2.1 研究区概况

海珠区位于广东省广州市南部(113°14'~113°23' E、23°3'~23°16' N),属亚热带季风气候,总面积90.40 km2图1)。根据《海珠年鉴》,2015年海珠区辖18个行政街道和257个社区,常住总人口为161.37万人,生产总值达到1422.97亿元,按可比价格计算,同比2014年增长8.5%,增速居广州市全区第三,其中餐饮业营业额128.67亿元,同比2014年增长14.7%[20]
Fig.1 Location map of Haizhu district

图1 研究区区位示意图

2.2 数据源

利用大数据进行城市服务设施空间格局分析已成为一种新的研究热点,兴趣点(Point of Interest,POI)数据是一种新的空间数据源,包括了经纬度、地址和名称等空间信息和属性信息。本研究利用高德地图开放的API爬取并筛选2015年海珠区POI数据,获取餐饮店8231个、公交站505个、居民小区845个。利用1:5万海珠区交通图数字化得到所需的道路矢量数据,运用SANET 4.3工具进行研究区网络核密度估计和网络双变量K函数计算,在ArcGIS 10.2软件中显示餐饮店网络核密度估计分析结果,通过R语言进行网络双变量K函数结果可视化分析。

3 研究方法

3.1 核密度估计

核密度估计主要用于对随机变量的密度函数进行计算,通过估算其周围单位面积区域内事件点数量,得到网络单元的核密度值[8]。其计算公式为:
λ s = i = 1 n 1 π r 2 k d is r (1)
式中:λ(s)为平面位置s的密度;r为搜索半径;dis是点i到事件点s的距离;k是核的权重函数。

3.2 网络核密度估计

网络核密度估计是用最短路径距离来度量,将每条路段分割成基本等长的线性单元,与平面核密度估计法相比,能更准确地表达城市点设施沿街道分布的特征[8]。其计算公式为:
λ s = i = 1 n 1 r k d is r (2)
式中:λs)为空间位置s的密度;r为带宽;dis是点i到事件点s的最短路径距离;k是核函数。
核函数的选择对点分布模式的影响不大,但带宽r可以控制点密度分布的光滑程度,需要考虑带宽r的选择[21]。在平面核密度估算中,事件点周围有4个设施点在影响范围内,而在网络路径距离时,只有2个设施点在密度计算范围内(图2)。可知,在选取同样的带宽时,平面核密度有时可能会造成过度的空间聚集模式。
Fig. 2 Comparisons of results between the planar kernel density estimates and the network kernel density estimates

图2 平面核密度估计与网络核密度估计结果对比

3.3 网络双变量K函数法

K函数方法是空间点模式中常用的方法之一,是由统计学家Ripley于1976年提出,基本思想是:假定在各个事件点中心设置半径为r的圆,计算落入圆内事件的个数,用圆内事件的平均数量除以事件的密度[22,23]。网络K函数法是对平面K函数法的一种扩展,其距离采用的是两点之间最短路径距离[24]。其中,双变量K函数法用来研究在不同尺度下一种点事件的分布是否对另外一种事件点的分布产生影响,或者这些事件点之间是否存在空间依赖关系。在网状结构中,规定A=(a1, a2, …, an)和 B=(b1, b2, …, bn)表示位于道路网络上的2个事件集,LT为网络数据集,|LT|表示网络的总长度。对于理论期望值,定义其双变量K函数Kbat[13]为:
K ba t = 1 ρ a × E (3)
式中:E为对任意点biB的理论期望值;raA事件集的密度,即ρa=na/|LT|。
对于观测值,定义其双变量K函数值Kbat)为:
K ba ù t = L T n a n b × S i = 1 n b (4)
采用蒙特卡洛模拟方法检验空间分布模式聚集的显著性[25,26]。如果观测值大于理论期望值,且位于蒙特卡罗模拟置信区间上限之外,则说明事件点呈显著聚集分布模式;如果观测值小于理论期望值,且位于蒙特卡洛模拟置信区间内,则说明事件点为随机分布模式。

4 结果分析

4.1 餐饮店总体分布特征

研究表明,核密度结果随着搜索半径的增大而趋于平滑[27]。本文选取2015年海珠区餐饮点数据进行核密度分析,以街道为单位,采用k阶最邻近距离法,进行不同搜索半径检验,最后确定k=3时的搜索半径为500 m,像元大小25 m×25 m,得到餐饮店空间格局聚集分布结果。海珠区餐饮店从整体上看具有“西密东疏”的空间分布模式,呈现多中心的空间分布特征。其中,江南中街道、赤岗街道、凤阳街道为餐饮店分布的高密度区,昌岗街道、瑞宝街道、官洲街道的餐饮店分布密度次之(图3)。江南中街道以江南西商圈为核心,汇集了江南新地、广百新一城、摩登百货、名店城等购物中心,其人口流量大,为餐饮业的发展奠定基础。以新港商业城、珠影广场及赤岗东路沿线区域形成赤岗街道餐饮店热点区;以盈森商贸城、合生广场和鹭江东约、西约新街区域形成凤阳街道餐饮店热点区。这说明餐饮店的分布与购物中心存在空间自相关性,它们之间的相互作用不容忽视。海珠区东部分布着大面积的森林公园(如大围公园、海珠湿地公园、海珠湖公园、上涌果树公园、瀛洲生态公园等),其商业活动较弱,人流量小,附近很少有餐饮店服务。
Fig. 3 Hotspot distribution map of restaurants in Haizhu District

图3 海珠区餐饮店热点分布图

4.2 街道餐饮网络核密度估计

利用平面核密度分析方法可以得到海珠区餐饮店分布的聚集区域,但不能精细地确定餐饮店分布的热点路段。以江南中街道为研究对象,采用SANET中“kernel density estimation”工具对该街道餐饮店进行网络核密度估计,得到街道餐饮店热点路段分布结果。研究表明,带宽对核密度的计算结果产生重要的影响,带宽小,聚集的细节信息比较丰富;随着带宽逐渐增大,空间上的密度分布变得越来越光滑,因此在实际应用中,带宽的设置需要根据事件的实际特征、尺度来确定。利用该工具中的Equal split核函数,对10~200 m带宽进行测试,发现20~90 m带宽使得密度分布趋向于局部地区,整体特征体现不明显;大于100 m的带宽导致点密度空间分布过于平滑,细节信息不突出,且不能较好地表达点密度分布的局部差异;选择平均阈值100 m带宽、线性单元为10 m进行分析,效果最好。餐饮店分布的热点路段主要集中在江南西路和江南大道中沿线,其密度随着与该沿线的距离增加而衰减(图4)。由于在这一沿线分布着大型写字楼和广百百货、富力海珠城等购物中心,以及广播电视大学、广州医药研究总院等高校,商业活动较强且人口比较密集,说明餐饮店分布比较集中在人流量大且商业繁华地段。
Fig. 4 Restaurants distribution map of the network kernel density estimation in Jiangnanzhong street

图4 江南中街道餐饮店网络核密度分布图

4.3 餐饮店空间分布影响因素

影响餐饮店空间分布的因素较多,(如人口、交通和经济等),本文主要研究公交站和居民小区对餐饮设施分布的作用关系。采用网络双变量K函数分析餐饮店分布与公交站和居民小区的相关性,利用SANET中“Global auto cross K function”工具实现。在分析过程中,用A表示餐饮店,用B1代表公交站,B2代表居民小区,在道路网状结构下分析餐饮店与公交站和居民小区的聚集程度。如图5显示,在50~450 m范围内,餐饮店和公交站的双变量K函数观测值曲线在理论期望值曲线之上,且位于蒙特卡罗模拟置信区间上限之外,说明在此尺度范围内,餐饮店和公交站点之间存在显著的相互聚集分布关系。在460~2000 m范围内,观测值曲线仍然分布在理论期望值曲线之上,说明餐饮店和公交站之间存在一定聚集关系,但由于观测值曲线位于蒙特卡洛模拟的置信区间之内,说明显著性较低。由图6所示,在道路网络结构100~900 m范围内,餐饮店和居民小区的双变量K函数观测值曲线在理论期望值之上,说明餐饮店与居民小区存在相互吸引关系,但其在置信区间之内,不具显著性。在1000 m和1400 m范围内,观测值曲线位于理论期望值曲线之下,且在置信区间以内,说明餐饮店和居民小区在空间上存在显著的相互排斥关系;在1450~1800 m范围内,观测值曲线在理论期望值曲线之上,说明存在相互聚集关系,但仍然位于置信区间以内,说明不具有显著性。由分析结果可知,在较小尺度下,餐饮店分布更加倾向于公交站点附近,受其影响较大,这说明公交站点与道路在空间上分布具有相似性,交通越便利,人流量越大,与餐饮店选址对道路交通的依赖性一致。在不同尺度下,餐饮店分布与居民小区之间的相互影响较小,说明住宅小区内的居民对附近餐饮服务的需求少。
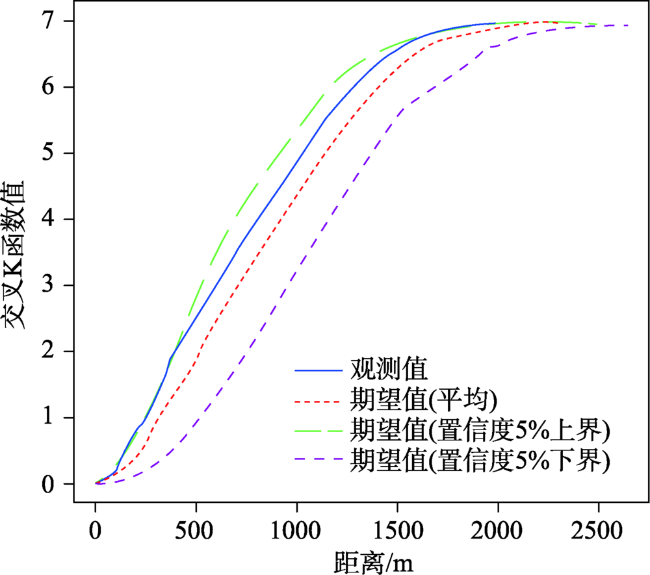
Fig.5 Network cross K-function for restaurant and bus station

图5 餐饮店与公交站交叉K函数曲线

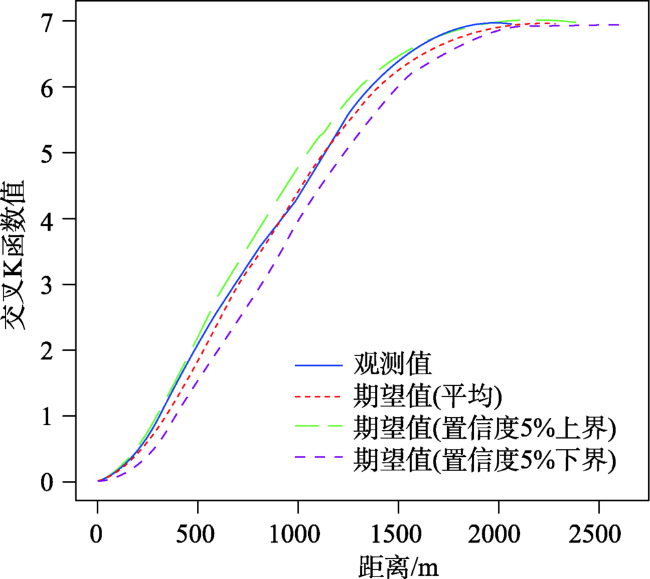
Fig. 6 Network cross K-function for restaurant and residential areas

图6 餐饮店与住宅小区交叉K函数曲线

5 结论

根据广州市海珠区餐饮店POI数据,利用核密度估计法得到其总体分布特征和街道热点路段分布特征,并利用网络双变量K函数法分析了影响餐饮业分布的主要因素。研究发现,海珠区餐饮店呈现“西密东疏”的空间分布模式,具有多中心的空间分布特征。其中,江南中街道、赤岗街道、凤阳街道为餐饮店分布的高密度区。在江南中街道道路网络空间中,餐饮店的热点路段主要集中在江南西路和江南大道中沿线,且餐饮店密度随着与该沿线距离的增大而减小。通过网络核密度估计,可以清晰准确地研究空间点模式平面过饱和分布区域,弥补传统核密度估计的不足。进而,探讨了餐饮店分布与公交站和居民小区的相关性。餐饮店分布与公交站点在较小尺度下表现出显著的聚集关系,二者相关性较大;而在不同尺度下,与居民小区的相关性小,相互聚集关系不具有显著性。本研究成果为城市餐饮业选址、布局等提供参考依据。
根据实地调研,结果符合现实规律,研究表明网络空间点模式方法是进行城市服务设施点模式分析的有效方法,能更加客观地反映出地理对象的分布模式及其空间相互关系。本研究道路网络数据来源于人工矢量化,道路转向、出口等限制因子拟在后续研究中进一步探讨;其次,选用的影响因子主要是路网交通站点和居民区,今后研究中还需进一步增加人口、经济等数据进行探究,并拓宽研究范围。

The authors have declared that no competing interests exist.

[1]
Diggle P J.Statistical analysis of spatial point pattern[M]. New York: Academic Press, 1983.

[2]
郭仁忠. 空间分析[M].武汉:武汉测绘科技大学出版社,2000.

[ Guo R Z.Spatial analysis[M]. Wuhan: Wuhan University of Surveying and Mapping Science and Technology Press, 2000. ]

[3]
Bailey T, Gatrell A.Interactive spatial data analysis[M]. Harlow: Longman, 1995.

[4]
Lotwick H W, Silverman B W.Methods for analysing spatial processes of several types of points[J]. Journal of the Royal Statistical Society, 1982,44(3):406-413.Two approaches are described to the analysis of spatial patterns consisting of several types of points. The first approach uses a method of asymptotically unbiased estimation of the second moment distribution; the second uses methods based on regions of empty space in the patterns. Some distributional results are given in each case, and a method of Monte Carlo testing conditional on the marginal structure is described. The methods are illustrated by being applied to some physiological data.

[5]
张珣,钟耳顺,张小虎,等. 2004-2008年北京城区商业网点空间分布与集聚特征[J].地理科学进展,2013,32(8):1207-1215.本文以北京城区内的8 个行政区作为研究对象,选取批发和零售业、住宿和餐饮业、居民服务与其他服务业作为具体的商业类别,利用北京第一次、第二次全国经济普查数据,采用核密度(Kernel)、标准差椭圆、Ripley's <i>K(r)</i>函数相结合的GIS 点模式分析方法,对比研究了2004 年和2008 年北京市商业网点分布与空间集聚特征。研究结果表明:① 北京商业网点呈现相对集中分布态势,具有向心性并形成明显的集聚区,集聚中心主要分布在五环内,且在两次普查期间有所改变,商业网点空间偏向性差异明显;② 以CBD、金融街、王府井、中关村、亚运村和奥运村等为代表的典型商圈对北京商业网点的布局影响十分显著,商业网点在典型商圈周围分布密度较高,呈现集聚中心状态;③ 北京商业网点Ripley's <i>K(r)</i>曲线随距离的变化总体呈现“先增后减”态势,其中受居民小区影响较大的居民服务与其他服务业网点两次普查期间变化剧烈,反映了居民由市中心向外扩散的过程。

DOI

[ Zhang X, Zhong E S, Zhang X H,et al.Spatial distribution and clustering of commercial network in Beijing during 2004-2008[J]. Progress in Geography, 2013,32(8):1207-1215. ]

[6]
王士君,浩飞龙,姜丽丽.长春市大型商业网点的区位特征及其影响因素[J].地理学报,2015,70(6):893-905.

[ Wang S J, Hao F L, Jiang L L.Locations and their determinants of large-scale commercial sites in Changchun, China[J]. Acta Geographica Sinica, 2015,70(6):893-905. ]

[7]
Lu Y M, Chen X W.On the false alarm of planar K-function when analyzing urban crime distributed distributed along streets[J]. Social Science Research, 2007,36(2):611-632.Many social and economic activities, especially those in urban areas, are subject to location restrictions imposed by existing street networks. To analyze the spatial patterns of these urban activities, the restrictions imposed by the street networks need to be taken into account. -function is a method commonly used for general point pattern analysis as well as crime pattern study. However, applying the planar -function to analyze the spatial autocorrelation patterns of urban activities that are typically distributed along streets could result in false alarm problems. Depending on the nature of the urban street networks and the distribution of the urban activities, either positive or negative false alarm might be introduced. Acknowledging that many urban crimes are typically distributed along streets, this paper compares the traditional planar -function with a network -function for crime pattern analysis. The patterns of vehicle thefts in San Antonio, Texas are examined as a case study.

DOI

[8]
Xie Z, Yan J.Kernel density estimation of traffic accidents in a network space[J]. Computers Environment & Urban Systems, 2008,32(5):396-406.A standard planar Kernel Density Estimation (KDE) aims to produce a smooth density surface of spatial point events over a 2-D geographic space. However, the planar KDE may not be suited for characterizing certain point events, such as traffic accidents, which usually occur inside a 1-D linear space, the roadway network. This paper presents a novel network KDE approach to estimating the density of such spatial point events. One key feature of the new approach is that the network space is represented with basic linear units of equal network length, termed lixel (linear pixel), and related network topology. The use of lixel not only facilitates the systematic selection of a set of regularly spaced locations along a network for density estimation, but also makes the practical application of the network KDE feasible by significantly improving the computation efficiency. The approach is implemented in the ESRI ArcGIS environment and tested with the year 2005 traffic accident data and a road network in the Bowling Green, Kentucky area. The test results indicate that the new network KDE is more appropriate than standard planar KDE for density estimation of traffic accidents, since the latter covers space beyond the event context (network space) and is likely to overestimate the density values. The study also investigates the impacts on density calculation from two kernel functions, lixel lengths, and search bandwidths. It is found that the kernel function is least important in structuring the density pattern over network space, whereas the lixel length critically impacts the local variation details of the spatial density pattern. The search bandwidth imposes the highest influence by controlling the smoothness of the spatial pattern, showing local effects at a narrow bandwidth and revealing ot spots at larger or global scales with a wider bandwidth. More significantly, the idea of representing a linear network by a network system of equal-length lixels may potentially lead the way to developing a suite of other network related spatial analysis and modeling methods.

DOI

[9]
Xie Z, Yan J.Detecting traffic accident clusters with network kernel density estimation and local spatial statistics:an integrated approach[J]. Journal of Transport Geography, 2013,31(5):64-71.Kernel density estimation (KDE) has long been used for detecting traffic accident hot spots and network kernel density estimation (NetKDE) has proven to be useful in accident analysis over a network space. Yet, both planar KDE and NetKDE are still used largely as a visualization tool, due to the missing of quantitative statistical inference assessment. This paper integrates NetKDE with local Moran’I for hot spot detection of traffic accidents. After density is computed for road segments through NetKDE, it is then used as the attribute for computing local Moran’s I. With an NetKDE-based approach, conditional permutation, combined with a 100-m neighbor for Moran’s I computation, leads to fewer statistically significant “high-high” (HH) segments and hot spot clusters. By conducting a statistical significance analysis of density values, it is now possible to evaluate formally the statistical significance of the extensiveness of locations with high density values in order to allocate limited resources for accident prevention and safety improvement effectively.

DOI

[10]
禹文豪,艾廷华.核密度估计法支持下的网络空间POI点可视化与分析[J].测绘学报,2015,44(1):82-90.lt;p>城市空间POI点的分布模式、分布密度在基础设施规划、城市空间分析中具有重要意义, 表达该特征的核密度法(kernel density estimation)由于顾及了地理学第一定律的区位影响,比其他密度表达方法(如样方密度、基于Voronoi图密度)占优.然而,传统的核密度计算方法往往基于二维延展的欧氏空间,忽略了城市网络空间中设施点的服务功能及相互联系发生于网络路径距离而非欧氏距离的事实.本研究针对该缺陷,给出了网络空间核密度计算模型,分析了核密度方法在置入网络结构中受多种约束条件的扩展模式,讨论了衰减阈值及高度极值对核密度特征表达的影响.通过实际多种POI点分布模式(随机型、稀疏型、区域密集型、线状密集型)下的核密度分析试验,讨论了POI基础设施在城市区域中的分布特征、影响因素、服务功能.</p>

DOI

[ Yu W H, Ai Y H.The visualization and analysis of POI features under network space supported by kernel density estimation[J]. Acta Geodaetica et Cartographica Sinica, 2015,44(1):82-90. ]

[11]
郑滋椀. 基于道路网络的犯罪时空分布特征与可视化研究[D].杭州:浙江大学,2016.

[ Zheng Z W.Research on spatio-temporal characteristics of crime and visualization based on street-network[D]. Hangzhou: Zhe Jiang University, 2016. ]

[12]
Yamada I, Thill J C.Local indicators of network-constrained clusters in spatial point patterns[J]. Geographical Analysis, 2007,39(3):268-292.The detection of clustering in a spatial phenomenon of interest is an important issue in spatial pattern analysis. While traditional methods mostly rely on the planar space assumption, many spatial phenomena defy the logic of this assumption. For instance, certain spatial phenomena related to human activities are inherently constrained by a transportation network because of our strong dependence on the transportation system. This article thus introduces an exploratory spatial data analysis method named l ocal i ndicators of n etwork-constrained c luster s (LINCS), for detecting local-scale clustering in a spatial phenomenon that is constrained by a network space. The LINCS method presented here applies to a set of point events distributed over the network space. It is based on the network K -function, which is designed to determine whether an event distribution has a significant clustering tendency with respect to the network space. First, an incremental K -function is developed so as to identify cluster size more explicitly than the original K -function does. Second, to enable identification of cluster locations, a local K -function is derived by decomposing and modifying the original network K -function. The local K -function LINCS, which is referred to as KLINCS, is tested on the distribution of 1997 highway vehicle crashes in the Buffalo, NY area. Also discussed is an adjustment of the KLINCS method for the nonuniformity of the population at risk over the network. As traffic volume can be seen as a surrogate of the population exposed to a risk of vehicle crashes, the spatial distribution of vehicle crashes is examined in relation to that of traffic volumes on the network. The results of the KLINCS analysis are validated through a comparison with priority investigation locations (PILs) designated by the New York State Department of Transportation.

DOI

[13]
Okabe A, Yamada I.The K-function method on a network and its computational implementation[J]. Geographical Analysis, 2001,33(3):271-290.This paper proposes two statistical methods, called the network K-function method and the network cross K-function method, for analyzing the distribution of points on a network. First, by extending the ordinary K-function method defined on a homogeneous infinite plane with the Euclidean distance, the paper formulates the K-function method and the cross K-function method on a finite irregular network with the shortest-path distance. Second, the paper shows advantages of the network K-function methods, such as that the network K-function methods can deal with spatial point processes on a street network in a small district, and that they can exactly take the boundary effect into account. Third, the paper develops the computational implementation of the network K-functions, and shows that the computational order of the K-function method is O(n2Q log nQ) and that of the network cross K-function is O(nQ log U3Q), where nQ is the number of nodes of a network.

DOI

[14]
Okabe A, Okunuki K I, Shiode S.SANET: A toolbox for spatial analysis on a network[J]. Geographical Analysis, 2006,38(1):57-66.This article shows a geographical information systems (GIS)-based toolbox for analyzing spatial phenomena that occur on a network (e.g., traffic accidents) or almost along a network (e.g., fast-food stores in a downtown). The toolbox contains 13 tools: random point generation on a network, the Voronoi diagram, the K -function and cross K -function methods, the unconditional and conditional nearest-neighbor distance methods, the Hull model, and preprocessing tools. The article also shows a few actual analyses carried out with these tools.

DOI

[15]
Sugihara K, Okabe A, Satoh T.Computational method for the point cluster analysis on networks[J]. Geoinformatica, 2011,15(1):167-189.AbstractWe present a general framework of hierarchical methods for point cluster analysis on networks, and then consider individual clustering procedures and their time complexities defined by typical variants of distances between clusters. The distances considered here are the closest-pair distance, the farthest-pair distance, the average distance, the median-pair distance and the radius distance. This paper will offer a menu for users to choose hierarchical clustering algorithms on networks from a time complexity point of view.

DOI

[16]
Garrocho-Rangel C.Calculating intraurban agglomeration of economic units with planar and network K -functions: A comparative analysis[J]. Urban Geography, 2013,34(2):261-286.

DOI

[17]
杨珏婕,刘世梁,赵清贺,等.基于网络K函数的西双版纳人工林空间格局及动态[J].生态学报,2011,31(22):6734-6742.区域植被格局的分布特征受诸多要素影响,但其空间格局和动态具有一定规律或自相关性,道路网络作为景观中显著的人工线性要素,在很大程度上影响着区域的植被格局特征,特别是人工植被的分布特征。运用网络<em>K</em>函数,分析了道路网络和人工林空间格局分布的相互关系,并且用二元网络<em>K</em>函数研究了人工林扩展对针叶林和阔叶林的影响。结果表明:人工林在1970-2000年间种群分布格局有非常明显的变化,特别是从1990到2000年,种群面积不断扩大,主要从北部地区扩展到西北和东南地区。1970-1990年人工林扩展主要集中在低海拔的道路网络附近,沿道路网络呈现明显的集聚分布,公路效应明显。但后期逐渐向距公路较远、海拔较高的地区扩展,到2000年在大尺度下人工林斑块呈显著随机分布。同时,人工林面积的增长对针叶林影响显著,对阔叶林有影响但是并不显著。二元网络<em>K</em>函数表明,在1970到1990年人工林与针叶林沿道路网络在小尺度为负关联,在局部地区存在着竞争,但在大尺度上对环境条件的要求具有一致性为正关联。到2000年,在大尺度上人工林与针叶林的种群分布格局呈显著负相关,人工林面积的不断扩展导致了针叶林面积的下降。

[ Yang Y J, Liu S L, Zhao Q H, et al.Spatial and dynamic analysis of plantations in Xishuangbanna using network K-function[J]. Acta Ecologica Sinica, 2011,31(22):6734-6742. ]

[18]
邬伦,刘亮,田原,等.基于网络K函数法的地理对象分布模式分析——以香港岛餐饮业空间格局为例[J].地理与地理信息科学,2013,29(5):7-11.

[ Wu L,Liu L,Tian Y,et al.Spatial pattern analysis of geographic features using network K-Function methods with a case study of restaurant distribution in Hong Kong Island[J]. Geography and Geo-Information Science, 2013,29(5):7-11. ]

[19]
王结臣,卢敏,苑振宇,等.基于Ripley's K函数的南京市ATM网点空间分布模式研究[J].地理科学,2016,36(12):1843-1849. 运用Ripley’s K函数的相关理论,以南京市ATM网点为研究对象,分别从平面与网络空间两种视角,在中心城区范围与主城区范围两种空间尺度上,通过单变量K函数法分析ATM网点的分布模式,通过双变量K函数法分析ATM网点与地铁站点的空间关联情况,最后对计算结果进行评价与分析。研究表明,ATM网点在南京主城区与中心城区均呈现出较强的集聚状态;在一定的距离范围内,ATM网点与地铁站点之间也有较强的依赖关系。同时,对于沿着路网分布的地理空间点状对象而言,利用网络K函数法进行空间点模式分析比用平面K函数法更加符合实际情况。

[ Wang J C, Lu M, Yuan Z Y,et al. Point pattern analysis of ATMs distribution Based on Ripley's K-Function method in Nanjing City[J]. Scientia Geographica Sinica, 2016,36(12):1843-1849. ]

[20]
海珠年鉴. 广州市海珠区年鉴编纂委员会[M].广州:广东省经济出版社,2016.

[ Haizhu Yearbook.Guangzhou Haizhuqu District Yearbook Compilation Committee[M]. Guang Zhou: Guangdong Economic Press, 2016. ]

[21]
禹文豪,艾廷华,杨敏,等.利用核密度与空间自相关进行城市设施兴趣点分布热点探测[J].武汉大学学报·信息科学版,2016,41(2):221-227.

[ Yu W H, Ai Y H,Yang M,et al.Detecting“Hot Spots”of facility POIs based on kernel density estimation and spatial autocorrelation Technique[J]. Geomatics and Information Science of Wuhan University, 2016,41(2):221-227. ]

[22]
Ripley B D.Spatial Statistics[M]. New York: Wiley, 1981.

[23]
Ripley B D.The second-order analysis of stationary point processes[J]. Journal of Applied Probability, 1976,13(2):255-266.This paper provides a rigorous foundation for the second-order analysis of stationary point processes on general spaces. It illuminates the results of Bartlett on spatial point processes, and covers the point processes of stochastic geometry, including the line and hyperplane processes of Davidson and Krickeberg. The main tool is the decomposition of moment measures pioneered by Krickeberg and Vere-Jones. Finally some practical aspects of the analysis of point processes are discussed.

DOI

[24]
Spooner P G, Lunt I D, Okabe A, et al.Spatial analysis of roadside Acacia populations on a road network using the network K-function[J]. Landscape Ecology, 2004,19(5):491-499.Spatial patterning of plant distributions has long been recognised as being important in understanding underlying ecological processes. Ripley K-function is a frequently used method for studying the spatial pattern of mapped point data in ecology. However, application of this method to point patterns on road networks is inappropriate, as the K-function assumes an infinite homogenous environment in calculating Euclidean distances. A new technique for analysing the distribution of points on a network has been developed, called the network K-function (for univariate analysis) and network cross K-function (for bivariate analysis). To investigate its applicability for ecological data-sets, this method was applied to point location data for roadside populations of three Acacia species in a fragmented agricultural landscape of south-eastern Australia. Kernel estimations of the observed density of spatial point patterns for each species showed strong spatial heterogeneity. Combined univariate and bivariate network K-function analyses confirmed significant clustering of populations at various scales, and spatial patterns of Acacia decora suggests that roadworks activities may have a stronger controlling influence than environmental determinants on population dynamics. The network K-function method will become a useful statistical tool for the analyses of ecological data along roads, field margins, streams and other networks.

DOI

[25]
Besag J, Diggle P J.Simple monte carlo tests for spatialpattern[J]. Applied Statistics, 1977,26(3):327-333.The Monte Carlo approach to testing a simple null hypothesis is reviewed briefly and several example of its application to problems involving spatial distributions are presented. These include spatial point pattern, pattern similarity, space-time interaction and scales of pattern. The aim is not to present specific "recommended tests" but rather to illustrate the value of the general approach, particularly at a preliminary stage of analysis.

DOI

[26]
Galiano E F, Castro I, Sterling A.A test for spatial pattern in vegetation using a Monte-Carlo simulation[J]. Journal of Ecology, 1987,75(4):915-924.1) A Monte-Carlo test for spatial pattern in vegetation is presented, based on the random permutation of original abundance data recorded in belt transects. Monte-Carlo simulation allows the testing of null hypotheses and the estimation of confidence intervals for any previously defined pattern analysis statistics. (2) The test was applied with Hill's local variance and Galiano's new local variance analyses to six artificial sets of data and to data from Spanish oligotrophic grasslands in three different stages of ecological succession. (3) Results from the artificial data indicate that the method is capable of providing accurate information concerning dimensions and densities of species clumps. (4) Preliminary results from real data suggested the disappearance of pattern during successional time in those species remaining in the community.

DOI

[27]
Okabe A, Satoh T, Sugihara K.A kernel density estimation method for networks, its computational method and a GIS-based tool[J]. International Journal of Geographical Information Science, 2009,23(1):7-32.We develop a kernel density estimation method for estimating the density of points on a network and implement the method in the GIS environment. This method could be applied to, for instance, finding ‘hot spots’ of traffic accidents, street crimes or leakages in gas and oil pipe lines. We first show that the application of the ordinary two‐dimensional kernel method to density estimation on a network produces biased estimates. Second, we formulate a ‘natural’ extension of the univariate kernel method to density estimation on a network, and prove that its estimator is biased; in particular, it overestimates the densities around nodes. Third, we formulate an unbiased discontinuous kernel function on a network. Fourth, we formulate an unbiased continuous kernel function on a network. Fifth, we develop computational methods for these kernels and derive their computational complexity; and we also develop a plug‐in tool for operating these methods in the GIS environment. Sixth, an application of the proposed methods to the density estimation of traffic accidents on streets is illustrated. Lastly, we summarize the major results and describe some suggestions for the practical use of the proposed methods.

DOI

Outlines

/