
Journal of Geo-information Science >
Analysis of Anthropogenic Heat Discharge of Urban Functional Regions Based on Surface Energy Balance in Xiamen Island
Received date: 2017-09-26
Request revised date: 2018-02-12
Online published: 2018-07-13
Supported by
National Natural Science Foundation of China, No.41371392, 71573242 ,71273252
Copyright
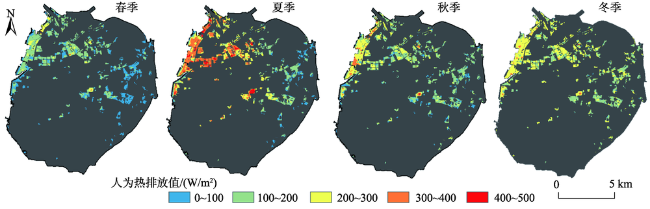
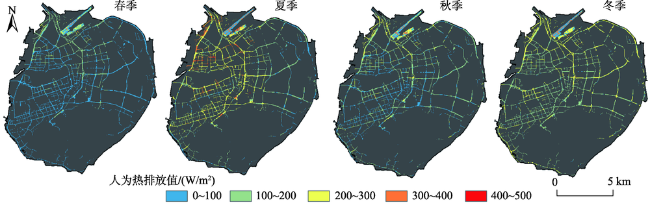
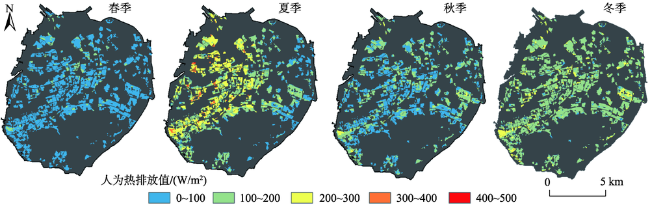
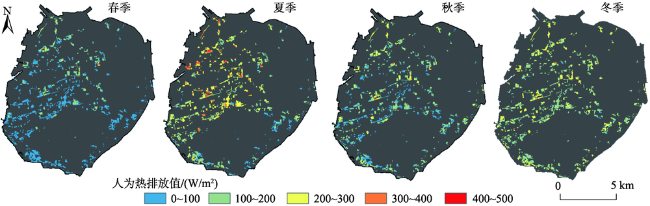
Anthropogenic heat discharge not only constitutes the cause of urban heat island (UHI) formation, but also is an important indicator related to energy consumption. It is important to analysis the magnitude and variation of anthropogenic heat discharge in order to mitigate UHI effect and improve energy efficiency. This paper examined the spatio-temporal variation of anthropogenic heat discharge in the Xiamen Island, China using Landsat TM data and meteorological data. First, the anthropogenic heat discharge was estimated with a remote sensing-based surface energy balance model. Then, the urban functional regions derived from IKONOS data were combined with the anthropogenic heat discharge. The results indicate that the anthropogenic heat discharge in different types of urban functional regions reaches the maximum in summer and the minimum in spring. The anthropogenic heat discharge of industrial area was higher than those in the other regions for all seasons. The high anthropogenic heat discharge occurred in the old industrial bases in the west of Xiamen Island. In traffic area, high anthropogenic heat discharge was observed in the Changan Road, Jiahe Road, Chenggong Avenue, Xianyue Road, North Hubin Road-Lvling Road, South Hubin Road-East Lianqian Road. In residential area, high anthropogenic heat discharge was observed in the old town. The high anthropogenic heat discharge occurred in the large single buildings in commercial and public area. Overall, the anthropogenic heat discharge in the western part of Xiamen Island was higher than that in the east. The differences of spatial and seasonal distribution were closely related to land cover types, population and the degree of economic development. Moreover, the density and height of the buildings and materials of land cover change the amount of anthropogenic heat discharge by affecting other surface fluxes. This paper brings a more microscopic perspective by analyzing the spatio-temporal variation of anthropogenic heat discharge in different urban functional regions to study urban thermal environment and energy utilization, as well as to provide a theoretical basis for promoting urban sustainable development.
LIU Jiahui , ZHAO Xiaofeng , LIN Jianyi . Analysis of Anthropogenic Heat Discharge of Urban Functional Regions Based on Surface Energy Balance in Xiamen Island[J]. Journal of Geo-information Science, 2018 , 20(7) : 1026 -1036 . DOI: 10.12082/dqxxkx.2018.170450
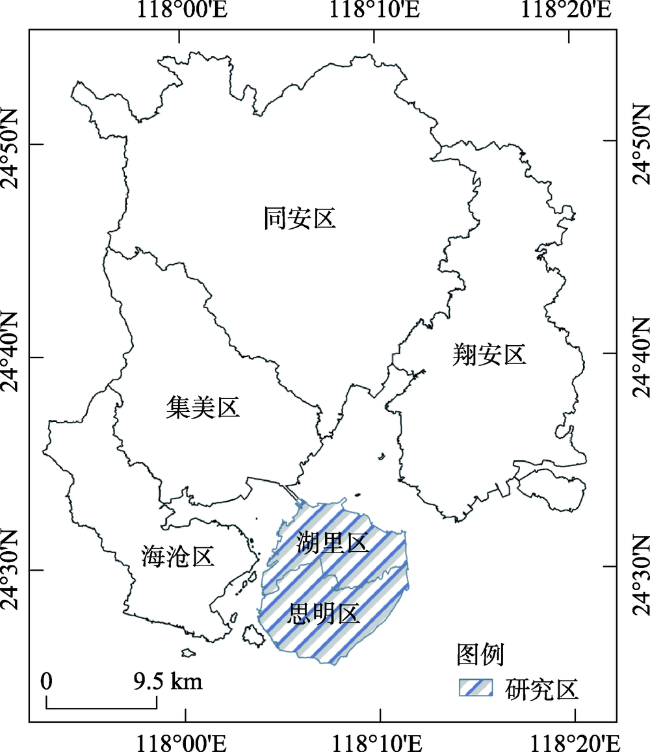
Fig. 1 The study area of Xiamen Island图1 研究区概况图 |
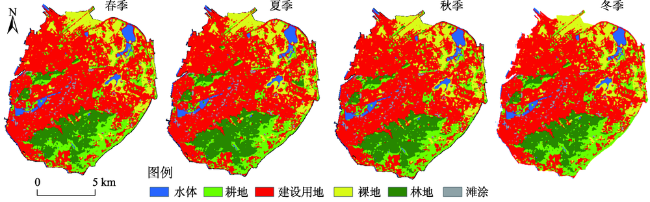
Fig. 2 Land use and cover classification maps of Xiamen Island in four seasons in 2009 derived from the TM data图2 2009年厦门岛不同季节TM影像土地利用分类结果图 |
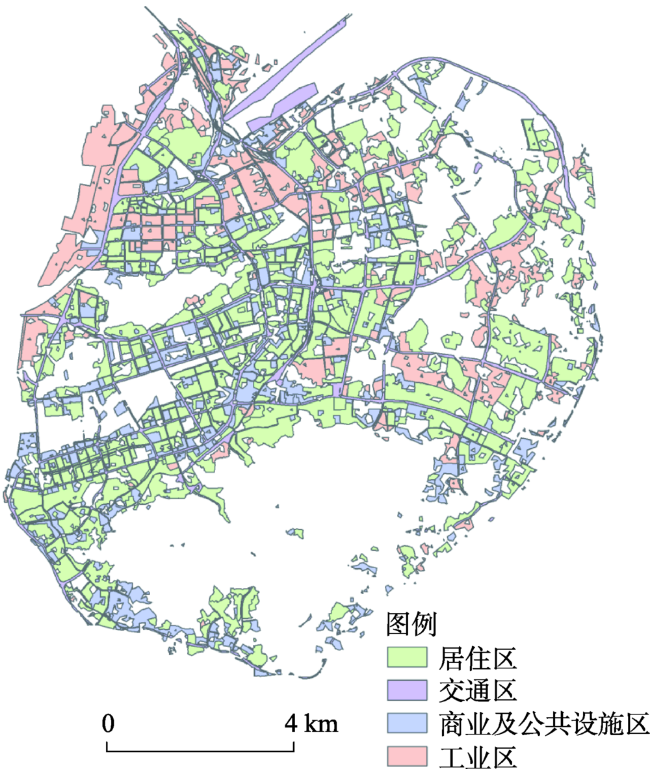
Fig. 3 Land use and cover classification maps of Xiamen Island in 2009 derived from the IKONOS data图3 2009年厦门岛IKONOS影像土地利用分类结果图 |
Tab. 1 Meteorological data表1 气象数据 |
| 时间 | 气象数据 | |||
|---|---|---|---|---|
| 大气压/hpa | 大气温度/℃ | 风速/(m/s) | 水汽压/hpa | |
| 2009-01-13(冬) | 1016.6 | 9.2 | 3.4 | 5.1 |
| 2009-03-18(春) | 998.3 | 20.8 | 1.9 | 16 |
| 2009-06-06(夏) | 1001.7 | 28.9 | 1.8 | 20.7 |
| 2010-10-31(秋) | 1019.4 | 21.3 | 2.4 | 8.9 |
Tab. 2 Coefficient cg for different surface coverage types and seasons表2 不同土地覆盖类型和不同季节的cg值 |
| 分类 | 月份 | |||
|---|---|---|---|---|
| 1 | 3 | 6 | 10 | |
| 建设用地 | 0.9 | 0.7 | 0.6 | 0.7 |
| 裸地 | 0.3 | 0.3 | 0.3 | 0.3 |
| 水体 | 0.2 | 0.2 | 0.2 | 0.2 |
| 农田 | 0.3 | 0.3 | 0.3 | 0.3 |
| 林地 | 0.13 | 0.15 | 0.15 | 0.15 |
| 滩涂 | 0.3 | 0.3 | 0.3 | 0.3 |
Tab. 3 ɛ 、Z0m、Z0h and d for different surface coverage types表3 不同土地利用类型的ɛ 、Z0m、Z0h和d的值 |
| 分类 | 建设用地 | 裸地 | 水体 | 农田 | 林地 | 滩涂 |
|---|---|---|---|---|---|---|
| ɛ | 0.967 | 0.975 | 0.995 | 0.985 | 0.986 | 0.998 |
| Z0m | 0.33 | 0.001 | 0.00003 | 0.1 | 0.3 | 0.001 |
| Z0h | 0.0033 | 0.00002 | 0.000088 | 0.001 | 0.0003 | 0.00002 |
| d | 1.66 | 0.05 | 0.05 | 0.1 | 1.5 | 0.05 |
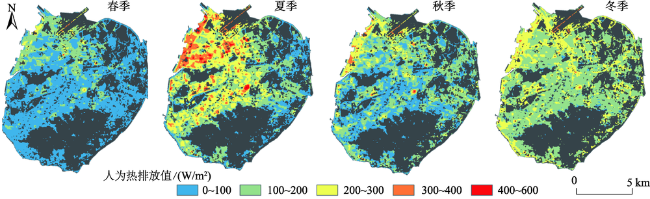
Fig. 4 Anthropogenic heat discharge distribution for built-up area of Xiamen Island in four seasons in 2009图4 2009年不同季节厦门岛建成区人为热排放分布图 |
Tab. 4 Averages and maximums of anthropogenic heat discharge for different types of urban functional regions on four seasons表4 四季不同类型城市功能区人为热排放的平均值和最大值(W/m2) |
| 城市功能区 | 春季 | 夏季 | 秋季 | 冬季 | |||||||
|---|---|---|---|---|---|---|---|---|---|---|---|
| 平均值 | 最大值 | 平均值 | 最大值 | 平均值 | 最大值 | 平均值 | 最大值 | ||||
| 工业区 | 96.8 | 298.1 | 223.7 | 513.5 | 158.5 | 374.1 | 197.7 | 394.7 | |||
| 交通区 | 48.1 | 294.7 | 182.4 | 447.9 | 115.3 | 368.9 | 184.1 | 396.5 | |||
| 居住区 | 20.1 | 247.7 | 159.8 | 433.6 | 82.2 | 290.4 | 154.3 | 321.5 | |||
| 商业及公共设施区 | 27.9 | 258.3 | 172.9 | 430.2 | 103.4 | 350.7 | 165.8 | 370.2 | |||
Fig. 5 Anthropogenic heat discharge distribution for industrial area of Xiamen Island in four seasons in 2009图5 2009年不同季节工业区人为热排放分布图 |
Fig. 6 Anthropogenic heat discharge distribution for traffic area of Xiamen Island in four seasons in 2009图6 2009年不同季节交通区人为热排放分布图 |
Fig. 7 Anthropogenic heat discharge distribution for residential area of Xiamen Island in four seasons in 2009图7 2009年不同季节居住区人为热排放分布图 |
Fig. 8 Anthropogenic heat discharge distribution for commercial and public area of Xiamen Island in four seasons in 2009图8 2009年不同季节商业及公共设施区人为热排放分布图 |
Tab. 5 Heat fluxes ratios to net radiation between the present study and previous studies表5 本研究与其他研究的地表通量占净辐射比例结果对比 |
| 研究区 | 时间 | H/Rn | LE/Rn | A |
|---|---|---|---|---|
| 厦门岛 | 2009-01-13 | 0.47 | 0.02 | 103.3 |
| 2009-03-18 | 0.25 | 0.01 | 34.4 | |
| 2009-06-06 | 0.38 | 0.02 | 106.6 | |
| 2010-10-31 | 0.34 | 0.02 | 66 | |
| 印第安纳波利斯[15,36] | 2012-10-11 | 0.39 | 0.18 | - |
| 2001-06-16 | 0.28 | 0.23 | 78 | |
| 名古屋[16] | 2000-07-10 | 0.56 | 0.02 | 99 |
| 2000-12-08 | 0.46 | 0.02 | 82 |
注:-表示参考文献中无该值的结果 |
The authors have declared that no competing interests exist.
| [1] |
|
| [2] |
|
| [3] |
|
| [4] |
|
| [5] |
|
| [6] |
|
| [7] |
|
| [8] |
|
| [9] |
|
| [10] |
|
| [11] |
[
|
| [12] |
|
| [13] |
[
|
| [14] |
|
| [15] |
|
| [16] |
|
| [17] |
|
| [18] |
|
| [19] |
[
|
| [20] |
[
|
| [21] |
[
|
| [22] |
厦门市统计局. 2009年厦门经济特区年鉴[M].北京:中国统计出版社,2009.
[
|
| [23] |
|
| [24] |
|
| [25] |
|
| [26] |
|
| [27] |
|
| [28] |
|
| [29] |
|
| [30] |
|
| [31] |
|
| [32] |
|
| [33] |
|
| [34] |
|
| [35] |
|
| [36] |
|
| [37] |
[
|
| [38] |
[
|
| [39] |
|
/
| 〈 |
|
〉 |