
Journal of Geo-information Science >
Spatial and Temporal Differentiation of Ecological Vulnerability of Xijiang River in Guangxi and Its Driving Mechanism
Received date: 2017-12-26
Request revised date: 2018-02-06
Online published: 2018-07-13
Supported by
National Natural Science Foundation of China, No.41661021, 41361022;Guangxi Natural Fund Innovative Team Project, No.2016JJF15001;Guangxi Science and Technology Development Project, No.14125008-2-24
Copyright
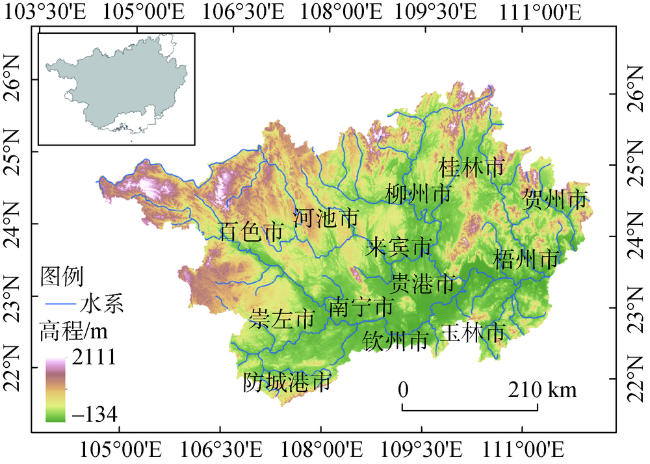
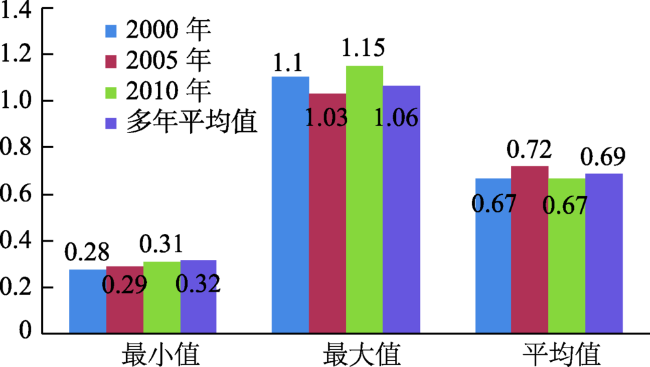
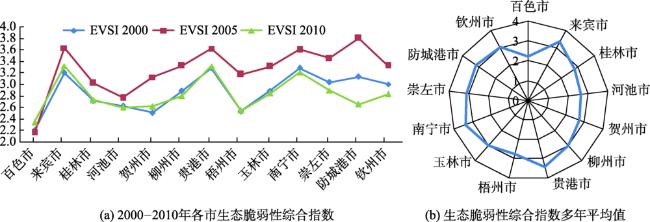
As a hydrologic unit with dense population, abundant resource and intensive capital, the stability of ecosystem structure of a basin lays the foundation of regional economy's development. Influenced by ecosystem's evolution together with human being's activities, the basin environment becomes more and more sensitive and vulnerable. In case of Xijiang River in Guangxi, the thesis is to make an analysis on the cause of its ecological vulnerability and construct evaluation indexes system with eleven indices under the framework of sensitivity-pressure-recovery. Supported by GIS technology, the ecological vulnerability index(EVI)was calculated and analyzed by Principal Component Analysis and difference method, which probes into the spatial and temporal characteristics of ecological vulnerability change from 2000 to 2010. Based on the factor and the interaction detect modules of geographical detector, it aims to analyze the explanatory power of impact factors on ecological vulnerability and the driving forces of factor interaction to the changes of ecological vulnerability in the basin. The results are as following: from 2000 to 2010, the ecological vulnerability index means kept at 0.69 for years, which was at moderate vulnerability. Spatially, the central basin is more sensitive than the surround area showing a declining trend from center to suburbs. The maximum of the average ecological vulnerability composite index of the whole basin for 2000-2010, is 3.40 at Guigang City. The minimum is 2.23 at Baise City. During the past ten years, the ecological fragility of the basin showed a slight deterioration. In year 2005, central and eastern parts of the basin were influenced by high temperature, which led to the higher ecological vulnerability comprehensive index in 2005 than other years. The order of the explanatory power intensity of the six factors on the ecological vulnerability is as follows: biological abundance index (0.475)>temperature at high temperature season (0.340)>vegetation coverage (0.211)>NPP (0.183)>rainfall erosivity (0.098)>Rainfall in flood season (0.030), and the explanatory power on results will be strengthened by factors cooperative interaction.
WANG Yu , HU Baoqing . Spatial and Temporal Differentiation of Ecological Vulnerability of Xijiang River in Guangxi and Its Driving Mechanism[J]. Journal of Geo-information Science, 2018 , 20(7) : 947 -956 . DOI: 10.12082/dqxxkx.2018.170633
Fig.1 Topography of the study area图1 研究区地势状况图 |
Tab. 1 Ecological vulnerability evaluation indexes system of Guangxi Xijiang river basin表1 广西西江流域生态脆弱性评价指标体系 |
| 目标层 | 要素层 | 指标层 | 指标性质 |
|---|---|---|---|
| 生态脆弱性 | 生态敏感性 | 高程 | 正向 |
| 地形起伏度 | 正向 | ||
| 植被覆盖度 | 负向 | ||
| 汛期降雨量 | 正向 | ||
| 高温季节温度 | 正向 | ||
| 降雨侵蚀力 | 正向 | ||
| 景观干扰度 | 正向 | ||
| 生态压力度 | 人口密度 | 正向 | |
| 生态恢复力 | 植被净初级生产力 | 负向 | |
| 生物丰度指数 | 负向 | ||
| 经济密度 | 负向 |
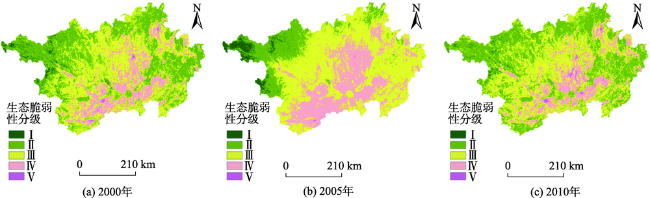
Tab. 2 Ecological vulnerability classification criterion of Guangxi Xijiang river basin表2 广西西江流域生态脆弱性分级标准 |
| 脆弱性等级 | 生态脆弱性指数标准化值 | 脆弱程度 | 生态特征 |
|---|---|---|---|
| Ⅰ | < 0.2 | 潜在脆弱 | 生态系统功能完整,对各类干扰敏感性弱,承受生态压力小,自我恢复能力强,无生态异常出现 |
| Ⅱ | 0.2-0.4 | 微度脆弱 | 生态系统功能较为完善,对各类干扰敏感性较弱,承受生态压力较小,自我恢复能力强,存在潜在的生态异常 |
| Ⅲ | 0.4-0.6 | 轻度脆弱 | 生态系统功能尚可维持,对各类干扰敏感性中等,承受生态压力接近阈值,自我恢复力较弱,出现少量生态异常 |
| Ⅳ | 0.6-0.8 | 中度脆弱 | 生态系统功能部分退化,对各类干扰敏感性较强,承受生态压力较大,受损后恢复难度较大,生态异常较多 |
| Ⅴ | > 0.8 | 重度脆弱 | 生态系统功能退化严重,对各类干扰敏感性强,承受生态压力大,受损后恢复难度极大,生态异常集中连片出现 |
Tab. 3 Type of interactive detection表3 交互探测类型 |
| 判断依据 | 交互作用 |
|---|---|
| P(X1∩X2)<min(P(X1),P(X2)) | 非线性减弱 |
| min(P(X1),P(X2))<P(X1∩X2)<max(P(X1),P(X2)) | 单线性减弱 |
| P(X1∩X2)>max(P(X1),P(X2)) | 双线性增强 |
| P(X1∩X2)= P(X1)+P(X2) | 相互独立 |
| P(X1∩X2)>P(X1)+P(X2) | 非线性增强 |
Tab. 4 Eigenvalue, contribution rate and accumulated contribution rate of principal components表4 各主成分的特征值、贡献率及累计贡献率表 |
| 年份 | 主成分系数 | 主成分 | ||||
|---|---|---|---|---|---|---|
| PC1 | PC2 | PC3 | PC4 | PC5 | ||
| 2000 | 特征值 λ | 0.0390 | 0.0219 | 0.0155 | 0.0095 | 0.0073 |
| 贡献率/% | 37.4154 | 21.0766 | 14.8903 | 9.1736 | 7.0614 | |
| 累计贡献率/% | 37.4154 | 58.4920 | 73.3823 | 82.5559 | 89.6173 | |
| 2005 | 特征值 λ | 0.0362 | 0.0198 | 0.0105 | 0.0087 | 0.0079 |
| 贡献率/% | 38.4644 | 20.9905 | 11.2189 | 9.2838 | 8.4047 | |
| 累计贡献率/% | 38.4644 | 59.4549 | 70.6738 | 79.9575 | 88.3623 | |
| 2010 | 特征值 λ | 0.0377 | 0.0224 | 0.0100 | 0.0089 | 0.0080 |
| 贡献率/% | 37.1375 | 22.0626 | 9.8852 | 8.7832 | 7.8885 | |
| 累计贡献率/% | 37.1375 | 59.2001 | 69.0854 | 77.8686 | 85.7570 | |
Fig. 2 Ecological vulnerability classification figure in 2000, 2005, 2010图2 2000、2005和2010年广西西江流域生态脆弱性分级图 |
Fig. 3 Histograms of the minimum, maximum and average ecological vulnerability of Xijiang River图3 广西西江流域生态脆弱性最小值、最大值及平均值直方图 |
Fig. 4 Ecological vulnerability composite index of cities in Xijiang river图4 广西西江流域内各市生态脆弱性综合指数 |
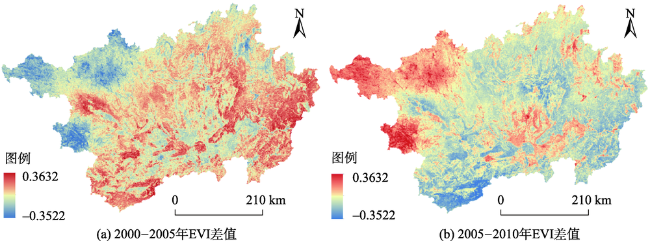
Fig.5 Ecological vulnerability change in Xijiang river图5 广西西江流域生态脆弱性指数变化分布图 |
Tab. 5 Interactive impact of factors on ecological vulnerability in Xijiang river表5 因子交互作用对广西西江流域生态脆弱性影响 |
| X1∩X2 | P(X1∩X2) | 判断 | 交互作用 |
|---|---|---|---|
| 生物丰度指数(0.475)∩高温季节温度(0.340) | 0.676 | P(X1∩X2)>max(P(X1),P(X2)) | 双线性增强 |
| 生物丰度指数(0.475)∩汛期降雨量(0.030) | 0.505 | P(X1∩X2)>max(P(X1),P(X2)) | 双线性增强 |
| 生物丰度指数(0.475)∩NPP(0.183) | 0.518 | P(X1∩X2)>max(P(X1),P(X2)) | 双线性增强 |
| 生物丰度指数(0.475)∩降雨侵蚀力(0.098) | 0.530 | P(X1∩X2)>max(P(X1),P(X2)) | 双线性增强 |
| 生物丰度指数(0.475)∩植被覆盖度(0.211) | 0.529 | P(X1∩X2)>max(P(X1),P(X2)) | 双线性增强 |
| 高温季节温度(0.340)∩汛期降雨量(0.030) | 0.351 | P(X1∩X2)>max(P(X1),P(X2)) | 双线性增强 |
| 高温季节温度(0.340)∩NPP(0.183) | 0.533 | P(X1∩X2)>P(X1)+P(X2) | 非线性增强 |
| 高温季节温度(0.340)∩降雨侵蚀力(0.098) | 0.368 | P(X1∩X2)>max(P(X1),P(X2)) | 双线性增强 |
| 高温季节温度(0.340)∩植被覆盖度(0.211) | 0.475 | P(X1∩X2)>max(P(X1),P(X2)) | 双线性增强 |
| 汛期降雨量(0.030)∩NPP(0.183) | 0.230 | P(X1∩X2)>P(X1)+P(X2) | 非线性增强 |
| 汛期降雨量(0.030)∩降雨侵蚀力(0.098) | 0.125 | P(X1∩X2)>max(P(X1),P(X2)) | 双线性增强 |
| 汛期降雨量(0.030)∩植被覆盖度(0.211) | 0.234 | P(X1∩X2)>max(P(X1),P(X2)) | 双线性增强 |
| NPP(0.183)∩降雨侵蚀力(0.098) | 0.286 | P(X1∩X2)>P(X1)+P(X2) | 非线性增强 |
| NPP(0.183)∩植被覆盖度(0.211) | 0.314 | P(X1∩X2)>max(P(X1),P(X2)) | 双线性增强 |
| 降雨侵蚀力(0.098)∩植被覆盖度(0.211) | 0.281 | P(X1∩X2)>max(P(X1),P(X2)) | 双线性增强 |
The authors have declared that no competing interests exist.
| [1] |
[
|
| [2] |
[
|
| [3] |
[
|
| [4] |
[
|
| [5] |
[
|
| [6] |
[
|
| [7] |
[
|
| [8] |
[
|
| [9] |
|
| [10] |
[
|
| [11] |
|
| [12] |
[
|
| [13] |
|
| [14] |
|
| [15] |
[
|
| [16] |
[
|
| [17] |
[
|
| [18] |
[
|
| [19] |
[
|
| [20] |
[
|
| [21] |
[
|
| [22] |
[
|
| [23] |
[
|
| [24] |
[
|
| [25] |
[
|
| [26] |
[
|
| [27] |
[
|
| [28] |
[
|
| [29] |
[
|
| [30] |
[
|
| [31] |
|
| [32] |
[
|
| [33] |
[
|
/
| 〈 |
|
〉 |