
Journal of Geo-information Science >
Spatio-temporal Variation and Interrelationship of Vegetation Cover and Soil Moisture in Qinling-Daba Mountains
Received date: 2017-12-11
Request revised date: 2018-03-08
Online published: 2018-07-13
Supported by
Shannxi Social Sciences Fund Project, No.2016G013;Key Project of Baoji University of Arts and Sciences, No.ZK16064;The Natural Science Basic Research Plan of Shaanxi Province under Grant, No.2018JQ4039
Copyright
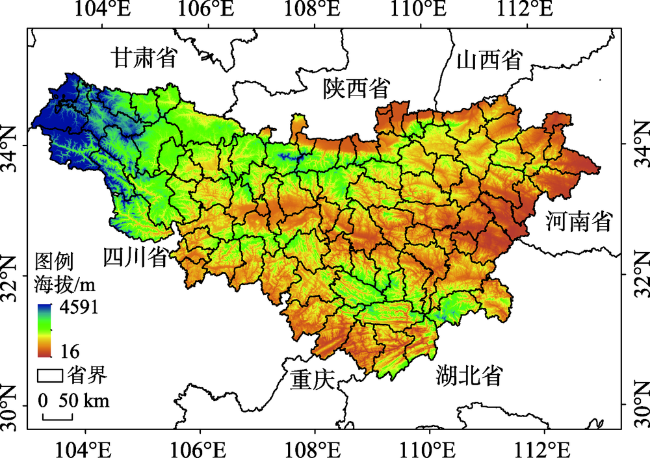
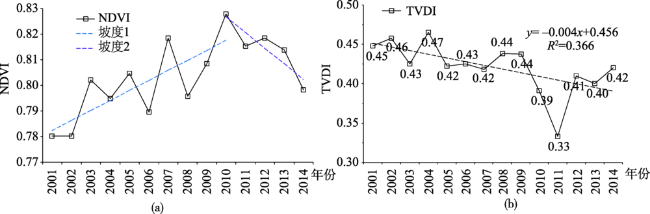
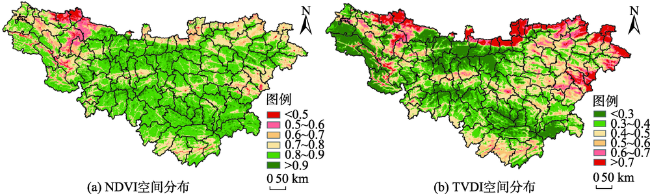
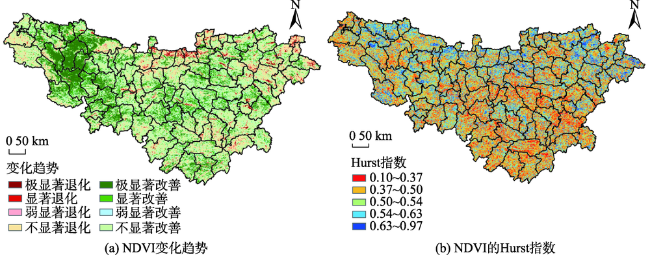
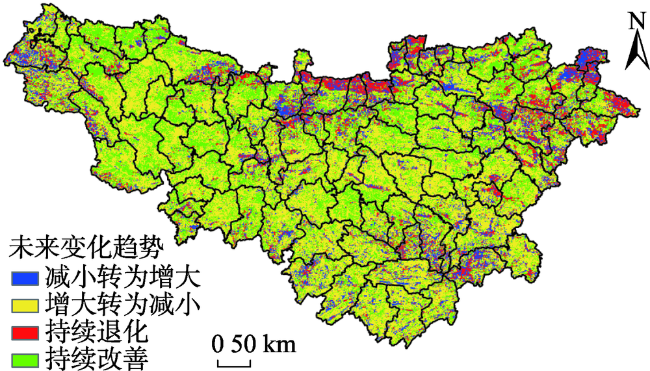
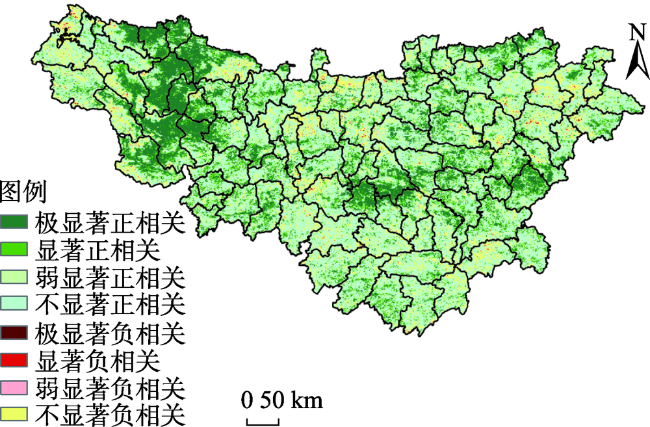
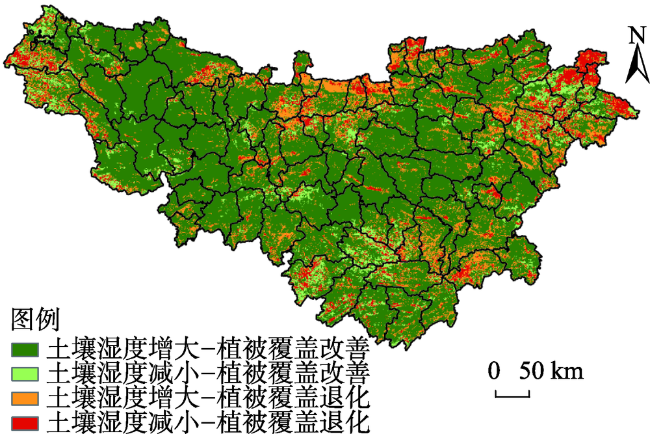
Qinling-Daba Mountains, as the geographical dividing line in central China, is the main water source area of the middle line project of transferring water from south to north, and also a sensitive area of the regional response to the global climate change. The spatio-temporal variation of vegetation, as a main component of terrestrial ecology system, represents the comprehensive response to climate change and human activities. Based on the MODIS data during 2001-2014, this study estimated the soil moisture using temperature vegetation dryness index, dynamically monitored the distribution characters and spatiotemporal variations of vegetation cover and soil moisture, analyzed its change trend, forecasted its future trend, and explored the interrelationship between vegetation cover and soil moisture in Qinling-Daba Mountains. The main conclusions are as follows: (1) Vegetation showed an increasing trend in Qinling-Daba Mountains during 2001-2014 years, as well as soil moisture, which respectively represented the best in 2010 and 2011, then both showed declining trends. (2) Vegetation distribution had a feature of “higher overall and lower in the middle”, while soil moisture with “lower in the north and higher in the south”, which showed a positive spatial correlation. (3) Vegetation had an obvious improving trend, and the significantly improved areas are dispersionally distributed, with no obvious concentration areas, and degraded areas were mainly concentrated in the north of Weihe River and a few areas along the eastern edge. Soil moisture increased significantly, and the increased areas distributed almost over the entire area except the northwest and northeast edge, and the reduced areas were small and not noticeable. The reverse variation of vegetation cover was stronger than continuous change, but soil moisture was just the opposite. In predicted future, in 44.36% of the study area, dispersed in entire area, the vegetation cover will undergo a process from increase to reduction, while soil moisture will continue to grow in 43.98% of the study area, including Qinling mountain in Shaanxi Province, Daba mountain in Sichuan province, and some parts of Jialing River basin and Han River. (4) The correlation between vegetation cover and soil moisture is positive. Nearly 69.71% of the study area showed an increasing tendency in both vegetation cover and soil moisture content, which was distributed in almost all parts of the study area except for the edges.
ZHAI Yaqian , ZHANG Chong , ZHOU Qi , CHANG Xiaoyi . Spatio-temporal Variation and Interrelationship of Vegetation Cover and Soil Moisture in Qinling-Daba Mountains[J]. Journal of Geo-information Science, 2018 , 20(7) : 967 -977 . DOI: 10.12082/dqxxkx.2018.170597
Fig. 1 Study area图1 研究区概况 |
Fig. 2 Temporal variation of NDVI and TVDI in Qinling-Daba Mountains图2 秦巴山区NDVI与TVDI年际变化趋势 |
Fig. 3 Spatial characteristics of NDVI and TVDI in Qinling-Daba Mountains图3 秦巴山区NDVI与TVDI空间分布特征 |
Tab. 1 Proportion of NDVI change types in Qinling-Daba Mountains表1 2001-2014年秦巴山区NDVI变化类型统计表 |
| 变化类型 | 所占面积/km2 | 面积百分比/% | 累计百分比/% |
|---|---|---|---|
| 极显著退化 | 3 080 | 1.20 | 1.20 |
| 显著退化 | 3 873 | 1.51 | 2.72 |
| 弱显著退化 | 3 258 | 1.27 | 3.99 |
| 不显著退化 | 43 992 | 17.19 | 21.18 |
| 极显著改善 | 35 440 | 13.85 | 35.03 |
| 显著改善 | 34 625 | 13.53 | 48.57 |
| 弱显著改善 | 22 191 | 8.67 | 57.24 |
| 不显著改善 | 109 413 | 42.76 | 100.00 |
Fig. 4 Spatial distribution of NDVI trend and Hurst in Qinling-Daba Mountains图4 秦巴山区NDVI变化趋势及Hurst指数分布 |
Fig. 5 Future trend of NDVI in Qinling-Daba Mountains图5 秦巴山区NDVI的未来变化特征 |
Tab. 2 Proportion of the types of TVDI change in Qinling-Daba Mountains表2 2001-2014年秦巴山区TVDI变化类型统计表 |
| 变化类型 | 所占面积/km2 | 面积百分比/% | 累计百分比/% |
|---|---|---|---|
| 极显著减小 | 22 904 | 8.95 | 8.95 |
| 显著减小 | 32 895 | 12.86 | 21.81 |
| 弱显著减小 | 23 077 | 9.02 | 30.83 |
| 不显著减小 | 132 290 | 51.70 | 82.53 |
| 极显著增大 | 234 | 0.09 | 82.62 |
| 显著增大 | 1039 | 0.41 | 83.02 |
| 弱显著增大 | 1385 | 0.54 | 83.57 |
| 不显著增大 | 42 051 | 16.43 | 100.00 |
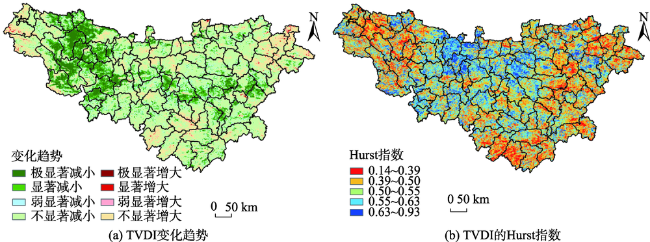
Fig. 6 Spatial distribution of TVDI trend and Hurst index in Qinling-Daba Mountains图6 秦巴山区TVDI变化趋势及Hurst指数分布 |
Fig. 8 The correlation between soil moisture and vegetation cover in Qinling-Daba Mountains图8 秦巴山区植被覆盖与土壤湿度相关分析 |
Fig. 9 Variation trend of vegetation cover under soil moisture change in Qinling-Daba Mountains图9 土壤湿度变化与植被覆盖变化的对应关系 |
The authors have declared that no competing interests exist.
| [1] |
[
|
| [2] |
[
|
| [3] |
[
|
| [4] |
[
|
| [5] |
[
|
| [6] |
[
|
| [7] |
[
|
| [8] |
[
|
| [9] |
|
| [10] |
[
|
| [11] |
[
|
| [12] |
|
| [13] |
[
|
| [14] |
[
|
| [15] |
[
|
| [16] |
[
|
| [17] |
[
|
| [18] |
[
|
| [19] |
[
|
| [20] |
[
|
| [21] |
[
|
| [22] |
[
|
| [23] |
[
|
| [24] |
|
| [25] |
[
|
| [26] |
[
|
| [27] |
|
/
| 〈 |
|
〉 |