
Journal of Geo-information Science >
Improved SWAT and Its Application to a Region with Severe Land Use / Land Cover Changes
Received date: 2017-12-13
Request revised date: 2018-04-09
Online published: 2018-08-24
Supported by
Natural Science Foundation of Qinghai Province, No.2017-ZJ-961Q
Foundation for Yong and Middle aged teachers of Qinghai Normal University, No.15ZR10
National Natural Science Foundation of China, No.D010102-91125010.
Copyright
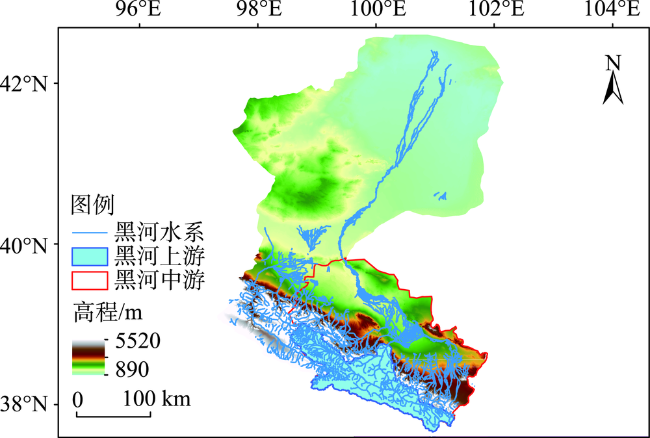
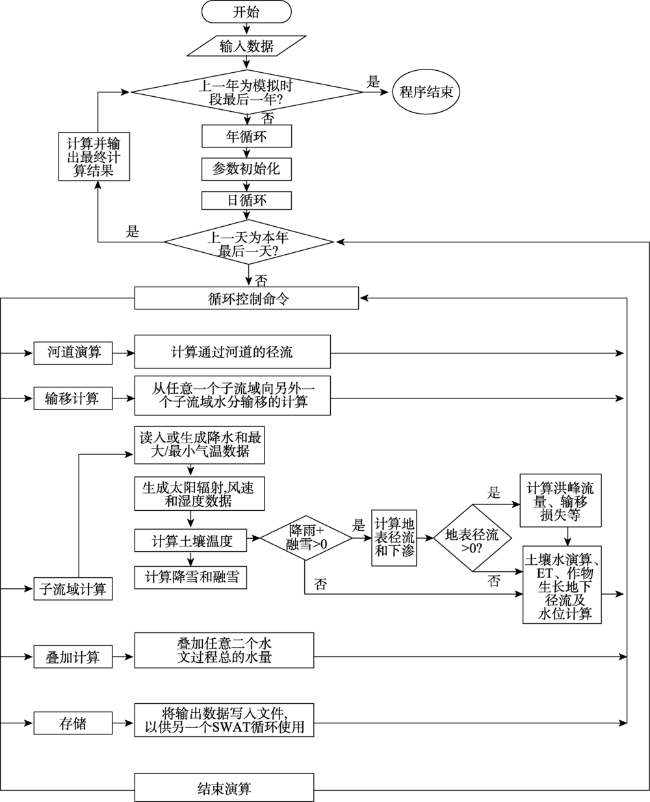
Population growth, climate change, institutional change and urbanization etc. would cause the change of land use / land cover, which in turn would further affect the hydrological process (e.g. infiltration, surface runoff, evapotranspiration and lateral flow) and water balance. Currently, because of the difficulties in obtaining the yearly land use / land cover data and the problems in calculating process in hydrological models, the simulation of hydrological process under the impact of land use / land cover change is conducted on one period each time and the impacts of multiple periods (e.g. multiple years) of land use / land cover change cannot be simulated continuously. That is the models could not call land use / land cover data year by year seamlessly. SWAT (Soil and Water Assessment Tools)is a distributed hydrological model. During its simulation period, it could not call land use / land cover data year by year and neglects the land use / land cover change in time scale. This would impact its applications in regions with severe land use / land cover changes (e.g. the Middle Reaches of the Heihe River). Heihe River Basin is the second largest and a typical endorheic river basin in China. The middle reach consumes a major portion of the water in the Heihe River. For the weakness of SWAT model, this research developed a model called LU-SWAT that could simulate the impacts of multiple years of land use / land cover change continuously. Furthermore, we applied SWAT and LU-SWAT to simulating streamflow in the Middle Reaches of the Heihe River, and compared their efficiency. The results showed that the LU-SWAT model, which could call land use / land cover data year by year is more suitable to simulate the streamflow in the Middle Reaches of the Heihe River.
JIN Xin , JIN Yanxiang , YANG Dengxing . Improved SWAT and Its Application to a Region with Severe Land Use / Land Cover Changes[J]. Journal of Geo-information Science, 2018 , 20(8) : 1064 -1073 . DOI: 10.12082/dqxxkx.2018.170606
Fig. 1 The study area图1 研究区 |
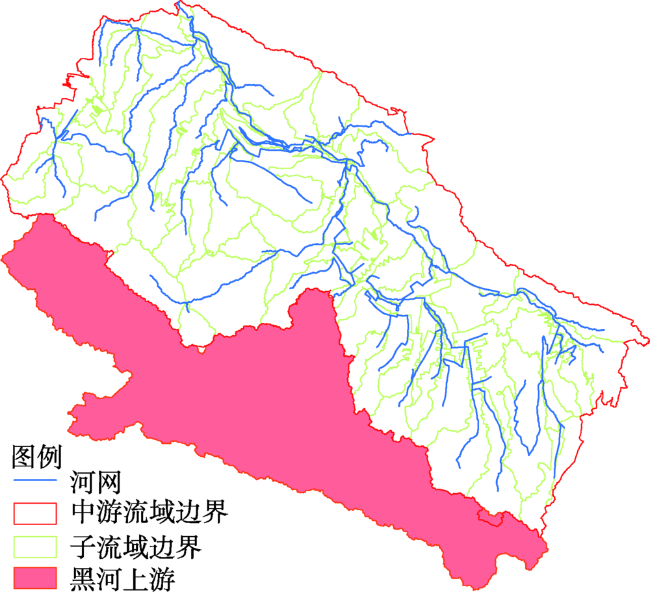
Fig. 2 Division of sub-watershed in the middle reach of the Heihe River图2 黑河中游子流域划分结果 |
Tab. 1 The irrigation volume in districts in the middle reach of the Heihe River表1 黑河中游灌区灌溉量(m3/m2) |
| 黑河灌区 | 梨园河灌区 | 沿山灌区 | ||||||||
|---|---|---|---|---|---|---|---|---|---|---|
| 甘州 | 高台 | 临泽 | 临泽 | 甘州 | 高台 | 山丹 | 民乐 | |||
| 河水 | 0.93 | 0.91 | 1.06 | 0.72 | 1.2 | 0.89 | 0.19 | 1.67 | ||
| 地下水 | 0.28 | 0.36 | 0.19 | 0.02 | 0 | 0 | 0.09 | 0 | ||
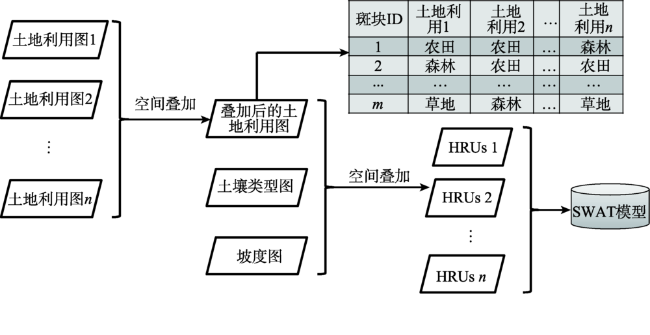
Fig. 3 The sketch map of HRUs producing process图3 HRUs 生成过程修改示意图 |
Fig. 4 Calculating steps of modified SWAT model图4 改进后的SWAT模型计算流程 |
Tab. 2 The land use/ cover dynamic degrees in middle reach of the Heihe River (%)表2 黑河中游土地利用动态度(%) |
| 时段 | 耕地 | 林地 | 草地 | 水域 | 城镇 | 裸地 |
|---|---|---|---|---|---|---|
| 1990-1991 | 0.91 | 0.91 | -1.28 | -2.56 | 15.39 | 0.023 |
| 1991-1992 | 1.03 | 2.41 | -1.43 | 27.19 | 10.66 | -1.96 |
| 1992-1993 | 1.15 | 1.83 | -1.25 | -10.34 | 6.61 | 0.43 |
| 1993-1994 | 1.08 | 2.40 | -0.20 | -5.76 | 11.85 | -1.14 |
| 1994-1995 | 1.00 | 2.26 | -1.47 | -7.34 | 6.05 | 0.15 |
| 1995-1996 | 1.04 | 1.98 | -1.05 | 14.10 | 10.05 | -1.65 |
| 1996-1997 | 1.18 | 2.89 | -1.33 | 5.78 | 7.35 | -1.29 |
| 1997-1998 | 0.96 | 2.65 | -1.32 | 1.09 | 10.87 | -1.14 |
| 1998-1999 | 1.01 | 2.13 | -0.25 | -1.44 | 5.81 | -1.33 |
| 1999-2000 | 0.74 | 1.65 | 0.10 | -0.36 | 4.12 | -1.32 |
| 2000-2001 | 0.27 | 3.50 | -0.22 | -1.47 | 3.29 | -1.44 |
| 2001-2002 | 0.35 | 3.75 | 0.01 | -0.37 | 7.02 | -2.24 |
| 2002-2003 | 0.55 | 3.61 | -0.21 | 2.24 | 0.59 | -1.84 |
| 2003-2004 | 0.34 | 1.05 | -0.03 | 0.36 | 2.96 | -0.93 |
| 2004-2005 | 0.50 | 3.58 | -0.32 | -0.36 | 2.30 | -1.81 |
| 2005-2006 | 0.32 | 1.07 | -0.07 | -1.46 | 4.50 | -0.98 |
| 2006-2007 | 0.36 | 3.30 | -0.18 | -0.37 | 2.96 | -1.94 |
| 2007-2008 | 0.53 | 3.13 | 0.03 | -1.11 | 2.87 | -2.17 |
| 2008-2009 | 0.41 | 0.70 | -0.10 | 0.75 | 2.28 | -0.86 |
Tab. 3 Sensitivity analysis of SWAT model表3 SWAT参数敏感性分析结果 |
| 参数名 | 参数意义 | t值 | p值 |
|---|---|---|---|
| ESCO | 土壤蒸发补偿因子 | 0.39 | 0.86 |
| CANMX | 最大冠层截留量 | -0.41 | 0.85 |
| HRU_SLP | 平均比降 | 0.44 | 0.81 |
| RCHRG_DP | 深层含水层的渗透系数 | 0.49 | 0.78 |
| SURLAG | 地表径流滞后系数 | 0.52 | 0.76 |
| OV_N | 坡面漫流的曼宁系数 | -0.55 | 0.68 |
| EPCO | 植物吸收补偿因子 | 0.6 | 0.67 |
| BIOMIX | 生物混合效率 | -0.63 | 0.63 |
| SLSUBBSN | 平均坡长 | 0.64 | 0.6 |
| GWQMN | 发生回归流所需的浅层含水层的水位阈值 | 0.7 | 0.45 |
| SMFMX | 6月21日的融雪因子 | -0.74 | 0.41 |
| REVAPMN | 渗入深层含水层所需的浅层含水层水位阈值 | 0.92 | 0.37 |
| TIMP | 积雪温度滞后因子 | 0.97 | 0.34 |
| SFTMP | 降雪气温 | -0.99 | 0.32 |
| GW_DELAY | 地下水的时间延迟 | 1.02 | 0.31 |
| GW_REVAP | 地下水的再蒸发系数 | -1.15 | 0.25 |
| SMFMN | 12月21日的融雪因子 | -1.37 | 0.17 |
| GWQMN | 发生回归流所需的浅层含水层的水位阈值 | 1.86 | 0.06 |
| CH_N2 | 主河道的曼宁系数 | -2.49 | 0.01 |
| ALPHA_BF | 基流因子 | 6.11 | 0 |
| CN2 | 水分条件II时的初始SCS径流曲线数 | 8.59 | 0 |
| CH_K2 | 主河道冲积物的有效渗透系数 | -14.09 | 0 |
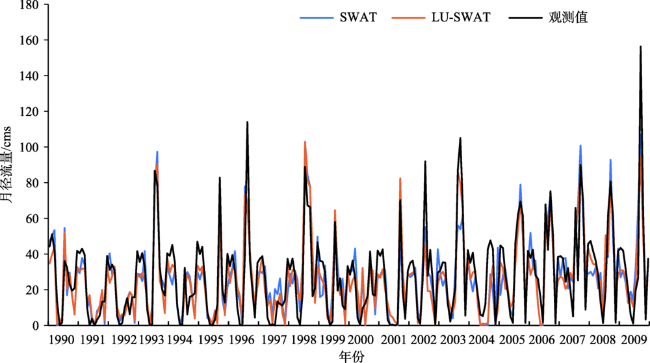
Fig. 5 Comparision of SWAT and LU-SWAT simulated and observed monthly stream flow in middle reach of the Heihe River图5 黑河中游正义峡站SWAT及LU-SWAT模型模拟的月径流量与实测值对比 |
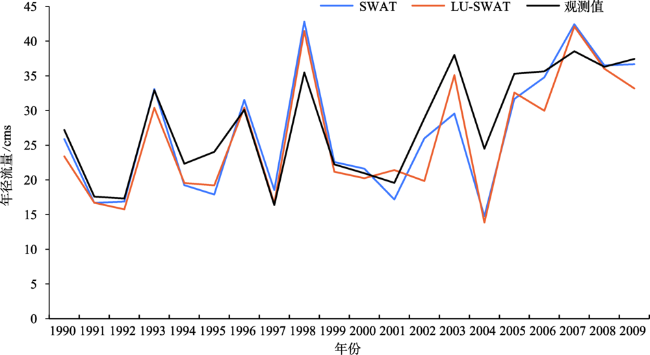
Tab. 4 Performance assessment of SWAT and LU-SWAT model with simulating of monthly and yearly stream flow in middle reach of the Heihe River表4 黑河中游正义峡站SWAT及LU-SWAT模型月、年径流量模拟效果评价 |
| NSE | PBIAS/% | RSR | ||
|---|---|---|---|---|
| 月径流量 | SWAT | 0.67 | 4.33 | 0.57 |
| LU-SWAT | 0.74 | 7.42 | 0.51 | |
| 年径流量 | SWAT | 0.72 | 4.33 | 0.53 |
| LU-SWAT | 0.77 | 7.42 | 0.48 |
Fig. 6 Comparision of sumulated and observed yearly stream flow in middle reach of the Heihe River图6 黑河中游正义峡站SWAT模型模拟的年径流量与实测值对比 |
The authors have declared that no competing interests exist.
| [1] |
|
| [2] |
|
| [3] |
[
|
| [4] |
|
| [5] |
[
|
| [6] |
[
|
| [7] |
[
|
| [8] |
[
|
| [9] |
|
| [10] |
|
| [11] |
|
| [12] |
[
|
| [13] |
[
|
| [14] |
[
|
| [15] |
[
|
| [16] |
[
|
| [17] |
[
|
| [18] |
[
|
| [19] |
|
| [20] |
|
| [21] |
[
|
| [22] |
[
|
/
| 〈 |
|
〉 |