
Journal of Geo-information Science >
Stochastic Characteristics of Annual Extreme Rainfall with Different Durations and Their Spatial Difference in China
Received date: 2017-07-10
Request revised date: 2018-03-10
Online published: 2018-08-24
Supported by
National Key Research and Development Plan, No.2017YFA0603702
National Natural Science Foundation of China, No.91647110, 41330529, 91547205
The “Bingwei” Excellent Talents from the Institute of Geographic Sciences and Natural Resources Research, Chinese Academy of Sciences
The Youth Innovation Promotion Association, Chinese Academy of Sciences, No.2017074
Investigation and Evaluation of National Mountain Flood Disaster IWHR, No.SHZH-IWHR-57.
Copyright
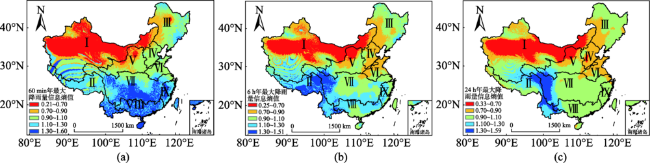
Extreme rainfall events caused terrible mountain torrents, urban floods and other disasters, and brought great losses to the ecological environment, social and economic development, people's lives and properties. Investigating the spatial pattern and difference of the occurrence of extreme rainfalls, especially for short time-duration, is important for the floods prevention and control. Based on the annual maximum rainfall data at the time resolutions of 60 min, 6 h and 24 h, we generated the series data with 2000 samples following the Pearson-III probabilistic distribution, and then calculated the information entropy values by discrete information entropy theory. Investigation was focused on the spatial distribution and difference of stochastic characteristics of extreme rainfall with different time-durations. Results show that the entropy value of annual extreme rainfall in the southeastern region is greater than that in the northwestern region, indicating more obviously stochastic characteristics of extreme rainfall in the latter. However, the spatial distribution of stochastic characteristics of extreme rainfall, which is comprehensively determined by monsoon, typhoon, local weather system and human activities, vary with time resolutions, especially the entropy value in the Eastern Tibet, Haihe River Basin and the Huaihe River Basin express obvious difference. In addition, the entropy value mainly accounts for the relatively discrete degree of extreme rainfall value, rather than absolutely discrete degree, so the entropy value is determined by the kurtosis value of extreme rainfall and the two variables show a significant negative correlation. Moreover, the paper indicates that the evident relationship between the entropy value and coefficient of variation does not mean causality, which is resulted from the relationship of kurtosis and entropy value. It is concluded that the spatial distribution of entropy values of extreme rainfall in different time-durations can reflect the spatial distribution of its stochastic characteristics, thus the results can be a helpful scientific basis for the flood prevention and control, agriculture and economic-social developments.
LI Xinxin , SANG Yanfang , XIE Ping , LIU Changming . Stochastic Characteristics of Annual Extreme Rainfall with Different Durations and Their Spatial Difference in China[J]. Journal of Geo-information Science, 2018 , 20(8) : 1094 -1101 . DOI: 10.12082/dqxxkx.2018.170310
Fig. 1 Spatial distribution of the entropy values of extreme rainfall with different time-durations in China |
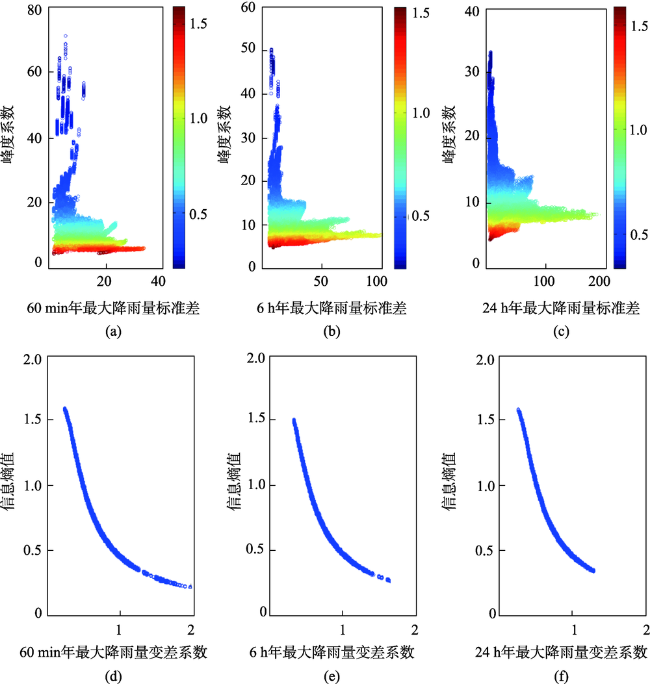
Fig. 2 Scatter diagram showing the relationship between entropy values with the standard deviation and kurtosis, and entropy values with coefficient of variation of extreme rainfall with different time-durations in China图2 中国60 min、6 h、24 h历时年最大降雨量信息熵值与标准差、峰度系数以及信息熵与变差系数的散点图 |
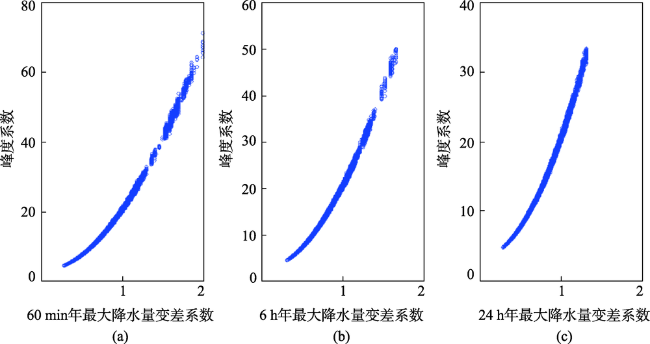
Fig. 3 Scatter diagram showing the relationship between coefficient of variation and kurtosis of extreme rainfall with different time-durations in China图3 中国60 min、6 h、24 h历时年最大降雨量变差系数与峰度系数的散点图 |
Tab. 1 Occurrence times of 24h rainstorms over Southwestern China表1 中国西南三省不同量级实测最大24 h暴雨发生次数 |
| 降雨量级/mm | |||||
|---|---|---|---|---|---|
| 200~250 | 250~300 | 300~400 | 400~500 | >500 | |
| 四川 | 20 | 13 | 31 | 8 | 3 |
| 贵州 | 13 | 7 | 2 | 0 | 0 |
| 云南 | 8 | 2 | 0 | 0 | 0 |
The authors have declared that no competing interests exist.
| [1] |
[
|
| [2] |
|
| [3] |
|
| [4] |
|
| [5] |
|
| [6] |
|
| [7] |
[
|
| [8] |
[
|
| [9] |
[
|
| [10] |
[
|
| [11] |
[
|
| [12] |
[
|
| [13] |
[
|
| [14] |
[
|
| [15] |
[
|
| [16] |
[
|
| [17] |
[
|
| [18] |
[
|
| [19] |
[
|
| [20] |
[
|
| [21] |
中国暴雨统计参数图集[M]中国暴雨统计参数图集[M].北京:中国水利水电出版社,2006.
[
|
| [22] |
|
| [23] |
[
|
| [24] |
[
|
| [25] |
[
|
| [26] |
|
| [27] |
[
|
| [28] |
[
|
| [29] |
[
|
| [30] |
[
|
| [31] |
[
|
| [32] |
[
|
| [33] |
[
|
| [34] |
[
|
| [35] |
[
|
/
| 〈 |
|
〉 |