
Journal of Geo-information Science >
Spatial-temporal Characteristics of Source and Sink Points of Mobikes in Beijing and Its Scheduling Strategy
Received date: 2018-06-04
Request revised date: 2018-06-30
Online published: 2018-08-24
Supported by
National Natural Science Foundation of China, No.41421001, 41525004.
Copyright
Sharing bicycles is an important tool for solving the "last mile" travel problem in a city. However, the imbalance between supply and demand of sharing bicycles occurred frequently, which leads to significant spare of bicycles and obvious inconvenience for users. The key to solve this problem is to understand the spatial and temporal distribution characteristics of sharing bicycles’ supply and demand. In this case, this study defines the intensive "source" and intensive "sink" points of sharing bicycles, and uses Mobikes cycling data and land use type data to analyze the distribution characteristics of the intensive source and intensive sink points during the workdays and weekends, as well as the morning and evening peaks. Combined with the land type information, we further analyze the characteristics of sharing bicycles' usage under different land use types and propose a local scheduling model based on spatial neighborhood. Results show that under different land use coverage, the distribution of intensive source and intensive sink points of sharing bicycles show significant spatial and temporal heterogeneous patterns: (1) The usage of sharing bicycles during work days is obviously higher than weekends, and the distribution of the intensive source and intensive sink is obviously different among different land use types. For example, the net inflow and outflow density in areas such as residential, commercial, financial lands are greater than those of green areas; (2) In the morning and evening peak periods, the source and sink attributes of the same area are always showing a converse pattern. For instance, areas with offices such as education and scientific research lands and commercial and financial lands will have the characteristics of "morning sinks and evening sources", while the residential lands will be "morning sources and evening sinks"; (3) During the morning and evening peak periods of weekdays and weekends, there are also differences in characteristics of the sources and sinks of the same type of land use. For instance, the proportion of the intensive sources and intensive sinks will obviously decline in the office area on weekends. Based on the results above, this paper proposes a local optimized scheduling model. It is found that the model can effectively reduce the imbalance of bicycles' space allocation and increase the resource's utilization and the convenience of people's travelling.
GAO Ying , SONG Ci , SHU Hua , PEI Tao . Spatial-temporal Characteristics of Source and Sink Points of Mobikes in Beijing and Its Scheduling Strategy[J]. Journal of Geo-information Science, 2018 , 20(8) : 1123 -1138 . DOI: 10.12082/dqxxkx.2018.180272
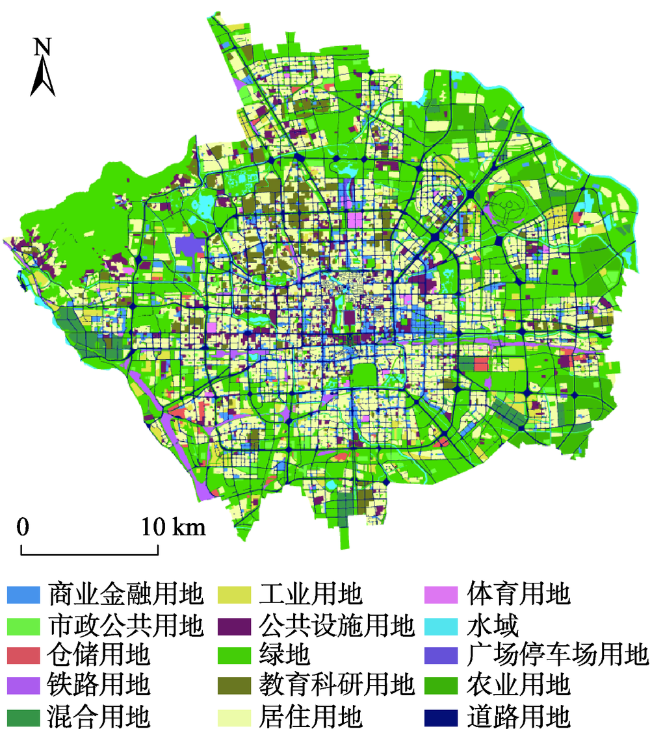
Fig. 1 Land use in research area图1 研究区土地利用分类图 |
Tab. 1 The thresholds of bicycles in different period表1 不同时段强源汇车辆数阈值 |
| 时段 | 车辆数阈值 |
|---|---|
| 工作日 | 38 |
| 周末 | 10 |
| 工作日早高峰 | 19 |
| 工作日晚高峰 | 20 |
| 周末早高峰 | 4 |
| 周末晚高峰 | 5 |
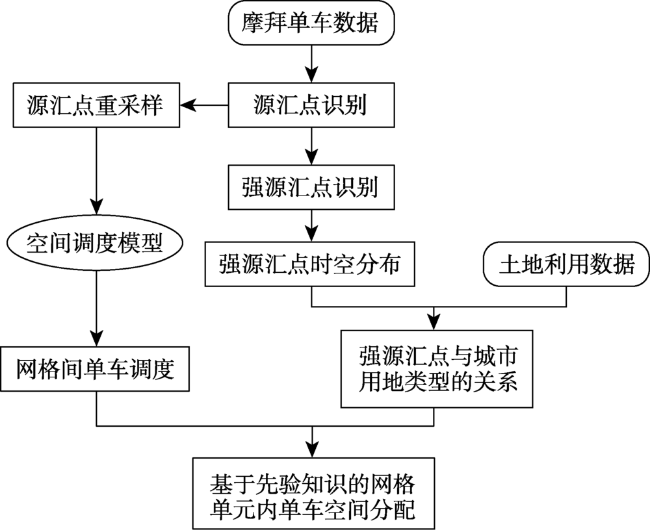
Fig. 2 The process of research图2 研究流程 |
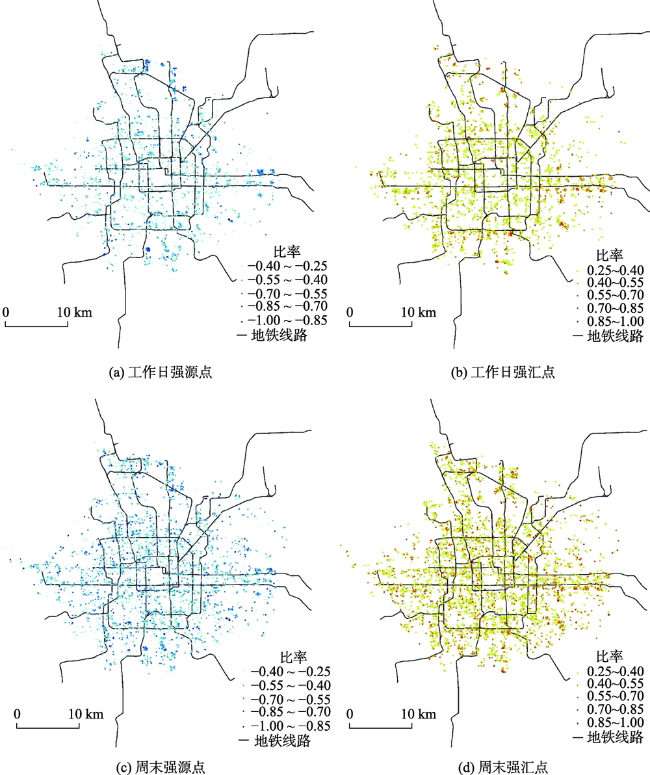
Fig. 3 Intensive source and sink points distribution of the sharing bikes during weekends in research area图3 研究区共享单车强源、强汇点分布图 |
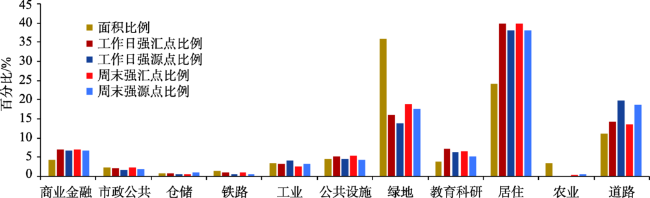
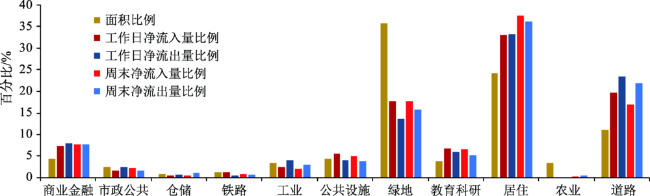
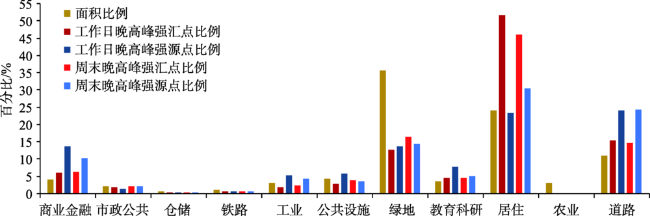
Fig. 4 The ratio of intensive source, intensive sink points in different land use图4 不同土地利用中强源点、强汇点数量比例 |
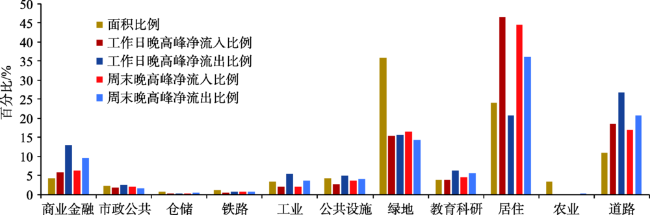
Fig. 5 The ratio of net inflow and net outflow in different land use图5 不同土地利用中及净流入、净流出比例 |
Tab. 2 The average net inflow of intensive sink and average net outflow of intensive source points in different land use表2 不同土地利用中强源点的平均净流出量及强汇点的平均净流入量 |
| 土地利用类型 | 工作日强汇点平均净流入车辆 | 工作日强源点平均净流出车辆 | 周末强汇点平均净流入车辆 | 周末强源点平均净流出车辆 |
|---|---|---|---|---|
| 商业金融用地 | 46.07 | 46.84 | 12.45 | 12.69 |
| 市政公共用地 | 35.33 | 55.86 | 11.60 | 9.66 |
| 仓储用地 | 31.25 | 41.33 | 9.65 | 13.87 |
| 铁路用地 | 56.73 | 31.94 | 9.41 | 10.75 |
| 工业用地 | 35.11 | 38.19 | 8.45 | 10.35 |
| 公共设施用地 | 48.22 | 36.08 | 10.69 | 9.64 |
| 绿地 | 48.85 | 40.52 | 10.56 | 9.77 |
| 教育科研用地 | 41.18 | 38.48 | 11.26 | 10.95 |
| 居住用地 | 36.76 | 35.93 | 10.59 | 10.41 |
| 农业用地 | 34.00 | 21.50 | 7.50 | 6.50 |
| 道路用地 | 61.02 | 48.58 | 13.90 | 12.80 |
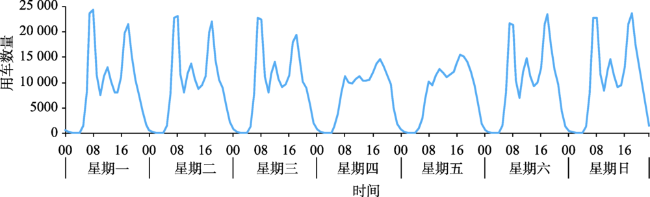
Fig. 6 The regulation of usage of Mobike图6 摩拜共享单车一周使用量时序变化 |
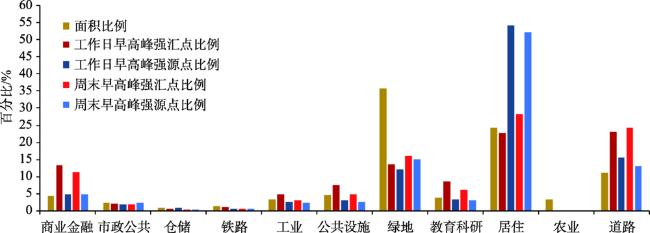
Fig. 7 The ratio of intensive sink and intensive source points in different land use during morning peaks图7 不同土地利用中早高峰期间强源点、强汇点数量比例 |
Fig. 8 The ratio of ratio of net inflow and net outflow in different land use during morning peaks图8 不同土地利用中早高峰期间净流入、净流出比例 |
Tab. 3 The average net inflow of intensive sink and average net outflow of intensive source points in different land use during morning peaks表3 不同类型用地中早高峰强源点的平均净流出量及强汇点的平均净流入量 |
| 土地利用类型 | 工作日早高峰强汇点 平均净流入车辆 | 工作日早高峰强源点 平均净流出车辆 | 周末早高峰强汇点 平均净流入车辆 | 周末强源点 平均净流出车辆 |
|---|---|---|---|---|
| 商业金融用地 | 34.62 | 23.85 | 6.88 | 4.50 |
| 市政公共用地 | 54.55 | 47.75 | 11.21 | 5.86 |
| 仓储用地 | 25.54 | 39.84 | 4.36 | 8.56 |
| 铁路用地 | 51.79 | 22.73 | 6.56 | 5.50 |
| 工业用地 | 30.48 | 29.75 | 5.13 | 6.19 |
| 公共设施用地 | 33.23 | 23.02 | 6.46 | 4.83 |
| 绿地 | 47.98 | 30.07 | 6.72 | 5.43 |
| 教育科研设计用地 | 29.24 | 21.46 | 5.49 | 4.27 |
| 居住用地 | 30.97 | 23.52 | 5.13 | 4.72 |
| 农业用地 | 19.00 | 0.00 | 4.33 | 4.40 |
| 道路用地 | 41.00 | 27.23 | 6.75 | 4.77 |
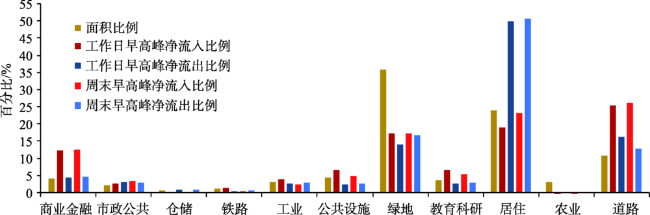
Fig. 9 The ratio of intensive sink and intensive source points in different land use during evening peaks图9 不同土地利用中晚高峰期间强源点、强汇点数量比例 |
Fig. 10 The ratio of net inflow and net outflow in different land use during evening peaks图10 不同土地利用中晚高峰期间净流入、净流出比例 |
Tab. 4 The average net inflow of intensive sink and average net outflow of intensive source points in different land use during evening peaks表4 不同土地利用中晚高峰强源点的平均净流出量及强汇点的平均净流入量 |
| 土地利用类型 | 工作日晚高峰平均 每个强汇点净流入车辆 | 工作日晚高峰平均 每个强源点净流出车辆 | 周末晚高峰平均 每个强汇点净流入车辆 | 周末晚高峰平均 每个强源点净流出车辆 |
|---|---|---|---|---|
| 商业金融用地 | 21.33 | 26.61 | 4.86 | 5.70 |
| 市政公共用地 | 21.98 | 45.59 | 4.50 | 6.90 |
| 仓储用地 | 15.38 | 19.67 | 3.91 | 5.79 |
| 铁路用地 | 17.86 | 26.05 | 4.21 | 4.43 |
| 工业用地 | 23.59 | 28.15 | 4.42 | 6.63 |
| 公共设施用地 | 21.10 | 23.33 | 4.67 | 4.72 |
| 绿地 | 25.68 | 31.71 | 4.95 | 5.53 |
| 教育科研设计用地 | 18.50 | 23.02 | 5.03 | 4.96 |
| 居住用地 | 19.24 | 25.15 | 4.75 | 4.58 |
| 农业用地 | 17.00 | 0.00 | 4.20 | 4.14 |
| 道路用地 | 25.86 | 31.24 | 5.71 | 6.38 |
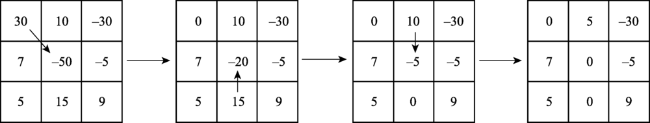
Fig. 11 Single source scheduling with 3×3 neighborhood and threshold 0图11 3×3邻域、阈值为0条件下单个源点调度示意图 |
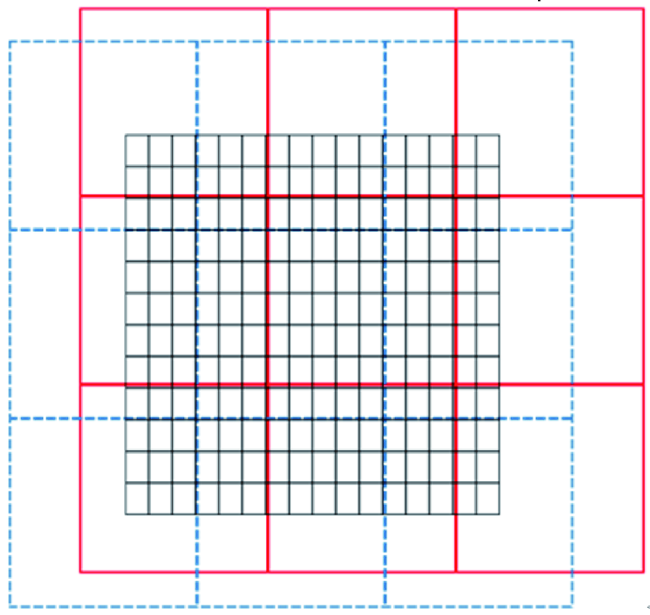
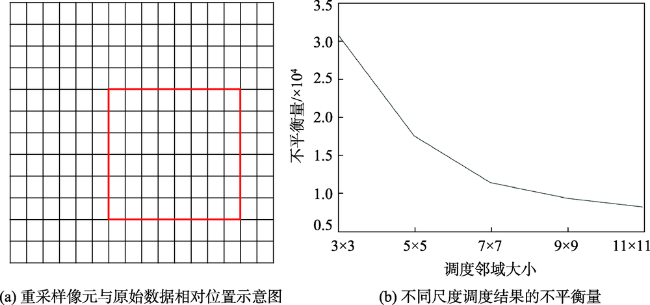
Fig. 12 The effect of different resampling methods on the grid value图12 不同重采样方式对网格值的影响 |
Fig. 13 Resampling scheme of optimal scheduling algorithm图13 最佳调度算法的重采样方案 |
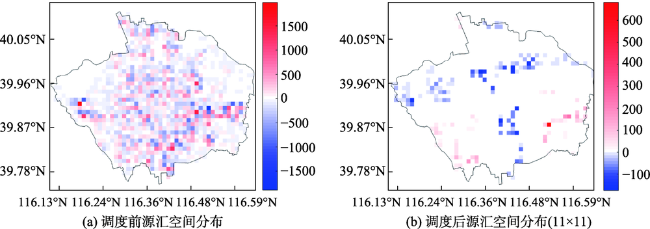
Fig. 14 The distribution of source and sink before and after scheduling (positive value indicates net inflow, negative value indicates net outflow图14 调度前后源汇空间分布(正值表示净流入,负值表示净流出) |
Tab. 5 Some scheduling process of sharing bikes表5 车辆空间调度过程 |
| 调出网格行、列号 | 调入网格行、列号 | 调度量 |
|---|---|---|
| 26, 41 | 25, 40 | 640 |
| 26, 39 | 25, 40 | 519 |
| 25, 41 | 25, 40 | 69 |
| 24, 8 | 23, 9 | 1027 |
| 25, 45 | 24, 46 | 943 |
| 34, 31 | 33, 32 | 686 |
| 32, 32 | 33, 32 | 180 |
| 27, 34 | 28, 35 | 567 |
| 29, 34 | 28, 35 | 282 |
| 27, 40 | 26, 40 | 590 |
| … | … | … |
Tab. 6 Number of grids and sharing bikes called in and called out in each land use表6 各类用地调入、调出网格及车辆数 |
| 调入用地 | 调出用地 | |||||||||||||||
|---|---|---|---|---|---|---|---|---|---|---|---|---|---|---|---|---|
| 商业金融 用地 | 市政公用 设施用地 | 仓储 用地 | 铁路 用地 | 混合 用地 | 工业 用地 | 公共设施 用地 | 绿地 | 教育科研 用地 | 居住 用地 | 体育 用地 | 水域 | 机场 用地 | 农业 用地 | 道路 用地 | 调出网格 (车辆)总数 | |
| 商业金融用地 | 1(119) | 2(136) | 5(186) | 9(1466) | 1(78) | 1(117) | 19(2102) | |||||||||
| 市政公用设施用地 | 2(61) | 5(103) | 3(304) | 10(468) | ||||||||||||
| 仓储用地 | 1(83) | 1(58) | 3(45) | 5(186) | ||||||||||||
| 铁路用地 | 1(81) | 2(19) | 1(1) | 4(5) | 6(760) | 14(866) | ||||||||||
| 混合用地 | 5(725) | 1(23) | 1(19) | 11(514) | 1(6) | 6(376) | 4(20) | 29(1683) | ||||||||
| 工业用地 | 1(56) | 1(18) | 3(67) | 6(446) | 6(814) | 1(114) | 18(1515) | |||||||||
| 公共设施用地 | 1(5) | 1(2) | 5(801) | 1(59) | 4(846) | 1(30) | 13(1743) | |||||||||
| 绿地 | 8(453) | 3(535) | 7(755) | 9(1416) | 18(488) | 220(7526) | 8(199) | 108(9308) | 3(24) | 4(89) | 3(117) | 13(127) | 2(57) | 406(21094) | ||
| 教育科研用地 | 3(99) | 7(233) | 10(1339) | 22(3718) | 1(4) | 43(5393) | ||||||||||
| 居住用地 | 11(265) | 2(319) | 2(453) | 3(328) | 2(125) | 14(1628) | 20(2713) | 118(9414) | 19(2765) | 229(30053) | 9(454) | 1(2) | 8(102) | 2(382) | 440(49003) | |
| 体育用地 | 1(1) | 1(2) | 2(3) | |||||||||||||
| 水域 | 7(29) | 2(28) | 1(3) | 1(1) | 11(61) | |||||||||||
| 机场用地 | 2(25) | 2(25) | ||||||||||||||
| 农业用地 | 1(53) | 4(57) | 15(204) | 5(146) | 2(17) | 14(266) | 41(743) | |||||||||
| 道路用地 | 2(314) | 2(193) | 10(1769) | 1(145) | 2(233) | 17(2654) | ||||||||||
| 调入网格(车辆)总数 | 21(842) | 3(375) | 2(453) | 7(944) | 17(1759) | 36(3273) | 53(4572) | 403(18792) | 38(4309) | 410(49588) | 15(731) | 9(115) | 5(142) | 43(561) | 8(903) | |
Tab. 7 The net called in and net called out of sharing bikes in each land uses during workdays表7 工作日各类用地中净调入、净调出车辆 |
| 土地利用类型 | 净调出量 | 净调入量 |
|---|---|---|
| 商业金融用地 | 1983 | 723 |
| 市政公用设施用地 | 468 | 375 |
| 仓储用地 | 186 | 453 |
| 铁路用地 | 785 | 863 |
| 混合用地 | 958 | 1034 |
| 工业用地 | 1379 | 3206 |
| 公共设施用地 | 942 | 3771 |
| 绿地 | 13 568 | 11 446 |
| 教育科研用地 | 4054 | 2970 |
| 居住用地 | 18 950 | 19 535 |
| 体育用地 | 3 | 751 |
| 水域 | 58 | 112 |
| 机场用地 | 0 | 117 |
| 农业用地 | 477 | 295 |
| 道路用地 | 2421 | 670 |
The authors have declared that no competing interests exist.
| [1] |
共享单车一天骑了七千万人次创造经济社会影响2213亿. .
[70 million people rides sharing bicycles a day, creating economic and social impact of 221.3 billion yuan. of 221.3 billion yuan. .]
|
| [2] |
[
|
| [3] |
|
| [4] |
|
| [5] |
|
| [6] |
|
| [7] |
|
| [8] |
|
| [9] |
|
| [10] |
|
| [11] |
[
|
| [12] |
[
|
| [13] |
[
|
| [14] |
[
|
| [15] |
[
|
| [16] |
[
|
| [17] |
[
|
| [18] |
|
| [19] |
北京历史天气. .
[ Beijing's historical weather. ]
|
| [20] |
[
|
| [21] |
[
|
| [22] |
|
/
| 〈 |
|
〉 |