
Journal of Geo-information Science >
Seasonal Variations of Urban Surface Net Radiation and Its Relationship to Land Cover Pattern
Received date: 2018-01-11
Request revised date: 2018-04-03
Online published: 2018-08-24
Supported by
National Natural Science Foundation of China, No.41371392, 71573242, 71273252.
Copyright
Rapid urbanization has led to land cover pattern changes which alter the surface net radiation and eventually influence surface energy balance. This process has been accompanied by a series of ecological and environmental problems, one of which is the urban heat island effect. Therefore, research on the seasonal variations of urban surface net radiation and its relationship to land cover pattern can provide important insights for exploring the formation and evolution mechanism of urban heat island. Taking Xiamen city as a study area, this research retrieved surface net radiation using Landsat-5 TM remote sensing images and meteorological data of the four seasons. Then the seasonal variation characteristics of surface net radiation were further analyzed. Landscape metrics were used to characterize and describe the spatial composition and allocation of land cover pattern. The correlation analysis, partial correlation analysis, stepwise regression analysis and variance partitioning were applied to explore the relationship between surface net radiation and land cover pattern from multi-seasonal perspective. The results suggest that: (1) the highest mean value of surface net radiation was found in summer, followed by spring, fall and winter. Surface net radiation is higher for the land cover types of water and forestland, while lower for built-up land and bare land. (2) The spatial allocation of land cover pattern has no significant influence on surface net radiation. (3) The spatial composition of land cover pattern shows significant influence on surface net radiation. The proportions of bare land and the proportion of forest land are effective and important factors which affect the changes of surface net radiation all the year round. And the proportion of forest land is the most important and continuously effective factor which affects and explains the cross-seasonal differences of surface net radiation. This research expands our scientific understanding of the effects of land cover pattern on surface net radiation. And it is helpful in exploring the formation and evolution mechanism of urban heat island. In addition, it may provide theoretical hints and realistic guidance for urban planning and sustainable development.
WANG Feifei , ZHAO Xiaofeng , LIU Xiuguang , LIU Jiahui , LIN Jianyi . Seasonal Variations of Urban Surface Net Radiation and Its Relationship to Land Cover Pattern[J]. Journal of Geo-information Science, 2018 , 20(8) : 1160 -1168 . DOI: 10.12082/dqxxkx.2018.180041
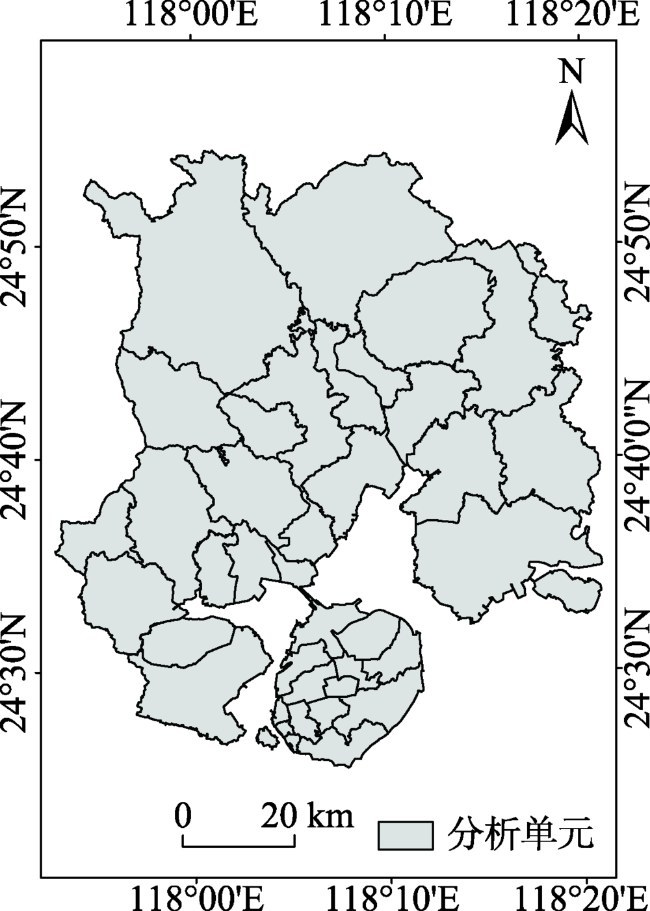
Fig. 1 Study area and analytical units图1 研究区与分析单元 |
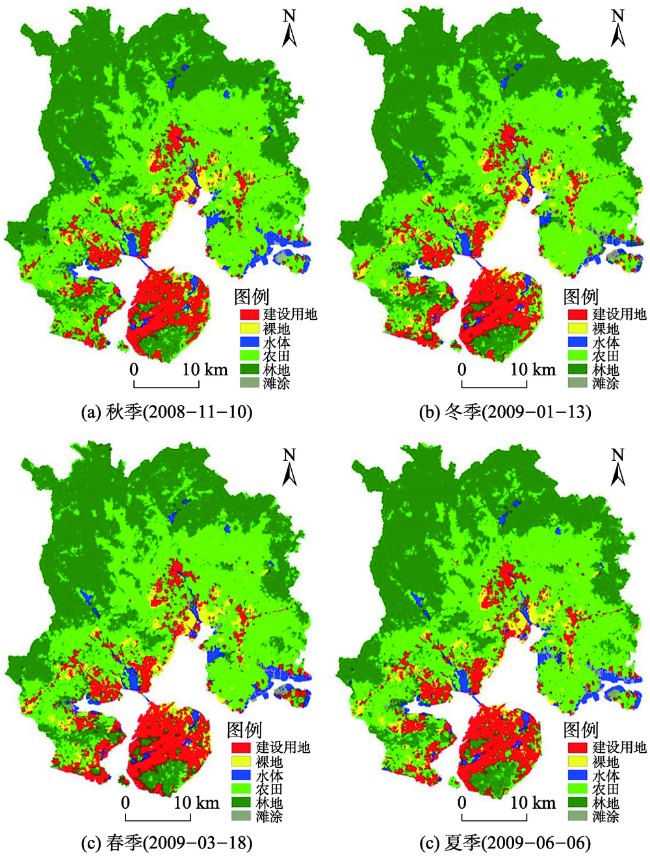
Fig.2 Spatial distribution of land cover types of Xiamen city图2 厦门市地表覆盖类型空间分布 |
Tab.1 Landscape metrics表1 景观格局指数 |
| 指数中文名称 | 指数英文缩写 | 指数类型 |
|---|---|---|
| 蔓延度指数 | CONTAG | 景观级别 |
| Shannon多样性指数 | SHDI | 景观级别 |
| Shannon均度指数 | SHEI | 景观级别 |
| 斑块所占景观面积比例 | PLAND | 类型级别 |
| 斑块平均面积 | AREA_MN | 景观级别,类型级别 |
| 斑块密度 | PD | 景观级别,类型级别 |
| 最大斑块占景观面积比例 | LPI | 景观级别,类型级别 |
| 边缘密度 | ED | 景观级别,类型级别 |
| 景观形状指数 | LSI | 景观级别,类型级别 |
| 景观导度指数 | COHESION | 景观级别,类型级别 |
| 平均欧氏最近邻距离 | ENN_MN | 景观级别,类型级别 |
| 斑块平均形状指数 | SHAPE_MN | 景观级别,类型级别 |
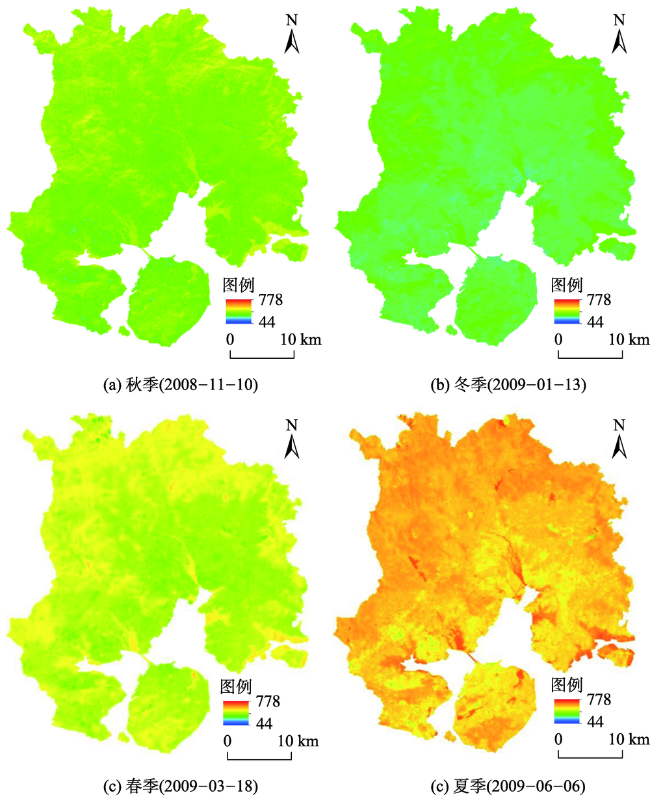
Fig.3 Spatial distribution of surface net radiation of Xiamen city图3 厦门市地表净辐射通量空间分布 |
Tab. 2 Pearson correlation analysis表2 相关分析 |
| 景观格局 指数 | 地表净辐射通量(秋) | 地表净辐射通量(冬) | 地表净辐射通量(春) | 地表净辐射通量(夏) |
|---|---|---|---|---|
| ED1 | -0.720** | -0.584** | -0.345* | -0.647** |
| COHESION1 | -0.560** | -0.529** | -0.363* | -0.624** |
| PLAND2 | -0.579** | -0.694** | -0.698** | -0.504** |
| PD2 | -0.658** | -0.592** | -0.648** | -0.684** |
| LPI2 | -0.495** | -0.617** | -0.661** | -0.426** |
| ED2 | -0.666** | -0.702** | -0.695** | -0.605** |
| PLAND5 | 0.661** | 0.741** | 0.620** | 0.695** |
| LPI5 | 0.692** | 0.751** | 0.611** | 0.681** |
| AREA_MN5 | 0.488** | 0.552** | 0.444** | 0.586** |
| AREA_MN | 0.640** | 0.647** | 0.426** | 0.613** |
| ENN_MN | 0.412** | 0.527** | 0.345* | 0.344* |
注:景观格局指数后面的数字表示地表覆盖类型:1 建设用地;2 裸地;5 林地。**和*分别表示显著水平p<0.01和p<0.05 |
Tab. 3 Partial Pearson correlation analysis表3 偏相关分析 |
| 景观格局 指数 | 地表净辐射通量(秋) | 地表净辐射通量(冬) | 地表净辐射通量(春) | 地表净辐射通量(夏) |
|---|---|---|---|---|
| ED1 | -0.405* | 0.214 | 0.370* | -0.249 |
| COHESION1 | -0.419* | 0.026 | 0.172 | -0.143 |
| PD2 | -0.286 | -0.054 | -0.107 | -0.322 |
| LPI2 | 0.021 | 0.065 | -0.099 | 0.030 |
| ED2 | -0.298 | -0.086 | -0.078 | -0.230 |
| LPI5 | 0.377* | 0.361* | 0.054 | 0.028 |
| AREA_MN5 | 0.382* | 0.079 | 0.114 | 0.011 |
| AREA_MN | 0.394* | 0.036 | -0.373* | 0.000 |
| ENN_MN | 0.197 | 0.046 | -0.112 | -0.098 |
注:景观格局指数后面的数字表示地表覆盖类型:1 建设用地;2 裸地;5 林地。**和*分别表示显著水平p<0.01和p<0.05 |
Tab. 4 Variance partitioning表4 方差分解 |
| 组成类指数 | 方差解释 | |
|---|---|---|
| 地表净辐射通量(秋) | PLAND2 | 0.340 |
| PLAND5 | 0.437 | |
| 地表净辐射通量(冬) | PLAND2 | 0.500 |
| PLAND5 | 0.549 | |
| 地表净辐射通量(春) | PLAND2 | 0.508 |
| PLAND5 | 0.384 | |
| 地表净辐射通量(夏) | PLAND2 | 0.235 |
| PLAND5 | 0.483 |
注:景观格局指数后面的数字表示地表覆盖类型:2 裸地;5 林地。**和*分别表示显著水平p<0.01和p<0.05 |
The authors have declared that no competing interests exist.
| [1] |
|
| [2] |
|
| [3] |
|
| [4] |
[
|
| [5] |
|
| [6] |
[
|
| [7] |
[
|
| [8] |
[
|
| [9] |
|
| [10] |
[
|
| [11] |
[
|
| [12] |
[
|
| [13] |
[
|
| [14] |
[
|
| [15] |
厦门市统计局. 2017年厦门经济特区年鉴 [J].北京:中国统计出版社,2017.
[ Xiamen Bureau of Statistics, 2017 Year book of Xiamen special economic zone[J]. Beijing: China Statistics Press, 2017. ]
|
| [16] |
[
|
| [17] |
|
| [18] |
|
| [19] |
|
| [20] |
|
| [21] |
|
| [22] |
|
| [23] |
|
| [24] |
|
| [25] |
|
| [26] |
|
| [27] |
[
|
| [28] |
[
|
| [29] |
|
| [30] |
[
|
| [31] |
[
|
| [32] |
|
| [33] |
|
| [34] |
|
/
| 〈 |
|
〉 |