
Journal of Geo-information Science >
Pre-earthquake Anomaly Data Mining of Remote Sensing OLR in Nepal Earthquake
Received date: 2017-11-28
Request revised date: 2018-04-25
Online published: 2018-08-24
Supported by
Leading Project of Fujian Province, No.2015Y0054
National Natural Science Foundation of China Youth Fund, No.41601477
National Natural Science Foundation of China, No.61361136002, 61772004.
Copyright
A number of researches have shown that the occurrence of earthquakes is often accompanied by abnormal warming of infrared radiation data, which is hidden in the Outgoing Long-Wave Radiation (OLR) data, which has been captured by the NOAA remote sensing satellite. These abnormal signals are embedded in a large amount of normal information and cannot be recognized by human eyes or some common methods. Many scholars utilized different means to analyze the anomaly of infrared remote sensing data. However, there were still lack of any effective processing techniques and algorithms, and most of the thermal infrared satellite remote sensing data weren't fully utilized. In this work, we propose a data mining algorithm, which is based on the anomaly features of the martingale theory. The algorithm first calculates the distance between a sample point and the cluster, and then determines whether the measured point is abnormal according to a comprehensive operation of the number of abnormal points nearest to each point, and calculates the whole event sequence data changing trend based on the martingale theory. The martingale value (i.e. CD value) corresponding to each original point is obtained, so that the original data is stripped out, the noise and the normal data are obtained, and the anomaly is analyzed before the earthquake. The OLR data sources used in the experiments on this algorithm were from three earthquakes happened in Nepal between September 2014 and July 2015 (including the Ms7.8 earthquake in April 25, 2015). We found that the CD value of the OLR data about the epicenter region began to have significant temporal correlation characteristics of anomalous data changes as early as 2 or 3 months before the earthquake. The results of this research were similar to the comparison of the OLR original and CD values of the Wenchuan and Lushan earthquakes. In this paper, we analyzed the anomaly of the three earthquakes one month before and some two weeks after the earthquakes. The experimental results show that when the earthquake is larger, and the anomaly CD value occurs earlier. In conclusion, the more obvious the anomaly is, the closer the region is to the epicenter or fault zone, the farther from the epicenter, the weaker and appeared later the abnormal signal.
Key words: OLR; Martingale theory; data mining; Nepal earthquake; anomaly detection
LIN Ling , KONG Xiangzeng , LI Nan , XIONG Pan . Pre-earthquake Anomaly Data Mining of Remote Sensing OLR in Nepal Earthquake[J]. Journal of Geo-information Science, 2018 , 20(8) : 1169 -1177 . DOI: 10.12082/dqxxkx.2018.170567
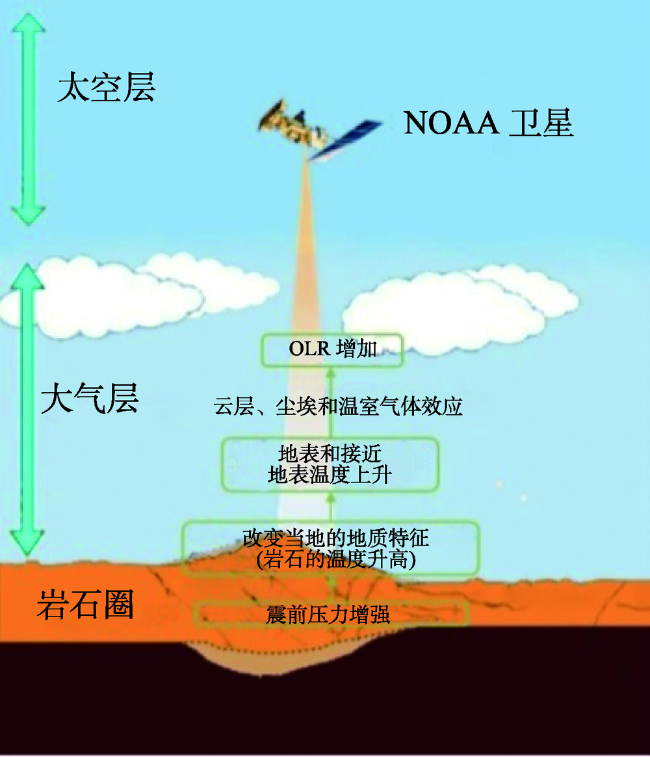
Fig. 1 Diagram of earth's Outgoing Longwave Radiation (OLR) before earthquake图1 震前的射出长波辐射(OLR)遥感监测示意图 |
Tab. 1 List of Nepal earthquakes from May 2015 to November 2014表1 2014年11月至2015年5月尼泊尔地震清单 |
| 序号 | 日期 | 时间(UTC) | 震中 | 经纬度 | 震级 | 深度/km |
|---|---|---|---|---|---|---|
| 1 | 2014-12-18 | 15:32:12 | 29 km SSE of Zuobude,中国 | 27.74 °N, 86.37° E | 5.0 | 33.6 |
| 2 | 2015-04-25 | 06:11:25 | 36 km E of Khudi,尼泊尔 | 28.23 °N, 84.73 °E | 7.8 | 8.2 |
| 3 | 2015-05-12 | 07:05:19 | 19 km SE of Kodari,尼泊尔 | 27.81 °N, 86.07 °E | 7.3 | 15 |
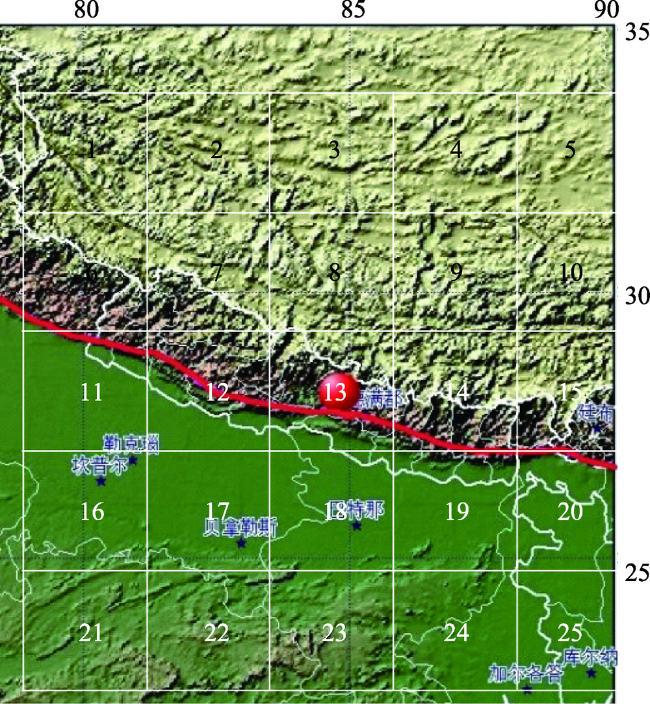
Fig. 2 Diagram of grid map图2 地图的网格化处理示意图 |
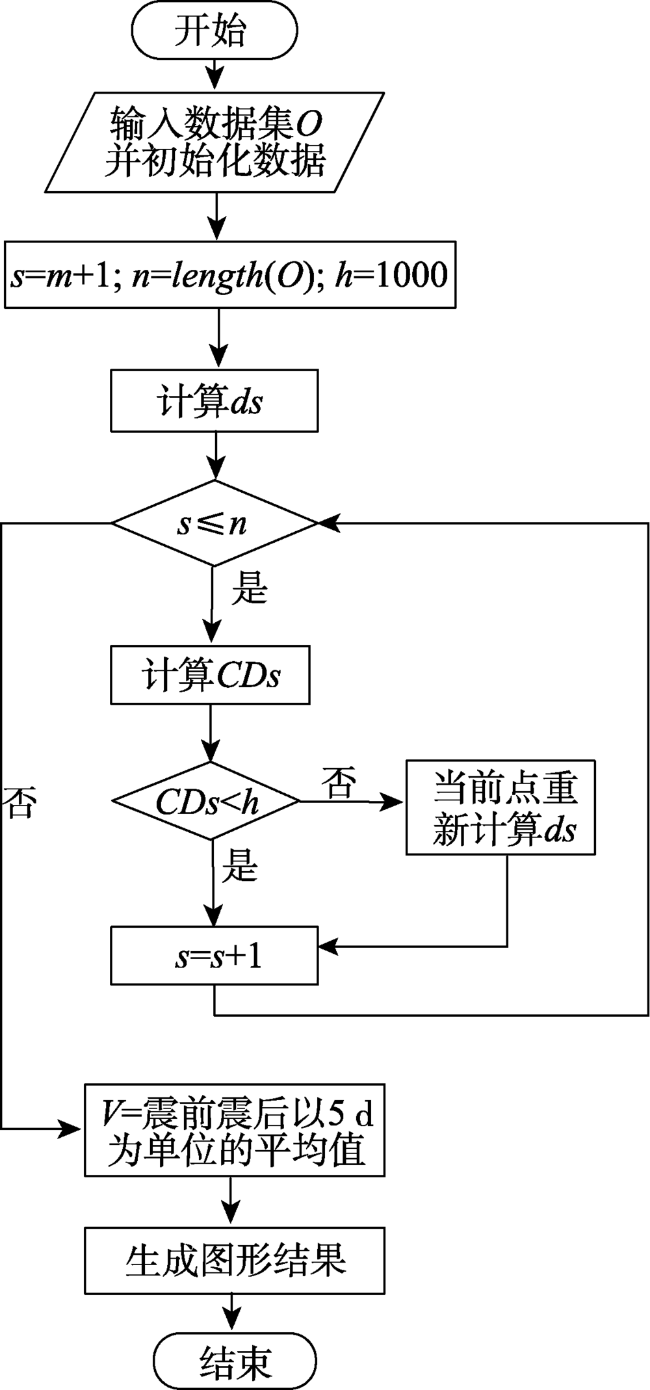
Fig. 3 Flowchart for the algorithm图3 算法流程图 |
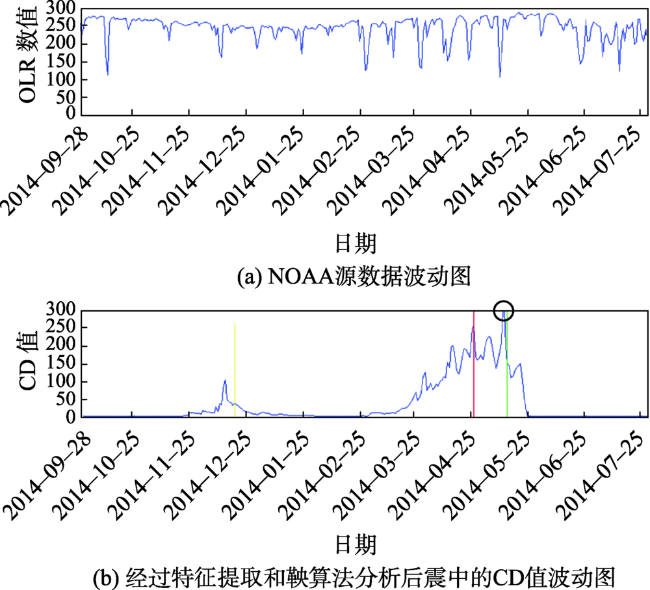
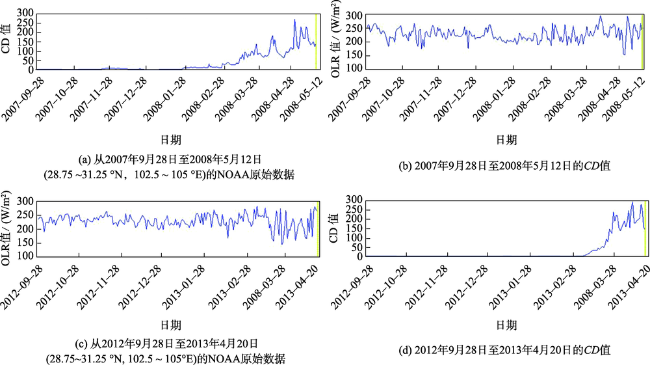
Fig. 4 The original NOAA data graph and the wave diagram of the values图4 NOAA源数据图与值波动图 |
Fig. 5 The original NOAA data and values in Wenchuan and Lushan area图5 汶川与芦山的NOAA源数据与值图 |
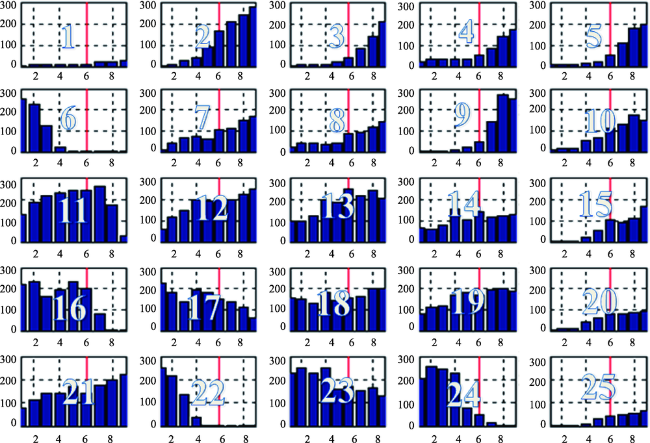
Fig. 6 Abnormal analysis of pre-earthquake and post-earthquake图6 地震前后的异常分析图 |
The authors have declared that no competing interests exist.
| [1] |
|
| [2] |
|
| [3] |
|
| [4] |
[
|
| [5] |
[
|
| [6] |
|
| [7] |
|
| [8] |
|
| [9] |
|
| [10] |
|
| [11] |
[
|
| [12] |
[
|
| [13] |
[
|
| [14] |
|
| [15] |
|
| [16] |
[
|
| [17] |
[
|
| [18] |
[
|
| [19] |
[
|
| [20] |
[
|
| [21] |
[
|
| [22] |
|
| [23] |
|
| [24] |
|
/
| 〈 |
|
〉 |