
Journal of Geo-information Science >
The Status and Development Trend of Disaggregation of Socio-economic Data
Received date: 2018-03-15
Request revised date: 2018-06-27
Online published: 2018-09-25
Supported by
National Natural Science Foundation of China, No.41571492
National Key Research and Development Program, No.2016YFA0602403.
Copyright
There is a spatial unit mismatch between statistical socio-economic data that based on administrative division statistics and geographic elements expressed in spatial grid units. It requires spatial processing technique to solve this mismatch. Research on the disaggregation of socio-economic data currently focuses on the indicators of population and gross domestic product. There is relatively few disaggregation of other socio-economic indicators, such as capital stock and housing which are essential input data for risk analysis. Dozens of spatial disaggregation models exist for different research objects. According to the differences in disaggregation ideas and methods of disaggregation, disaggregation models can be classified into three categories: area weighting method, statistical model method, and multi-source data fusion method. Area weighting method is simple but was criticized by its low resolution when applied on small scale studies. Statistical model method is widely used in disaggregation of large-scale socioeconomic statistical data, but needs sufficient spatial data for spatial statistics. While these methods can produce acceptable results, their actual resolution cannot be considered ideal. With the updating and appearing of new data sources for the disaggregation of socio-economic data, multi-source data fusion method has become the main disaggregation method recently. Moreover, the data and methods needed for disaggregation are continuously improved. Comparing principles, advantages and disadvantages of different disaggregation methods, we can see that diversification of socio-economic research indicators and spatial precision requirements, and wide application of big data are the development trend of disaggregation of socio-economic data. Meanwhile, the appearance of new data source is an important opportunity for improving spatial accuracy of the disaggregation. Overall, disaggregation of the socioeconomic data will be a hot subject for future study, one of the reasons for which is the increase of the research needs for high resolution grid data. Another reason is that research institutes and publishers have paid more attention to the scientific data which is reflected by new emerging scientific data journals.
Key words: socio-economic data; population; disaggregation; research progress; big data; raster dataset
WU Jidong , WANG Xu , WANG Cailin , HE Xin , YE Mengqi . The Status and Development Trend of Disaggregation of Socio-economic Data[J]. Journal of Geo-information Science, 2018 , 20(9) : 1252 -1262 . DOI: 10.12082/dqxxkx.2018.180137
Tab. 1 Comparison of major disaggregation models表1 主要空间化模型的综合比较 |
| 研究方法 | 相关模型 | 基本原理 | 优势 | 不足 | 主要数据 |
|---|---|---|---|---|---|
| 面积权重法 | 无辅助数据的权重插值模型[36] | 假设研究对象在空间上均匀分布,根据次一级的格网占整体的面积比例计算其值 | 所需数据源少,便捷 | 与实际差异较大 | 行政区划 |
| 有辅助数据的权重插值模型[37] | 通过辅助数据限定研究对象在空间分布范围,并根据面积比重计算空间分布值,以期符合实际 | 缩小了社会经济数据的空间分布范围误差,更贴近实际 | 区域均匀分布的结果不能表达空间差异 | 行政区划、土地利用、居民点信息等 | |
| 统计模型法 | 数学函数 模型[38,39,40,41,42,43,44,45,46,47] | 通过已有的数学函数引入参数建立模型,模拟社会经济数据的空间分布 | 引入数学函数表达空间差异,科学性强,理论基础完备 | 数学函数较复杂,参数设置针对性强,不易理解 | 中心密度、带宽 |
| 分区密度制图 模型[48,49,50] | 不同地区密度存在差异,将研究区根据特征范围划分等级,不同等级建立不同的密度模型 | 分区概念符合实际,模型简单易懂 | 区域划分难度会随分区细化程度逐渐增加 | 人口密度、土地利用、居民点分布、地形、道路等 | |
| 多源数据融合法 | 因子权重 模型[30,51-57] | 确定不同影响因子对要素空间分布的权重系数,最后叠加得到空间分布结果 | 要素空间分布更加贴近实际 | 确定不同因子的权重过程复杂,可控性差 | 土地利用、居民点分布、夜间灯光、手机信令、道路等 |
| 多元回归模型[58] | 不同影响因子之间也存在相互影响,通过多种影响因子建立回归模型模拟社会经济数据空间分布 | 多源数据融合弥补了单一要素表达空间分布密度的不足 | 不同数据的融合过程容易产生误差,计算过程复杂 | 土地利用、夜间灯光、手机信令等 |
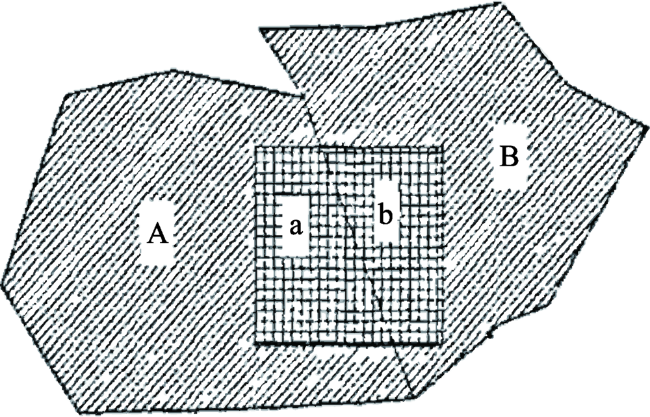
Fig. 1 Diagram of the areal weighting interpolation method图1 面积权重法图解[35] |
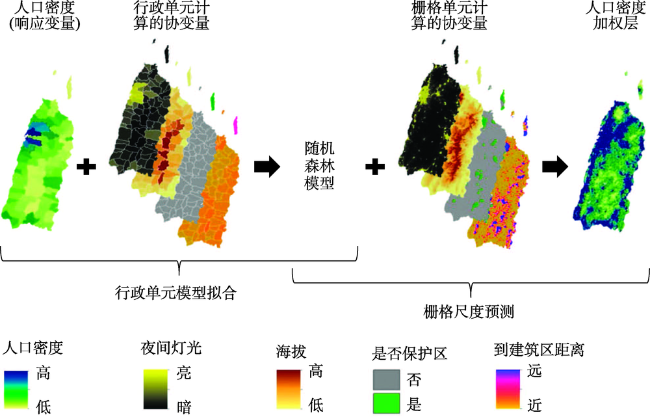
Fig. 2 Diagram of spatial population density disaggregation base on the random forest method图2 基于随机森林法的人口密度示意图[47] |
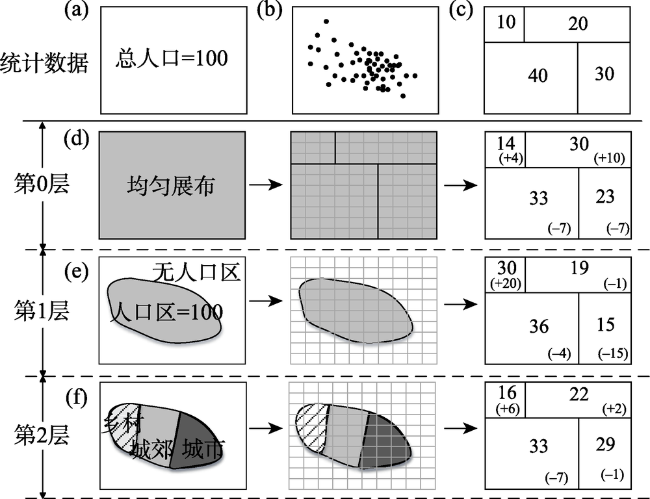
Fig. 3 Framework of multi-layer and multi-class dasymetric model图3 分区密度制图模型图解[49] |
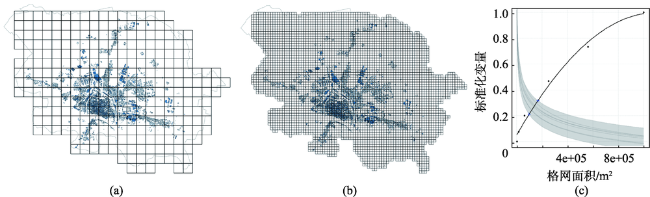
Fig. 4 Building grids with resolutions of 500 m×500 m and 125 m×125 m and their relationship with flood risk assessment uncertainty图4 不同分辨率建筑格网表达及与洪水风险评估不确定性的关系[69] |
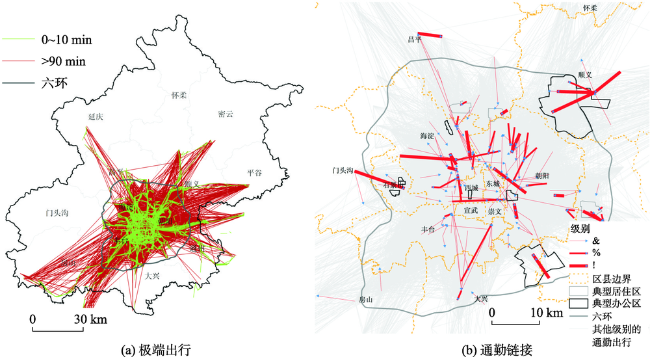
Fig. 5 Identified commuting pattern for extreme commuting trips and main commuting directions using the bus smartcard data图5 基于公交卡记录的北京市中心区极端出行和通勤链接形态[78] |
The authors have declared that no competing interests exist.
| [1] |
[
|
| [2] |
[
|
| [3] |
|
| [4] |
[
|
| [5] |
[
|
| [6] |
[
|
| [7] |
|
| [8] |
|
| [9] |
|
| [10] |
[
|
| [11] |
[
|
| [12] |
[
|
| [13] |
[
|
| [14] |
[
|
| [15] |
[
|
| [16] |
[
|
| [17] |
[
|
| [18] |
[
|
| [19] |
|
| [20] |
|
| [21] |
|
| [22] |
[
|
| [23] |
[
|
| [24] |
|
| [25] |
|
| [26] |
|
| [27] |
[
|
| [28] |
[
|
| [29] |
[
|
| [30] |
[
|
| [31] |
|
| [32] |
|
| [33] |
|
| [34] |
[
|
| [35] |
|
| [36] |
[
|
| [37] |
[
|
| [38] |
[
|
| [39] |
[
|
| [40] |
[
|
| [41] |
[
|
| [42] |
|
| [43] |
[
|
| [44] |
|
| [45] |
|
| [46] |
|
| [47] |
[
|
| [48] |
[
|
| [49] |
|
| [50] |
[
|
| [51] |
|
| [52] |
|
| [53] |
[
|
| [54] |
[
|
| [55] |
[
|
| [56] |
[
|
| [57] |
[
|
| [58] |
|
| [59] |
[
|
| [60] |
[
|
| [61] |
|
| [62] |
[
|
| [63] |
|
| [64] |
[
|
| [65] |
[
|
| [66] |
|
| [67] |
|
| [68] |
|
| [69] |
|
| [70] |
[
|
| [71] |
|
| [72] |
[
|
| [73] |
|
| [74] |
[
|
| [75] |
|
| [76] |
[
|
| [77] |
[
|
| [78] |
[
|
| [79] |
[
|
| [80] |
|
| [81] |
|
| [82] |
|
/
| 〈 |
|
〉 |