Modeling the Spatial Distribution of XCO2 with High Accuracy Based on OCO-2's Observations

  • ZHANG Lili , 1, 3, 4 ,
  • ZHAO Mingwei 2 ,
  • ZHAO Na 3, 4 ,
  • YUE Tianxiang , 3, 4, *
Expand
  • 1. Institute of Remote Sensing and Digital Earth, Chinese Academy of Sciences, Beijing 100101
  • 2. Chuzhou University, Chuzhou 239000
  • 3. Institute of Geographic Sciences and Natural Resources Research,Beijing 100101
  • 4.University of Chinese Academy of Sciences, Beijing 100049
*Corresponding author: YUE Tianxiang, E-mail:

Received date: 2017-03-29

  Request revised date: 2018-06-21

  Online published: 2018-09-25

Supported by

National Natural Science Foundation of China, No.41590844

National Natural Science Foundation of China, No.41421001.

Copyright

《地球信息科学学报》编辑部 所有

Abstract

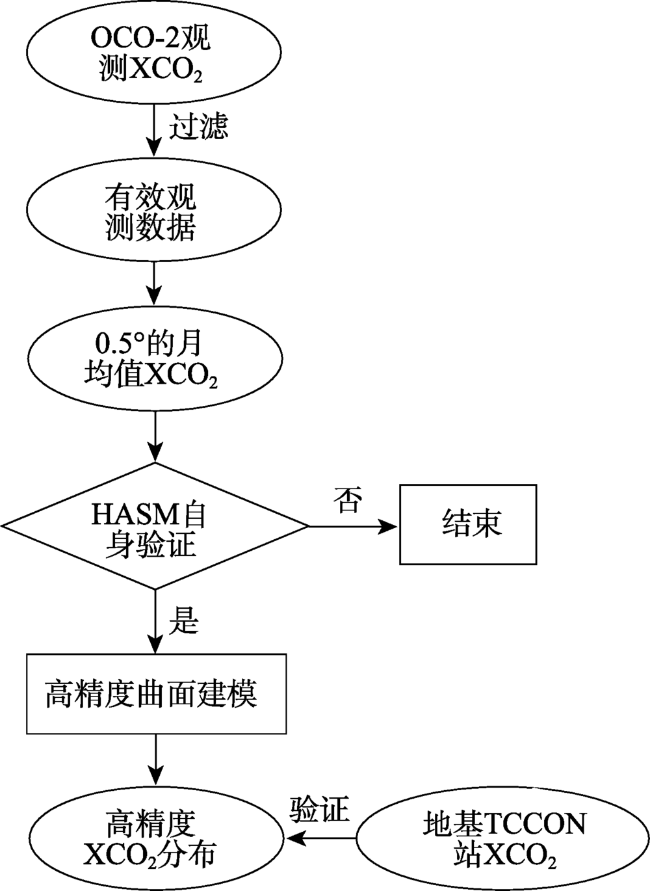
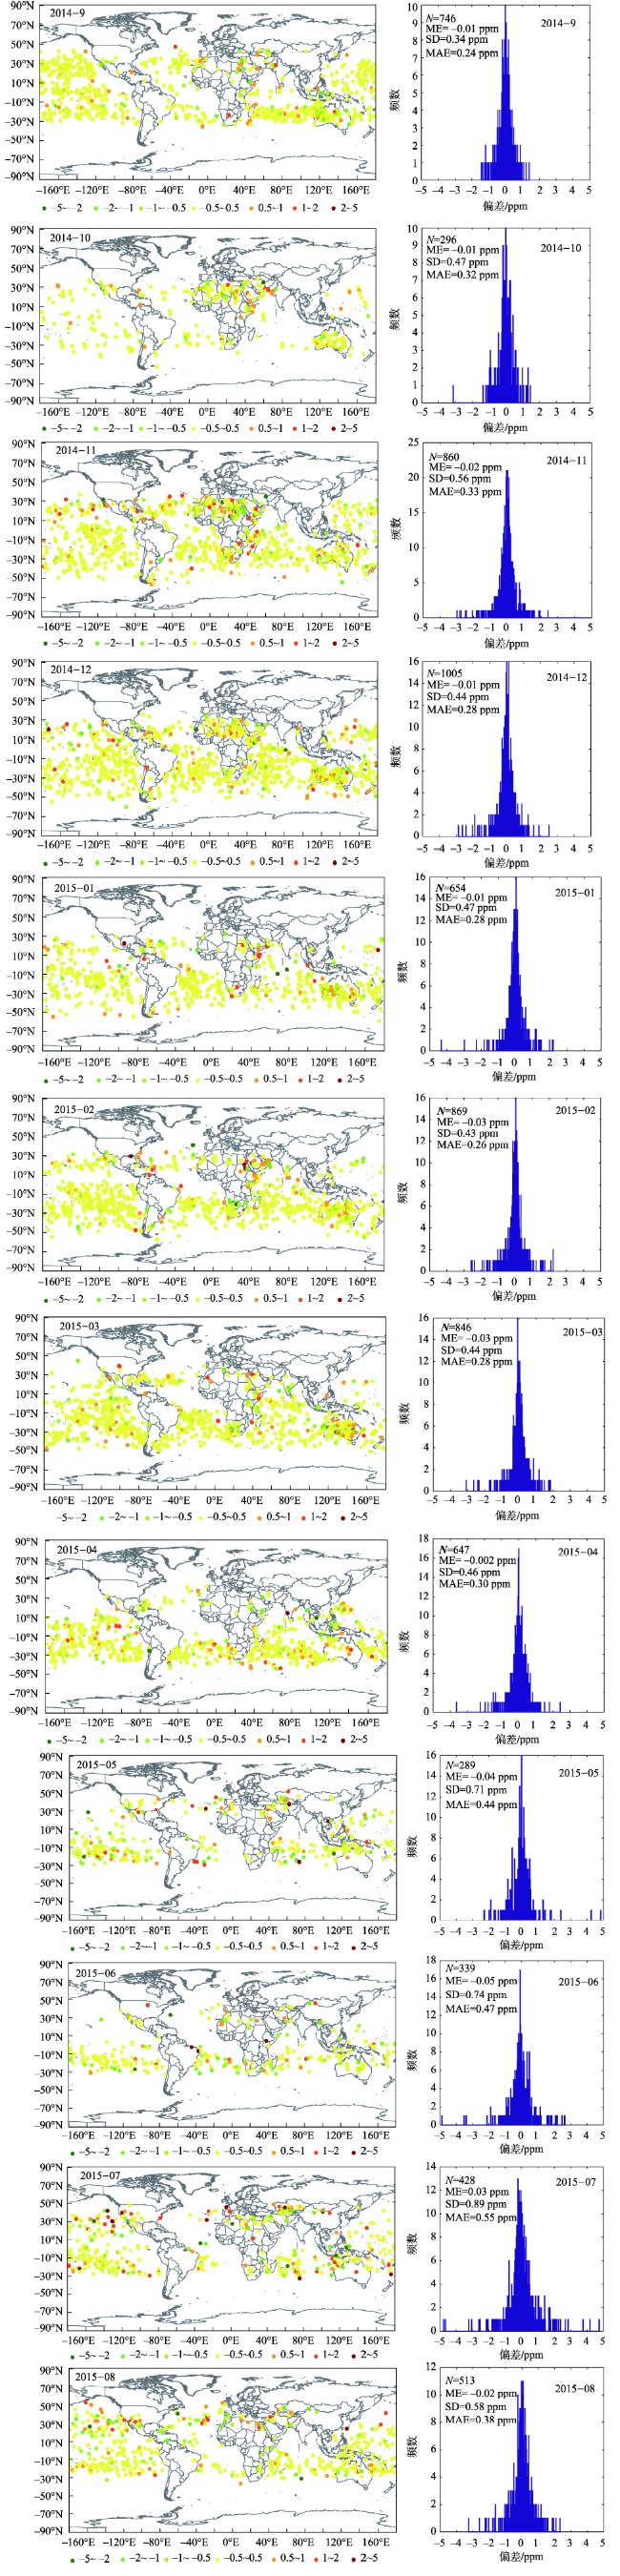
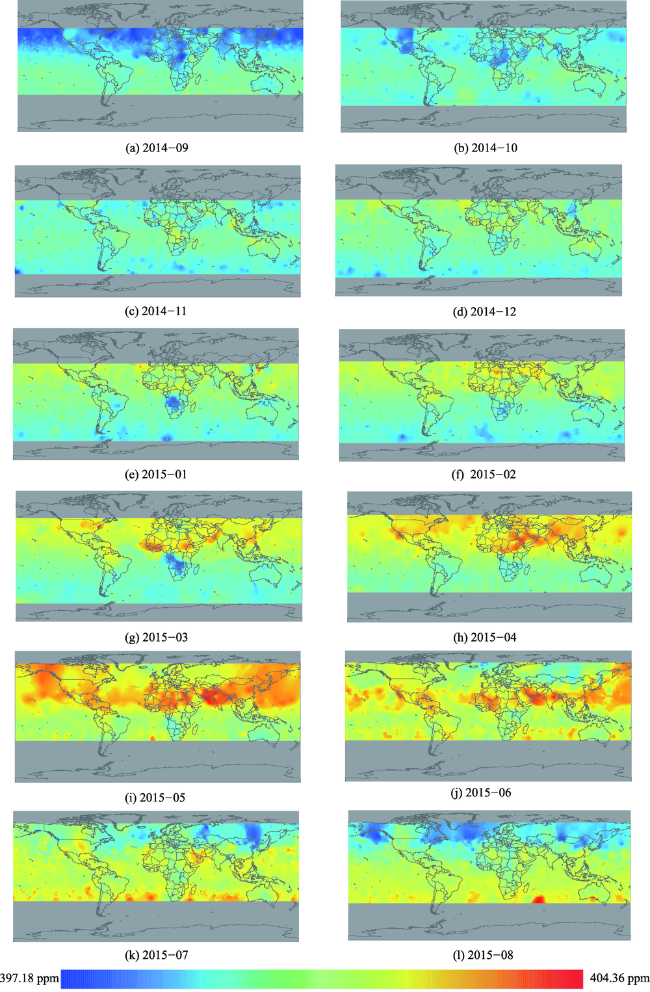
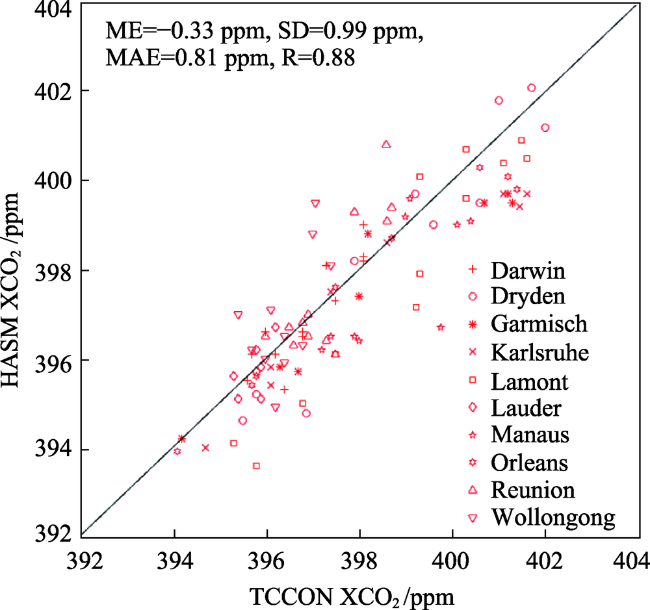
In this study, high accuracy surface modeling (HASM) is used to simulate the spatial distribution of XCO2 with high accuracy in a wild range of regions based on OCO-2 satellite's observations. Firstly, we discussed and analyzed the feasibility of HASM simulation of the spatial distribution of XCO2 observed by OCO-2 satellite. For the OCO-2's XCO2 from September 2014 to August 2015, 90% of each month's XCO2 data were randomly selected as the input of spatial interpolation and the remaining 10% were used to verify the result of spatial interpolation.The results show that the mean absolute error of 12 months is 0.34 ppm. Therefore, HASM is suitable for simulating the spatial distribution of XCO2 observed by OCO-2 satellite. Then we use HASM to simulate monthly XCO2 distribution at the spatial resolution of 0.5°×0.5° based on OCO-2's observations from September 2014 to August 2015. Simultaneously, the corresponding TCCON (Total Carbon Column Observing Network) observations are used to verify HASM's simulations. The result shows that the mean absolute error between HASM simulations and TCCON observations is 0.81 ppm and the correlation coefficient between them is 0.88. Therefore, HASM has great advantages in simulating the spatial distribution of XCO2 observed by OCO-2 satellite.

Cite this article

ZHANG Lili , ZHAO Mingwei , ZHAO Na , YUE Tianxiang . Modeling the Spatial Distribution of XCO2 with High Accuracy Based on OCO-2's Observations[J]. Journal of Geo-information Science, 2018 , 20(9) : 1316 -1326 . DOI: 10.12082/DQXXKX.2018.170121

1 引言

二氧化碳是全球变暖的重要温室气体[1,2,3,4,5,6,7],尽管已经通过各种措施来降低CO2的排放量,大气中的CO2还在持续增加。联合国政府间气候变化专门委员会第五次气候变化评估[8]指出,人类活动极有可能(95%置信度)导致了20世纪50年代以来的大部分(50%以上)全球地表平均气温升高。其中,温室气体在1951-2010年间可能贡献了0.5~1.3 ℃。因此,大气CO2浓度的时空分布变化研究是全球气候变化评估中的重要议题。
卫星遥感观测采用自上而下的观测大气的系统,是获取大气CO2浓度的重要手段。通过星上传感器获取大气CO2特有的光谱吸收特征反演获得CO2浓度,不受国界和地理条件的约束,节省大量的人力和物力,可得到实时的、大量的、连续的观测数据[5,9],包括极地、海洋、高山等地形条件恶劣的地区。世界上越来越多的国家开始研究专门用于观测大气CO2信息的卫星,尤其是对近地表敏感的短波近红外卫星观测有助于加强对温室气体源汇信息的精确获取。日本于2009年发射了第一颗碳卫星GOSAT[10],已提供多年的CO2数据产品。美国在OCO-1发射失败后,于2014年成功发射OCO-2[11],目前运行情况良好,已提供多种数据产品。中国于2016年底发射了中国自行研制的碳卫星TanSat[12],已发布对应的数据。尽管卫星观测范围广、数据量大,但由于云、气溶胶等的影响及反演算法的限制[13],卫星观测有效的CO2数据仅约为10%,因此,需要一种有效的空间插值模拟方法,根据有效的观测数据XCO2来填补空缺。
高精度曲面建模方法自20世纪90年代开始不断发展完善[7,14]。它基于曲面论基本定律,从微分几何原理出发,从理论上解决了插值过程中的峰值削平、边界震荡等问题,且与经典的插值方法相比,模拟精度有了很大的提高[15,16]。该模型已成功应用于人口分布、土壤属性、碳储量、气候领域等研究[17,18,19,20]
本文为了得到较大覆盖范围的CO2分布变化,首次采用HASM对2014年9月至2015年8月OCO-2卫星观测月均值XCO2数据进行空间插值,首先随机选择90%的观测数据用于空间插值,剩余10%的观测数据作为精度验证点来验证应用HASM进行XCO2空间插值的可靠性分析,然后采用地基TCCON站观测数据对XCO2插值结果进行交叉验证。

2 数据及方法

本文主要针对2014年9月至2015年8月的OCO-2卫星观测数据,采用高精度曲面建模的方法对卫星观测数据进行插值填补,形成观测范围内0.5°×0.5°的XCO2数据的空间分布,将对OCO-2卫星观测数据、地基TCCON站观测数据、高精度曲面建模方法以及本研究的模拟方案进行介绍。

2.1 OCO-2 卫星观测数据

NASA继2009年2月24日轨道碳观测者(OCO)发射失败后,轨道碳观测者2号(OCO-2)于2014年7月发射成功[21],意在监测近地表的碳源汇信息,是继GOSAT之后全球第二颗专用碳卫星,目前官网上发布的L2数据产品是从2014年9月6日开始,本文选取的为2014年9月至2015年8月的L2 XCO2数据,该数据空间分辨率为2.25 km×1.29 km,重返周期为16 d,选取的数据版本为OCO2_L2_Lite_FP.7r,尽管该观测数据的空间分辨率很高,但由于云、气溶胶等的影响,可用数据难以完全覆盖全球,在主要观测范围中低纬度地区仍存在不少空白。
按照OCO-2官方的数据产品说明手册[22],首先需要对XCO2观测数据进行质量筛选,获取质量较高的数据,依据观测点为陆地或海洋分别有不同的筛选方案:陆地观测质量筛选的指标(表1)和海洋观测质量筛选的指标(表2)。
Tab. 1 The indexes of screening quality for land observations

表1 陆地观测质量筛选的指标

字段 下限(≥) 上限(≤)
Warn level N/A 15
Outcome flag N/A 2
Preprocessors/h2o_ratio 0.700 1.030
Preprocessors/co2_ratio 0.995 1.025
Preprocessors/dp_apb -15.00 5.00
Retrieval/dp -5.00 10.0
Retrieval/aod_ice N/A 0.050
Reteieval/Aod_sulfate N/A 0.400
Retrieval/Aod_dust 0.001 0.30
Retrieval/co2_grad_del -70.0 70.0
Retrieval/albedo_2 0.10 N/A
Blended albedo(2.4*albedo_3-1.13*albedo_1) N_A 0.8
Dof_co2 1.8 N/A
Sounding/airmass N/A 3.6
Tab. 2 The indexes of screening quality for sea observations

表2 海洋观测质量筛选的指标

字段 下限(≥) 上限(≤)
Warn level N/A 15
Outcome flag N/A 2
Preprocessors/co2_ratio 0.994 1.020
Preprocessors/dp_apb N/A 0.00
Retrieval/dp -3.00 9.0
Retrieval/co2_grad_del -30.0 5.0
Retrieval/albedo_slope_3*10^5 1.0 10.0
Retrieval/windspeed 2.0 N/A
Sounding/snr_weak_co2 380 N/A
Sounding/airmass N/A 3.5
将2014年9月至2015年8月的OCO-2卫星观测数据,经过上述筛选后,筛选结果按月为单位进行统计,月统计结果见表3。从表3可以看出,这12个月中有效观测数据量最大值为380 597,出现在2014年12月,有效观测数据量最小值为16 254,出现在2015年5月。这一年的观测数据中,XCO2月均值最小值为395.53 ppm,出现在2014年10月,XCO2月均值最大值为398.59 ppm,出现在2015年6月,月均值呈现递增趋势,月平均增值为0.2 ppm。在这12个月的观测值中,观测值方差最小值为0.76 ppm,出现在2015年1月,且这个月的观测值较为集中;观测值方差最大值为1.55 ppm,出现在2015年6月,且这个月的观测值较为分散。
Tab. 3 Monthly statistics for OCO-2 observation data from September 2014 to August 2015

表3 2014年9月至2015年8月OCO-2观测数据的月统计

时间 个数 最小值/ppm 最大/ppm 均值/ppm 方差/ppm
2014-09 250 414 387.42 401.30 395.77 1.02
2014-10 34 356 391.60 401.01 395.53 0.89
2014-11 107 061 387.42 401.30 396.03 0.78
2014-12 380 597 390.13 403.80 396.45 0.84
2015-01 89 219 390.67 402.23 396.48 0.76
2015-02 147 529 390.13 403.02 396.34 0.96
2015-03 178 943 390.66 405.82 397.07 1.38
2015-04 47 624 392.88 404.49 397.31 1.38
2015-05 16 254 393.65 405.82 398.45 1.50
2015-06 73 722 388.68 405.83 398.59 1.55
2015-07 24 319 388.68 404.52 398.54 1.51
2015-08 28 152 390.42 405.83 398.18 1.41

2.2 地基TCCON观测数据

全球碳柱总量观测网 TCCON建立于2004年,它是傅立叶变换光谱仪的一个地基网络,它的科学目标是改善人们对碳循环的理解。地基观测提供高光谱分辨率太阳光谱,使用非线性最小二乘光谱拟合方法来反演温室气体柱总量,观测数据具有较好的稳定性,在云或气溶胶较少的情况下,傅里叶变换光谱仪的精度可以达到0.25%[23]。TCCON站点观测数据是目前验证卫星数据的最佳数据,广泛应用于卫星反演XCO2浓度的精度验证和相关参数校正[24]
第一个TCCON站点位于美国的Park Falls,至今在全球范围内已经有多个站点。现有的TCCON站主要分布在欧洲和北美洲,亚洲大陆、非洲大陆和南美洲大陆相当稀少。中国的一些大气本底站以及近几年在北京、合肥、深圳等地部署的地基 FTS 观测点,都有相应的观测产品,但这些站点暂时没有加入TCCON全球网络。TCCON观测网在亚洲只有日本茨城县筑波市Tsukuba站和九州岛佐贺县佐贺市Saga站进行常规观测。

2.3 高精度曲面建模HASM

HASM[14]是应用采样点数据通过一系列迭代计算对XCO2数据的空间分布进行全局模拟,进而对未采样点的XCO2数据进行插值的方法。HASM以高斯方程为基本方程,以采样点为约束条件,利用最小二乘原理将HASM转换为求算大型稀疏线性方程组。如果曲面表达为 z = f ( x , y ) ,则高斯方程组可表达为:
f xx = Γ 11 1 f x + Γ 11 2 f y + L ( E G - F 2 ) - 1 2 f yy = Γ 22 1 f x + Γ 22 2 f y + N ( E G - F 2 ) - 1 2 f xy = Γ 12 1 f x + Γ 12 2 f y + M E G - F 2 - 1 2 (1)
式中: f x fx, y)关于x的一阶偏导数; f y fx, y)关于y的一阶偏导数。其中:
E = 1 + f x 2 ; F = f x f y ; G = 1 + f y 2 ;
L = f xx 1 + f x 2 + f y 2 ; M = f xy 1 + f x 2 + f y 2 ; N = f yy 1 + f x 2 + f y 2 ;
Γ 11 1 = 1 2 ( G E x - 2 F F x + F E y ) ( E G - F 2 ) - 1 ,
Γ 12 1 = 1 2 ( G E y - F G x ) ( E G - F 2 ) - 1 ,
Γ 22 1 = 1 2 ( 2 G F y - G G x - F G y ) ( E G - F 2 ) - 1 ,
Γ 11 2 = 1 2 ( 2 E F x - E E y - F E x ) ( E G - F 2 ) - 1 ,
Γ 12 2 = 1 2 ( E G x - F E y ) ( E G - F 2 ) - 1 ,
Γ 22 2 = 1 2 ( E G y - 2 F F y + F G x ) ( E G - F 2 ) - 1 .
高斯方程组的矩阵表示形式可表示为:
A z n + 1 = d ( n ) B z n + 1 = q n C z n + 1 = p n (2)
式中: z ( n + 1 ) = ( f 1,1 n + 1 , , f 1 , J n + 1 , , f I , 1 n + 1 , , f I , J n + 1 ) T ; A、B和C分别代表高斯方程组第1个、第2个和第3个方程的系数矩阵, d ( n ) q ( n ) p n 分别代表右侧的常数项矩阵。
如果 f i , j ¯ z = f ( x , y ) 在计算域内第i个采样点( x i , y i )的值,模拟值应该与采样点的真实值相等或者相近,因此一个约束方程表达为:
s . t . S z n + 1 = k (3)
式中:采样点的系数矩阵S和采样点的值k可表示为:
S p , i - 1 × I + j = 1 (4)
k p = f i , j ¯ (5)
为了求解最小二乘问题的方程组,引入一个足够大的参数 λ ,它是采样点的权重,决定于采样点对模拟面的贡献,它可以是一个数值,代表所有采样点有相同的权重,也可以是一个矩阵,代表不同采样点有不同的权重。复杂区域受采样点的影响小于平坦区域,因此,在复杂区域 λ 值较小,而在平坦区域 λ 值较大。引入 λ ,高斯方程组可以表达为:
min A B C λ S z ( n + 1 ) - d n q n p n λ k (6)

2.4 模拟方案

高精度曲面建模是对地表系统或地表环境要素的空间位置准确的数字化描述,地表系统及其环境要素空间位置准确的数字描述可抽象为数学“曲面”[14],本研究中将卫星观测XCO2数据在地理空间中的分布近似抽象为“曲面”,基于采样点信息对全局XCO2分布进行模拟,本文主要针对2014年9月至2015年8月的OCO-2卫星观测数据,采用HASM模拟全球范围的、高精度的0.5°×0.5°的月均值XCO2分布,主要流程图如图1所示。
Fig. 1 The flow chart of simulating XCO2 distribution with high accuracy based on OCO-2 observation data

图1 基于OCO-2卫星观测模拟高精度XCO2分布流程图

首先对OCO-2观测数据按照数据产品手册陆地和海洋观测数据的质量删选方案分别进行过滤,获取质量较好的有效数据,将全球按照0.5°×0.5°进行格网划分,依次将当前月份中每一天的数据落到划分好的格网中,将每个格网内求平均值作为本格网在当前月份的月均值XCO2。然后对各个月均值,采用90%的数据进行模拟,10%的数据做验证,验证HASM模拟XCO2空间分布的可靠性,如果通过自身验证,则将各个月月均值采用HASM来模拟全球高精度XCO2分布,最后采用同时期地基TCCON站观测数据对HASM模拟结果进行精度分析。

3 模型验证及结果分析

按照2.4模拟方案,基于OCO-2观测的XCO2数据,采用HASM进行空间插值,填补观测范围内的空缺数据,使数据在空间上更加连续,来分析其空间分布特征。主要包括基于HASM模拟XCO2的自身验证、基于HASM模拟XCO2的空间分布特征和基于HASM模拟XCO2的交叉验证。

3.1 基于HASM模拟XCO2的自身验证

对于2014年9月至2015年8月每个月的月均值XCO2数据,首先采用ArcGIS中地统计的工具,随机选择90%作为插值计算使用的数据点,剩余10%作为精度验证点,将每个月随机选择的90%的数据用于HASM的插值计算,获得验证数据点所在位置的插值结果值,计算10%数据验证点所在位置的插值结果值与真实值之间的误差,其中,N表示验证点的个数,ME(Mean Error)表示误差均值,SD(Standard Deviation)表示误差标准差, MAE(Mean Absolute Error)表示平均绝对值误差。12个月的验证结果如图2所示。
Fig. 2 The distribution of monthly XCO2 bias between HASM simulations and OCO-2 observations at the resolution of 0.5°×0.5°from September 2014 to August 2015

图2 2014年9月至2015年8月0.5°×0.5°HASM模拟与OCO-2观测数据的XCO2偏差月均值分布
注:左侧为偏差空间分布图,右侧为偏差分布直方图

由偏差空间分布图和直方图(图2)可以看出,验证点均匀分布,误差偏差主要集中在-0.5~0.5 ppm,误差均值接近于0 ppm,误差标准差接近于0.5 ppm,由12个月的直方图可看误差分布接近标准正态分布。从图2中可以看到,HASM空间插值在2014年9月至2015年8月的平均绝对值误差分别为0.24、0.32、0.33、0.28、0.28、0.26、0.28、0.30 、0.44、0.47、0.55和0.38 ppm;最大误差出现在2015年7月;12个月平均绝对值误差为0.34 ppm。由此可见,HASM适用于OCO-2观测的XCO2数据的空间插值。本文3.2节将对各个月所有XCO2数据进行插值,从而研究分析OCO-2观测XCO2数据的空间分布特征。

3.2 基于HASM模拟XCO2的空间分布特征

将OCO-2观测月均值XCO2按照0.5°×0.5°进行格网划分,针对各个月均值XCO2在空间上的最大覆盖范围,确定各个月的模拟区域,然后基于HASM,对各个月XCO2模拟区域的空缺数据进行插值模拟, 2014年9月至2015年8月的模拟结果如图3所示。
Fig. 3 The spatial distribution of monthly XCO2 simulated by HASM at the resolution of 0.5°×0.5°from September 2014 to August 2015

图3 2014年9月至2015年8月HASM插值模拟的0.5°×0.5°的月均值XCO2空间分布

图3可见,基于OCO-2观测数据的插值模拟结果,尽管12个月的数据覆盖范围并不完全相同,但主要集中在中低纬度,并且北半球夏季(2015年7月、8月)在北半球覆盖的纬度更高,在北半球冬季(2014年11月至2015年3月)在南半球覆盖的纬度更高。HASM空间插值结果显示,2014年9月至2015年8月XCO2的12个月平均值约为400 ppm, 数据变化范围集中在391~405 ppm, 最大值由2014年9月的397.9 ppm升到2015年8月的404.2 ppm, 最大值的月增长值约为0.5 ppm。从全球来看,XCO2在7、8和9月呈现出南高北低的特征,而在1、2、3和4月呈现明显的北高南低特征,其他月份主要是赤道附近XCO2较高。
XCO2插值模拟结果基本遵循原始反演数据的趋势,在全球的分布格局与全球主要碳排放源的分布一致[25,26],在北半球的夏季,由于植被光合作用强烈,北半球大部分区域是碳汇,此时北半球XCO2低于南半球;当北半球是冬季时,植物吸收作用较弱,与此同时,人工取暖使碳排放量增大,因此北半球大部分区域成为碳源,此时北半球XCO2高于南半球。

3.3 基于HASM模拟XCO2的交叉验证

TCCON站观测XCO2数据被认为是验证卫星观测及模拟数据最有效的验证数据,因此本节采用TCCON站观测数据,选取时间序列数据较为完整的10个TCCON站,将TCCON站观测值统计的月平均XCO2值看做真值,对基于HASM模拟2014年9月至2015年8月的OCO-2的各个月均值XCO2的空间分布做交叉验证。具体验证结果见图4,其中,ME(Mean Error)表示模拟值与真实值的误差均值;SD(Standard Deviation)表示模拟值与真实值的误差标准差;MAE(Mean Absolute Error)表示模拟值与真实值的平均绝对值误差,R表示相关系数。
Fig. 4 The correlation between XCO2 simulated by HASM and TCCON observations

图4 HASM模拟的XCO2与对应TCCON站观测的相关性分析

图4可以看到,2014年9月至2015年8月XCO2月均值的HASM模拟值与TCCON真值之间的误差均值为0.33 ppm,误差标准差为0.99 ppm,平均绝对值误差为0.81 ppm,相关系数为0.88。可见,HASM模拟结果与TCCON站很接近,精度较高。因此,HASM在模拟OCO-2卫星观测的XCO2空间分布上具有较高的优势。

4 结论与展望

本研究首次基于HASM对卫星OCO-2观测数据进行插值模拟分析,首先,探讨HASM方法关于OCO-2观测反演数据空间插值的可用性分析。从2014年9月至2015年8月OCO-2观测反演的XCO2数据中,分别随机选择其90%用于空间插值,剩余10%作为精度验证点。精度验证结果表明,HASM空间插值在2014年9月至2015年8月的平均绝对值误差分别为0.24、0.32、0.33、0.28、0.28、0.26、0.28、0.30、0.44、0.47、0.55和0.38 ppm;最大误差0.55 ppm出现在2015年7月;12个月平均绝对值误差为0.34 ppm。由此可见,HASM适用于OCO-2观测XCO2的空间插值。因此,采用HASM对OCO-2在2014年9月至2015年8月的观测数据进行XCO2空间分布模拟,获取各个月0.5°×0.5°的月均值XCO2分布,同时对基于TCCON站观测对HASM模拟的OCO-2的各个月均值XCO2做交叉验证,验证结果表明,HASM模拟的XCO2与TCCON站对应观测数据相比,其平均绝对值误差为0.81 ppm,相关系数为0.88。因此,HASM在模拟OCO-2观测的XCO2空间分布上具有较高的优势。
从2014年9月至2015年8月的OCO-2的各个月观测范围内0.5°×0.5°的月均值XCO2分布图可以看出, 12个月XCO2月均值约为400 ppm, 变化范围集中在391~405 ppm, 最大值由2014年9月的397.9 ppm升到2015年8月的404.2 ppm, 最大值的月增长值约为0.5 ppm。从全球来看,XCO2在7、8和9月呈现出南高北低的特征,而在1、2、3和4月呈现明显的北高南低特征,其他月份主要是赤道附近XCO2较高。二氧化碳在全球的分布格局与全球主要碳排放源的分布一致,当北半球是夏季时,北半球大部分区域是碳汇,此时北半球XCO2低于南半球;当北半球是冬季时,北半球大部分区域是碳源,此时北半球XCO2高于南半球。
本研究主要针对单一卫星OCO-2观测数据进行插值分析,随着卫星遥感的发展,卫星观测已经成为大气二氧化碳浓度获取的主要手段,将获取越来越多的卫星数据,在后续研究中需要考虑联合多星数据来进行插值,有望获得更高时空分辨率、更高精度、更大覆盖范围的XCO2分布。此外,随着地基观测数据的不断增多,我们将会考虑以地基观测数据为优化控制条件,多星插值结果作为驱动场,基于HASM来获得天-地一体化的XCO2分布,也将有助于对碳循环的理解。
致谢:感谢OCO-2团队提供的卫星观测数据和TCCON团队提供的地基观测数据。

The authors have declared that no competing interests exist.

[1]
Yoshida Y, Ota1 Y, Eguchi1 N, et al. Retrieval algorithm for CO2 and CH4 column abundances from short-wavelength infrared spectral observations by the Greenhouse gases observing satellite[J]. Atmospheric Measurement Techniques, 2011,4(4):717-734.

DOI

[2]
Yoshida Y, Kikuchi N, Morino I, et al.Improvement of the retrieval algorithm for GOSAT SWIR XCO2 and XCH4 and their validation using TCCON data[J]. Atmospheric Measurement Techniques, 2013,6(6):1533-1547.

DOI

[3]
Oshchepkov S, Bril A, Maksyutov S, et al.Detection of optical path in spectroscopic space-based observations of greenhouse gases: Application to GOSAT data processing[J]. Journal of Geophysical Research, 2011,116(D14): D14304.

DOI

[4]
Oshchepkov S, Bril A, Yokota T, et al.Effects of atmospheric light scattering on spectroscopic observations of greenhouse gases from space: Validation of PPDF-based CO2 retrievals from GOSAT[J]. Journal of Geophysical Research, 2012,117(D12):D12305.

[5]
Guerlet S, Butz A, Schepers D, et al.Impact of aerosol and thin cirrus on retrieving and validating XCO2 from GOSAT shortwave infrared measurements[J]. Journal of Geophysical Research, 2013,118(10):4887-4905.

[6]
Buchwitz M, Reuter M, Bovensmann H, et al.Carbon Monitoring Satellite(CarbonSat): Assessment of atmospheric CO2 and CH4 retrieval errors by error parameterization[J]. Atmospheric Measurement Techniques, 2013,6(12):3477-3500.

DOI

[7]
Yue T X, Zhang L L, Zhao M W, et al.Space- and ground-based CO2 measurements: A review[J]. China Science Earth Sciences, 2016,59(11):2089-2097.The climate warming is mainly due to the increase in concentrations of anthropogenic greenhouse gases, of which CO 2 is the most important one responsible for radiative forcing of the climate. In order to reduce the great estimation uncertainty of atmospheric CO 2 concentrations, several CO 2 -related satellites have been successfully launched and many future greenhouse gas monitoring missions are planned. In this paper, we review the development of CO 2 retrieval algorithms, spatial interpolation methods and ground observations. The main findings include: 1) current CO 2 retrieval algorithms only partially account for atmospheric scattering effects; 2) the accurate estimation of the vertical profile of greenhouse gas concentrations is a long-term challenge for remote sensing techniques; 3) ground-based observations are too sparse to accurately infer CO 2 concentrations on regional scales; and 4) accuracy is the primary challenge of satellite estimation of CO 2 concentrations. These findings, taken as a whole, point to the need to develop a high accuracy method for simulation of carbon sources and sinks on the basis of the fundamental theorem of Earth surface modelling, which is able to efficiently fuse space- and ground-based measurements on the one hand and work with atmospheric transport models on the other hand.

DOI

[8]
IPCC (Intergovernmental Panel on Climate Change), Climate Change: Synthesis Report. Contribution of Working Groups I, II and III to the Fifth Assessment Report of the IPCC[R]. 2014.

[9]
Bovensmann H, Buchwitz M, Burrows J P, et al.A remote sensing technique for global monitoring of power plant CO2 emissions from space and related applications[J]. Atmospheric Measurement Techniques, 2010,3(4):781-811.

DOI

[10]
Yoshida Y, Kikuchi N, Yokota T.On-orbit radiametric calibration of SWIR bands of TANSO-FTS onboard GOSAT[J]. Atmospheric Measurement Techniques, 2012,5(10):2515-2523.

DOI

[11]
Frankenberg C, Pollock R, Lee R A M, et al. The Orbiting Carbon Observatory (OCO-2): Spectrometer performance evaluation using pre-launch direct sun measurements[J]. Atmospheric Measurement Techniques, 2015,8(1):301-313.

DOI

[12]
刘毅,蔡兆南,杨东旭,等.中国二氧化碳科学实验卫星高光谱探测仪光谱指标,影响分析及优化方案[J].科学通报,2013,58(27):2787-2789.<p>中国第一颗二氧化碳科学试验卫星(碳卫星: TanSat)将搭载高光谱分辨率的光栅光谱仪. 信噪比、光谱分辨率、光谱范围和光谱采样频率是决定卫星遥感监测大气二氧化碳精度的核心指标. 利用中国科学院大气物理研究所自主研发的碳卫星仪器指标模拟分析系统和短波红外反演算法, 分析和论证了碳卫星二氧化碳探测仪的光谱指标对二氧化碳柱平均混合比(XCO<sub>2</sub>)反演精度的影响, 并利用GOSAT卫星观测数据进行了XCO<sub>2</sub>的反演试验. 研究表明, 低光谱采样频率主要影响二氧化碳弱吸收带(1.61 &mu;m)观测精度, 可以造成XCO<sub>2</sub>反演误差达到1 ppm (1 ppm=1 &mu;L L<sup>-1</sup>). 通过降低光谱分辨率, 将光谱采样频率提高至2.0以上可以有效降低采样频率的影响, 为提高中国碳卫星的观测精度奠定了理论基础.</p>

DOI

[ Liu Y, Cai Z N, Yang D X, et al.Optimization of the instrument configuration for Tan Sat CO2 spectrometer[J]. Chinese Science Bulletin, 2013,58(27):2787-2789. ]

[13]
Mao J, Kawa S R.Sensitivity studies for space-based measurement of atmospheric total column carbon dioxide by reflected sunlight[J]. Applied Optics, 2004,43(4):914-927.

DOI

[14]
Yue T X.Surface modeling: High accuracy and high speed methods[M]. Boca Raton: CRC Press, 2011.

[15]
岳天祥,杜正平,刘纪远.高精度曲面建模与误差分析[J].自然科学进展,2004,14(3):300-306.

[ Yue T X, Du Z P, Liu J Y.High precision surface modeling and error analysis[J]. Progress in Natural Science, 2004,14(3):300-306. ]

[16]
岳天祥,杜正平.高精度曲面建模与经典模型的误差比较分析[J].自然科学进展,2006,16(8):986-991.通过数值实验,比较分析了高精度曲面建模(HASM)与TIN,Cubic,Spline,IDW和Kriging等经典模型的模拟误差.误差分析结果表明,当采样间距为2h,迭代次数为64时,HASM的平均绝对误差是TIN的1/47470,Cubic的1/4941,Spline的1/2746,IDW的1/449520,Krig- ing的1/450530;HASM的平均相对误差是TIN的1/52170,Cubic的1/6206,Spline的1/3707, IDW的1/573252,Kriging的1/575049.虽然HASM具有自动捕捉峰值、消除边界振荡和精度高等非常好的数值特点,但存在运算量较大的问题.

DOI

[ Yue T X, Du Z P.High accuracy surface modeling and comparative analysis of its errors[J]. Progress in Natural Science, 2006,16(8):986-991. ]

[17]
Tian Y Z, Yue T X, Zhu L F, et al.Modeling population density using land cover data. Ecological Modelling[J], 2005,189(1-2):72-87.

[18]
史文娇,刘纪远,杜正平,等. 基于地学信息的土壤属性高精度曲面建模[J].地理学报,2011,66(11):1574-1581.There are two main limitations in surface modeling of soil property. One is the small number of available observations, and the other is the nonlinearity of the relationship between environmental variables and soil properties. It is still needed to research how high accuracy surface modeling (HASM) is combined with geographical information in soil property interpolation. This paper presented the method of HASM combined geographical information for soil property interpolation (HASM-SP). Based on types of soil, land use and parent rocks, we simulated the spatial distribution of soil properties of soil available P, Li, pH, alkali-hydrolyzable N, total K and Cr in a typical red soil hilly region. We compared the performance of HASM-SP, ordinary kriging (OK), ordinary kriging combined geographical information (OK-Geo) and stratified kriging (SK). The results showed that the methods combined with geographical information (HASM-SP and OK-Geo) obtained a lower estimation bias. Compared with the other three methods (OK-Geo, OK and SK), HASM-SP showed less MAEs and RMSEs. From the interpolation maps, much more details were presented in the HASM-SP maps of soil properties due to the abrupt boundary from spatial variation of geographical information. Therefore, HASM-SP can not only improve the interpolation accuracy but also characterize the spatial variation of soil property surface in the abrupt boundary, which can make the map consistent with the true geographical information. HASM-SP has great significance for enriching the theory of high accuracy surface modeling of soil property, and providing scientific evidence for the application of the soil management, precision agriculture and regional environment planning.

DOI

[ Shi W J, Liu J Y, Du Z P, et al.High accuracy surface modeling of soil properties based on geographic information[J]. Acta Geographica Sinaica, 2011,66(11):1574-1581. ]

[19]
赵明伟,岳天祥,赵娜,等.基于HASM的中国森林植被碳储量空间分布模拟[J].地理学报,2013,68(9):1212-1224.

[ Zhao M W, Yue T X, Zhao N, et al.Spatial distribution of forest vegetation carbon stock in China based on HASM[J]. Acta Geographica Sinaica, 2013,68(9):1212-1224. ]

[20]
赵娜,岳天祥,王晨亮.1951-2010年中国季平均降水高精度曲面建模分析[J].地理科学进展,2013,32(1):49-58.利用1951-2010年中国711个气象观测站的月降水资料,对多年季平均降水根据中国农业气候类型进行分区模拟。针对中国降水特点,首先分析了影响各分区降水的地理、地形因素及局部地形因素,利用多项式回归和逐步回归的方法对各分区降水进行了趋势拟合;在此基础上,采用改进的高精度曲面建模(HASM)方法,对各模拟区域去掉趋势后的残差进行迭代修正,并比较验证了模拟效果。同时,为保证HASM在边界附近的模拟精度,根据区域内站点间的距离,对每一分区设置一个缓冲区,将HASM实际插值区域扩展为缓冲区内的部分。模拟结果表明:HASM方法的模拟精度在不同区域不同季节内均比经典的插值方法模拟精度高。利用上述方法分析了同一季节各分区降水的分布特点,并模拟了不同季节内多年平均降水的空间分布状况,模拟结果符合我国降水的实际分布特点。

DOI

[ Zhao N, Yue T X, Wang C L.Surface modeling of seasonal mean precipitation in China during 1951-2010[J]. Progress in Geography, 2013,32(1):49-58. ]

[21]
Crisp D, Pollock H R, Rosenberg R, et al.The on-orbit performance of the Orbiting Carbon Observatory-2(OCO-2) instrument and its radiometrically calibrated products[J]. Atmospheric Measurement Techniques, 2017,10(1):59-81.

DOI

[22]
OCO-2 project, OCO-2 XCO2 Lite Product, Warn Levels, . and Bias Correction[R]. 2015.

[23]
Wunch D, Toon G C, Wennberg P O, et al.Calibration of the total carbon column observing network using aircraft profile data[J]. Atmospheric Measurement Techniques, 2010,3(5):1351-1362.The Total Carbon Column Observing Network (TCCON) produces high-precision ground-based dry-air mole fractions of CO2, CO, CH4 and N2O at a variety of sites worldwide. The accuracy of these measurements, however, depends on their calibration onto the World Meteorological Organization (WMO) standards. We present a global calibration of TCCON data using WMO-standard instrumentation aboard the HIAPER Pole-to-Pole Observations (HIPPO) aircraft, which performed profiles over three TCCON stations during 2008 and 2009. These calibrations will be put in context with earlier calibrations during the INTEX-NA, COBRA and TWP-ICE campaigns.

DOI

[24]
Wunch D, Toon G C, Blavier J F L, et al. The total carbon column observing network[J]. Philosophical Transactions of the Royal Society, 2011, A369(1943):2087-2112.Abstract A global network of ground-based Fourier transform spectrometers has been founded to remotely measure column abundances of CO(2), CO, CH(4), N(2)O and other molecules that absorb in the near-infrared. These measurements are directly comparable with the near-infrared total column measurements from space-based instruments. With stringent requirements on the instrumentation, acquisition procedures, data processing and calibration, the Total Carbon Column Observing Network (TCCON) achieves an accuracy and precision in total column measurements that is unprecedented for remote-sensing observations (better than 0.25% for CO(2)). This has enabled carbon-cycle science investigations using the TCCON dataset, and allows the TCCON to provide a link between satellite measurements and the extensive ground-based in situ network. 2011 The Royal Society

DOI PMID

[25]
Oda T, Maksyutov S.A very high-resolution global fossil fuel CO2 emmision inventory derived using a point source database and satellite observations of nighttime lights[J]. Atmospheric Chemistry and Physics, 2011,11(2):543-556.

DOI

[26]
Keppel-Aleks G, Wennberg P O, O'Dell C W, et al. Towards constraints on fossil fuel emissions from total column carbon dioxide[J]. Atmospheric Chemistry and Physics, 2013,13(8):4349-4357.

DOI

Outlines

/