
Journal of Geo-information Science >
Characteristics and Impact Factors of Evapotranspiration in Ugan and Kuqa Rivers Delta Oasis Based on SEBAL Model
Received date: 2018-01-11
Request revised date: 2018-06-06
Online published: 2018-09-25
Supported by
National Natural Science Foundation of China, No.41361016, 40901163.
Copyright
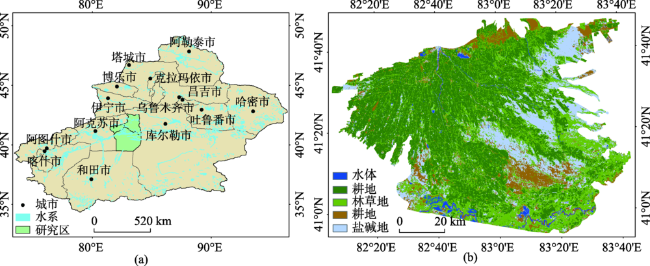
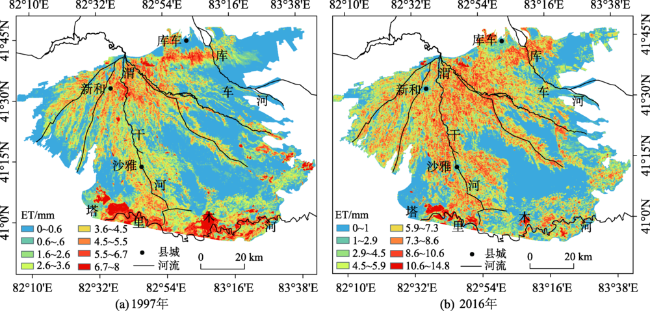
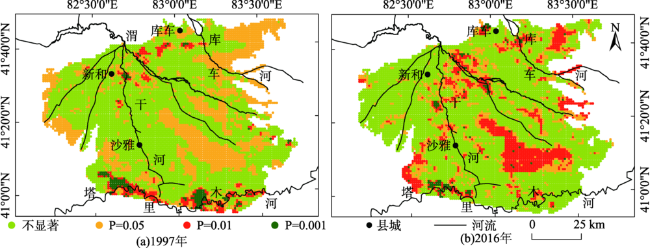
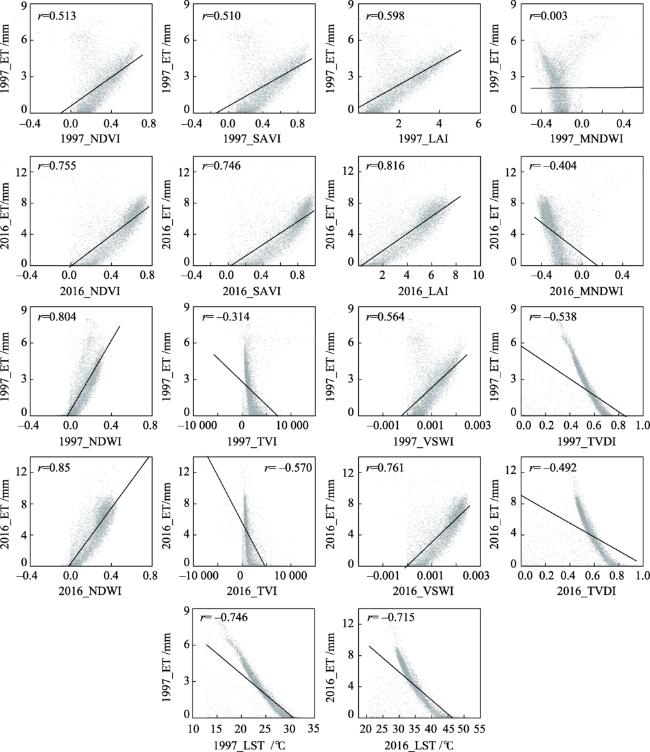
The arid zone refers to the arid climate area, which accounts for about 30% of the land area. The common characteristics are: the precipitation is low and the change rate is large, the ranges of both the daily and annual temperature are large, and the evaporation is far greater than the precipitation. Thus, the estimation of evapotranspiration in the Ugan and Kuqa Rivers Delta Oasis plays an important role in the management and allocation of water resources. At the same time, it has a great significance to understand the water cycle and hydrological process of the study area. In this paper takes the Ugan and Kuqa Rivers Delta Oasis as the study site, the daily evapotranspiration of Ugan and Kuqa Rivers Delta Oasis in 1997(August 30) and 2016(August 2) was estimated, and the spatial distribution characteristics of daily evapotranspiration, and the correlation between daily evapotranspiration and relative surface parameters were analyzed by combining Landsat TM/OLI remote sensing images with meteorological data, and using SEBAL model. The results showed that the spatial distribution of daily evapotranspiration in the Ugan and Kuqa Rivers Delta Oasis was characterized by distribution patterns of high to low from west to east, and from north to south. The high value appeares in the oasis area covered with abundant water and vegetation, and the low value is distributed in the east, southeast and west part of the study area with the low vegetation coverage. In terms of the correlation between the daily evapotranspiration and surface parameters, such as vegetation indices (NDVI, SAVI, LAI), water indices (MNDWI, NDWI, TVI, VSWI, TVDI) and land surface temperature (LST), the daily evapotranspiration showed the good correlation with every index. The Pearson correlation coefficients past the significance test at 0.01 level, especially with a best correlation with NDWI. the results indicate that water bodies are the most important factor for distribution and changes of the daily evapotranspiration in the Ugan and Kuqa Rivers Delta Oasis.
ABDUSALAM Turup , MAMAT Sawut , MA Chunyue , ZHANG Shuxia . Characteristics and Impact Factors of Evapotranspiration in Ugan and Kuqa Rivers Delta Oasis Based on SEBAL Model[J]. Journal of Geo-information Science, 2018 , 20(9) : 1361 -1372 . DOI: 180043/dqxxkx.2018.180043
Fig. 1 Location of the study area and its land use / cover map图1 研究区域地理位置与土地利用/覆被类型图 |
Tab. 1 Formula and description of relevant surface parameters表1 相关地表参数的公式及描述 |
| 参数名称 | 公式 | 公式参变量及描述 | |
|---|---|---|---|
| 植被指数 | 归一化植被指数NDVI | (NIR-R)/(NIR+R) | NIR、R分别为近红外波段和红波段 |
| 土壤调整植被指数SAVI | (NIR-R)/(NIR+R+L)×(1+L) | NIR、R分别为近红外波段和红波段,L为常数,一般取值为0.5 | |
| 叶面积指数LAI | 3.618×EVI-0.118 | EVI为增强植被指数 | |
| 增强植被指数EVI | 2.5×(NIR-R)/(NIR+6×R-7.5×B+1) | NIR、R和B分别为近红外波段、红波段和蓝波段 | |
| 水体指数 | 改进的归一化水体指数MNDWI | (Green-MIR)/(Green+MIR) | Green、MIR分别为绿波段和中红外波段 |
| 归一化水体指数NDWI | (Green-NIR)/(Green+NIR) | Green、NIR分别为绿波段和近红外波段 | |
| 温度植被指数TVI | TS/NDVI | TS、NDVI分别为地表温度和归一化植被指数 | |
| 植被供水指数VSWI | NDVI/TS | NDVI、TS分别为归一化植被指数和地表温度 | |
| 温度植被干旱指数TVDI | (TS-TS min)/(TS max-TS min) | TS、TS max、TS min分别为地表温度、最大地表温度和最小地表温度 | |
| 地表温度 | 黑体辐射亮度B(TS) | [Lλ-L↑-τ(1-ε)L↓]/τε | Lλ、L↑、L↓分别为卫星传感器接收到的热红外辐射亮度值、大气上行辐射亮度和大气下行辐射亮度;ε、τ分别为地表辐射率和大气在热红外波段的透过率 |
| 地表温度LST | K2/ln[K1/B(TS)+1] | K1、K2是定标常数,对于Landsat8 TIRS数据第十波段的K1值为774.89,K2值为1321.08;B(TS)为黑体辐射亮度 |
Tab. 2 SEBAL model accuracy validation results表2 SEBAL模型精度验证结果 |
| 站点 | 经度 | 纬度 | 1997年 | 2016年 | |||||
|---|---|---|---|---|---|---|---|---|---|
| FAO P-M/mm | SEBAL/mm | 相对误差/% | FAO P-M/mm | SEBAL/mm | 相对误差/% | ||||
| 库车 | 82.97 | 41.72 | 6.05 | 4.86 | 19.67 | 7.76 | 6.44 | 17.01 | |
| 新和 | 82.62 | 41.53 | 5.33 | 4.41 | 17.26 | 8.03 | 6.51 | 18.93 | |
| 沙雅 | 82.78 | 41.23 | 6.51 | 4.89 | 24.88 | 8.21 | 6.88 | 16.2 | |
Fig. 2 Spatial distribution map of daily ET in 1997 and 2016图2 蒸散量空间分布图 |
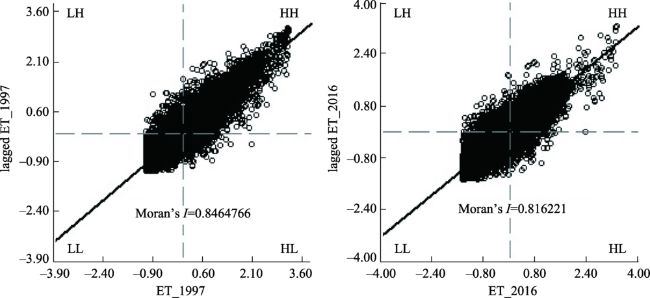
Fig. 3 Moran scatter of daily evapotranspiration in research area图3 研究区日蒸散量Moran散点图 |
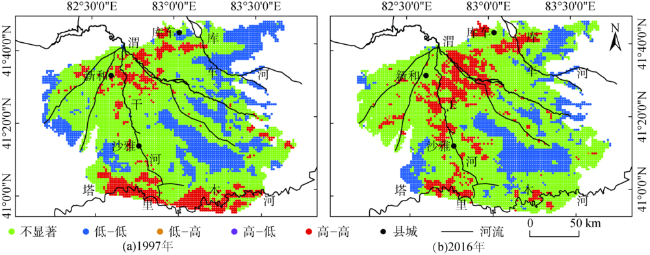
Fig. 4 The LISA cluster graph of daily evapotranspiration in research area图4 研究区日蒸散量LISA聚集图 |
Fig. 5 The LISA significant level of daily evapotranspiration in research area图5 研究区日蒸散量显著性水平 |
Tab. 3 The Pearson correlation coefficient between evapotranspiration and different surface parameters of research area in 1997 and 2016表3 研究区1997年和2016年日蒸散量与不同地表参数的Pearson相关系数(r) |
| Index | 1997 ET | 2016 ET | |
|---|---|---|---|
| 植被指数 | NDVI | 0.513** | 0.755** |
| SAVI | 0.510** | 0.746** | |
| LAI | 0.598** | 0.816** | |
| 水体指数 | MNDWI | 0.003** | -0.404** |
| NDWI | 0.803** | 0.850** | |
| TVI | -0.314** | -0.569** | |
| VSWI | 0.564** | 0.761** | |
| TVDI | -0.538** | -0.492** | |
| 地表温度 | LST | -0.746** | -0.715** |
注:**相关系数在0.01水平上显著 |
Fig. 6 Correlations between evapotranspiration and different surface parameters of research area in 1997 and 2016图6 研究区1997年和2016年日蒸散量与不同地表参数的相关性 |
The authors have declared that no competing interests exist.
| [1] |
[
|
| [2] |
[
|
| [3] |
|
| [4] |
[
|
| [5] |
|
| [6] |
|
| [7] |
|
| [8] |
|
| [9] |
|
| [10] |
|
| [11] |
|
| [12] |
[
|
| [13] |
[
|
| [14] |
[
|
| [15] |
[
|
| [16] |
[
|
| [17] |
[
|
| [18] |
[
|
| [19] |
[
|
| [20] |
[
|
| [21] |
[
|
| [22] |
|
| [23] |
|
| [24] |
[
|
| [25] |
[
|
| [26] |
[
|
| [27] |
|
| [28] |
|
| [29] |
|
| [30] |
[
|
| [31] |
|
| [32] |
[
|
| [33] |
|
| [34] |
[
|
| [35] |
[
|
| [36] |
[
|
| [37] |
[
|
| [38] |
[
|
| [39] |
[
|
| [40] |
[
|
| [41] |
[
|
| [42] |
|
| [43] |
|
| [44] |
|
| [45] |
|
| [46] |
[
|
| [47] |
[
|
/
| 〈 |
|
〉 |