
Journal of Geo-information Science >
Analysis of Precipitation Variation Characteristics and Barycenter Shift in Guizhou Plateau during 1960-2016
Received date: 2018-04-28
Request revised date: 2018-07-23
Online published: 2018-10-17
Supported by
Project of National Key Research and Development Program of China in the 13th Five-year Plan, No.2016YFC0502607
National Natural Science Foundation, No.41761003
Project of Social Development of Guizhou Province, No.[2013]3127
Doctoral Foundation of Guizhou Normal University in 2015, No.0514177.
Copyright
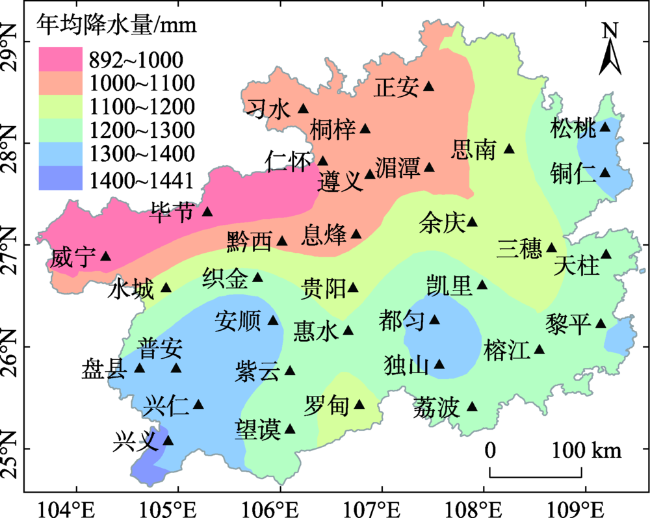
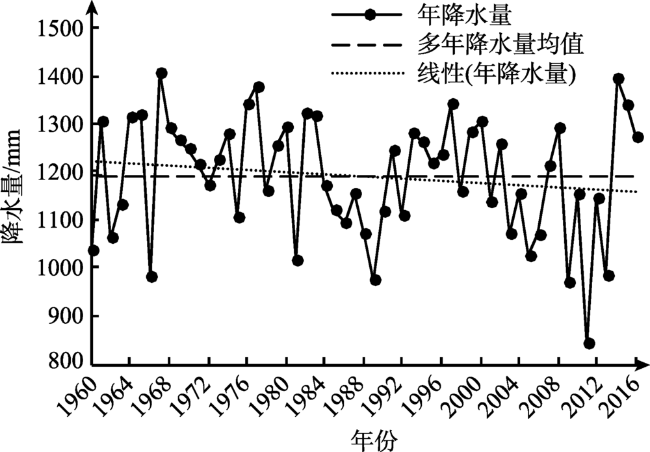
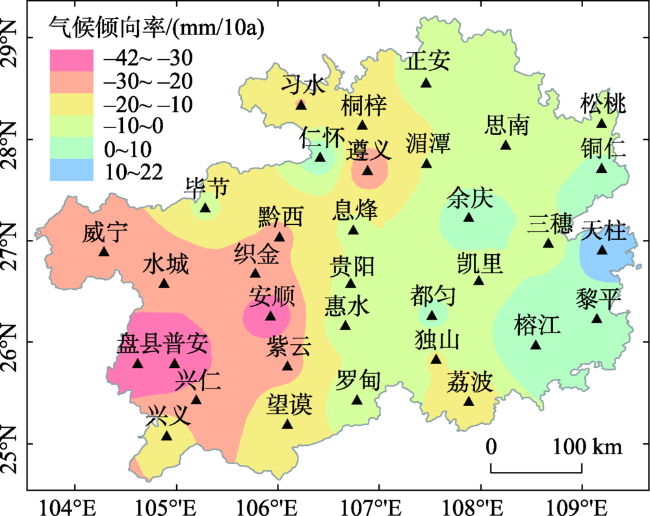
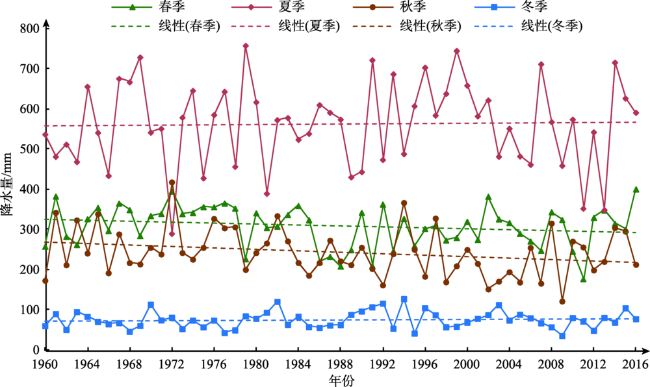
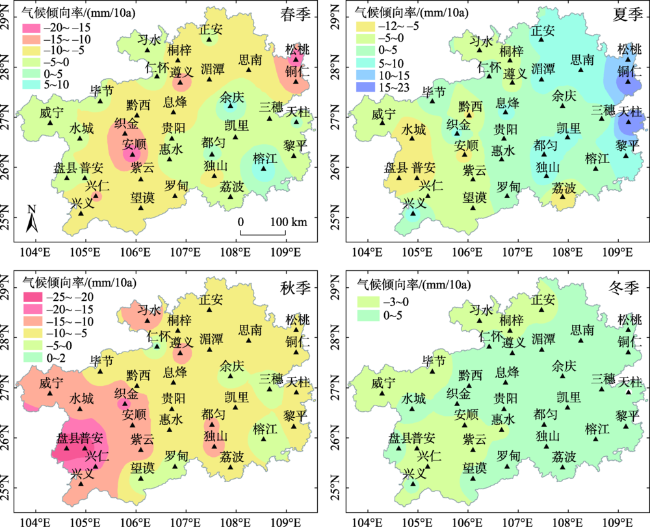
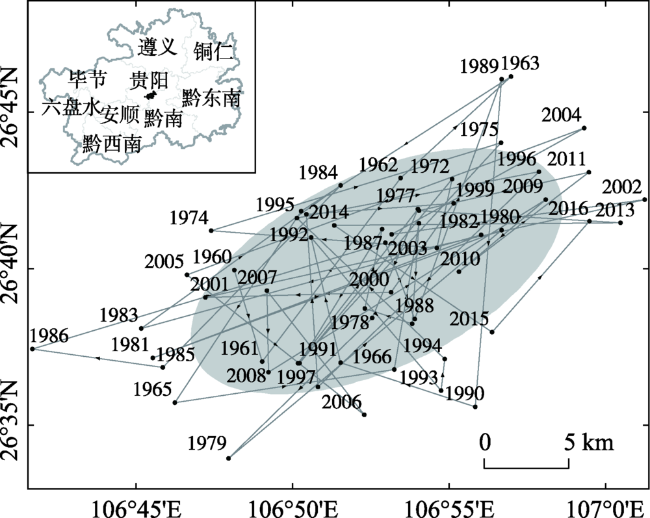
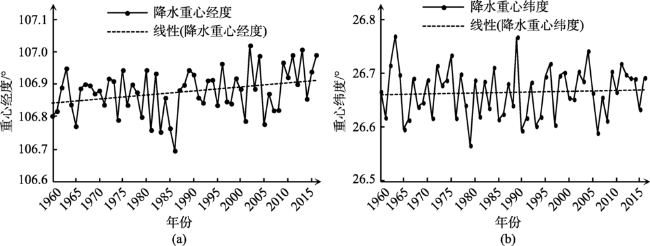
Based on the precipitation data of 34 meteorological stations in Guizhou Plateau from 1960 to 2016, the study analyzed the spatial-temporal distribution of precipitation and its barycenter shift in Guizhou Plateau at different time scales using the Co-Kriging method, Mann-Kendall trend test method, the climate tendency rate and barycenter model. The results indicate that: (1) The average annual precipitation over the Guizhou Plateau was characterized by decreasing from the south and the east to the northwest.There were three rainy centers in the south and east of Guizhou Plateau, respectively located in the northward transport path of the southwest warm and humid airflow (Xingyi-Anshun area), the windward slope of the Miaoling Mountains (Duyun-Dushan area) and the windward slope of the Wuling Mountains (Tongren- Songtao area); And the less rainy area was located in Weining and Bijie, where is the leeward slope of the Wumeng Mountains. (2) The chronological changes of precipitation from 1960 to 2016 presented volatility, the precipitation variability of 2010s was the largest, and the precipitation variability of 1990s was the smallest; the interannual variation was more dramatic, showing a not-significant decrease trend, which presented a spatial reduction in the central and western regions and increase in eastern regions. The differences in seasonal precipitation was obviously, precipitation decreased significantly in spring and autumn, and did not increase significantly in summer and winter.The change of precipitation in each month was different. The increase in precipitation was most significant in January and March, and the decline in precipitation in April was the most significant. (3) The precipitation barycenter was distributed in the southwest-northeast direction, and there had been a clear eastward shift in the past 57 years. The decrease of precipitation in Guizhou Plateau had the possibility of being associated with the weakening of the Southwest Monsoon. The above results are of great significance to the allocation of water resources and the prevention of flood disasters in Guizhou.
ZHAO Zhilong , LUO Ya , YU Junlin , LUO Xuqin , YANG Yueyan . Analysis of Precipitation Variation Characteristics and Barycenter Shift in Guizhou Plateau during 1960-2016[J]. Journal of Geo-information Science, 2018 , 20(10) : 1432 -1442 . DOI: 10.12082/dqxxkx.2018.180215
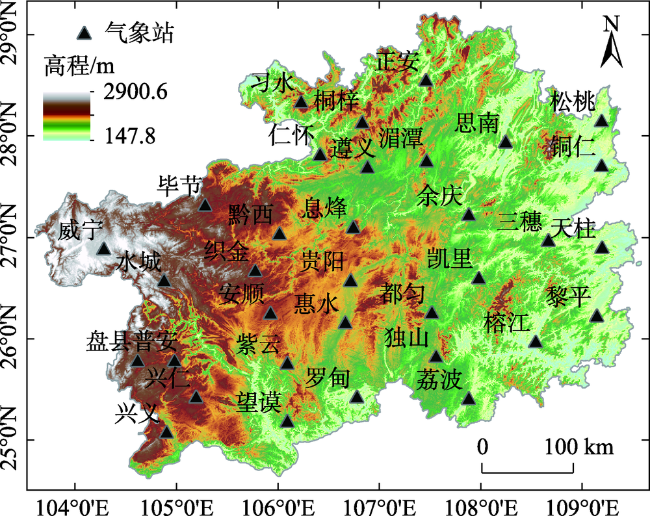
Fig. 1 Locations of study area and 34 meteorological stations图1 研究区及34个气象站分布位置 |
Fig. 2 Average annual rainfall distribution of Guizhou Plateau图2 贵州高原多年平均降水量分布 |
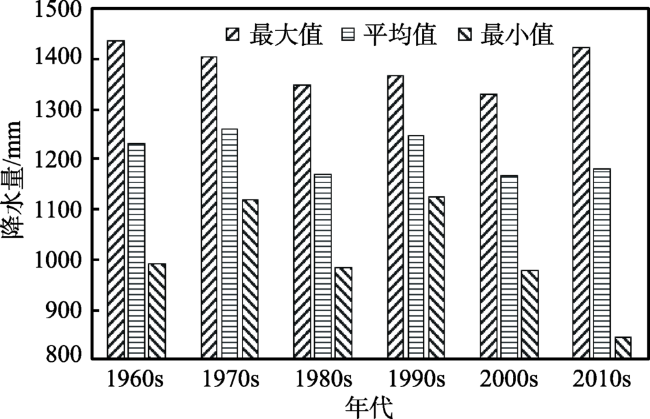
Tab. 1 Statistical table of interdecadal precipitation variation from 1960s to 2010s表1 1960s-2010s年降水量年代变化统计表 |
| 1960s | 1970s | 1980s | 1990s | 2000s | 2010s | |
|---|---|---|---|---|---|---|
| 平均值/mm | 1210.84 | 1237.30 | 1152.62 | 1224.51 | 1148.54 | 1160.93 |
| 最大值/mm | 1406.01 | 1376.85 | 1321.70 | 1341.28 | 1304.57 | 1394.44 |
| 最小值/mm | 980.56 | 1104.37 | 973.90 | 1108.13 | 968.35 | 841.19 |
| 标准差/mm | 145.59 | 82.31 | 123.78 | 75.73 | 116.19 | 197.01 |
| 变异系数 | 0.12 | 0.07 | 0.11 | 0.06 | 0.10 | 0.17 |
Fig. 3 Statistical graph of interdecadal precipitation variation from the 1960s to 2010s图3 1960s-2010s年降水量年代变化统计图 |
Fig. 4 Inter-annual variation of precipitation from 1960 to 2016图4 1960-2016年降水量年际变化 |
Fig. 5 Distribution of precipitation climate trendency rate from 1960 to 2016图5 1960-2016年降水气候倾向率分布 |
Fig. 6 Trends of four seasons precipitation in Guizhou Plateau from 1960 to 2016图6 1960-2016年贵州高原四季降水量变化趋势 |
Fig. 7 Spatial distribution of four seasons' precipitation tendency rate in Guizhou Plateau from 1960 to 2016图7 1960-2016年贵州高原四季降水气候倾向率空间分布 |
Tab. 2 Monthly precipitation and its tendency rate from 1960 to 2016表2 1960-2016年各月降水量及变化趋势 |
| 1月 | 2月 | 3月 | 4月 | 5月 | 6月 | 7月 | 8月 | 9月 | 10月 | 11月 | 12月 | |
|---|---|---|---|---|---|---|---|---|---|---|---|---|
| 平均值/mm | 25.0 | 26.8 | 43.9 | 93.8 | 171.0 | 219.3 | 190.7 | 152.2 | 102.9 | 93.0 | 48.1 | 23.8 |
| 占全年百分比/% | 2.1 | 2.3 | 3.7 | 7.9 | 14.4 | 18.4 | 16.0 | 12.8 | 8.6 | 7.8 | 4.0 | 2.0 |
| 降水倾向率/(mm/10a) | 1.19* | -0.22 | 2.78* | -5.01* | -3.23 | 3.91 | 1.43 | -3.35 | -3.41 | -3.15 | -2.67 | -0.09 |
注:*表示达到95%的信度水平 |
Fig. 8 Location of precipitation barycenter and its movement trajectory from 1960 to 2016图8 1960-2016年降水重心位置及移动轨迹 |
Fig. 9 Variation in longitude coordinate and latitude coordinate of precipitation barycenter from 1960 to 2016图9 1960-2016年降水重心经纬度坐标变化 |
The authors have declared that no competing interests exist.
| [1] |
[
|
| [2] |
[
|
| [3] |
[
|
| [4] |
[
|
| [5] |
[
|
| [6] |
[
|
| [7] |
[
|
| [8] |
[
|
| [9] |
[
|
| [10] |
[
|
| [11] |
[
|
| [12] |
[
|
| [13] |
[
|
| [14] |
[
|
| [15] |
[
|
| [16] |
[
|
| [17] |
国家气象信息中心.中国地面气候资料日值数据集(V3.0) [DB/OL]..
[ National Meteorological Information Center. Dataset of Daily Climate Data from Chinese Surface Stations (V3.0)[DB/OL]. ]
|
| [18] |
[
|
| [19] |
|
| [20] |
[
|
| [21] |
|
| [22] |
[
|
| [23] |
[
|
| [24] |
[
|
| [25] |
[
|
| [26] |
[
|
| [27] |
[
|
| [28] |
[
|
| [29] |
[
|
| [30] |
[
|
| [31] |
|
| [32] |
|
| [33] |
|
| [34] |
|
| [35] |
[
|
/
| 〈 |
|
〉 |