
Journal of Geo-information Science >
The Random Forest Classification of Wetland from GF-2 Imagery Based on the Optimized Feature Space
Received date: 2018-03-01
Request revised date: 2018-07-25
Online published: 2018-10-17
Supported by
National Natural Science Foundation of China, No.41472243.
Copyright
Due to seasonal vegetation dynamics and hydrological fluctuations, classification of wetland from remote sensing images is often more difficult. In this paper, a pretreated GF-2 image in the east of Tongyu Country, Baicheng City, Jilin Province, was analyzed by Random Forest with optimized feature space. The key method is divided into two steps. The first step is to perform multi-scale segmentation and extraction of object features in the remote sensing image of the study area. For a situation that some scholars obtain the best segmentation scale subjected to subjective factors, this paper obtains the best segmentation scale by improving the global optimal segmentation method, The second step is based on optimal segmentation, to optimize the feature space of the random forest classification algorithm on the basis of the importance of features to obtain the best random forest classification results, and then the classification results of the K-NN, SVM, and CART algorithms with the same data, the same segmentation scale, the same training sample and the same feature space, and the RF algorithm with unoptimized feature space are compared. The results show that the total classification accuracy and Kappa coefficient of the RF algorithm based on optimized feature space are 93.038% and 0.9177, respectively, while the total accuracy of the classification results of K-NN, SVM and CART are 83.357% and 78.068%, respectively, 77.136%, the total accuracy of the classification results of RF algorithm with unoptimized feature space is 90.937%. Compared with K-NN, SVM and CART classification algorithms, the RF algorithm has better classification performance in GF-2 wetland image data. At the same time, the accuracy of the RF algorithm with the optimized feature space has been improved, and it can play a very important role in wetland resource management.
ZHAN Guoqi , YANG Guodong , WANG Fengyan , XIN Xiuwen , GUO Ce , ZHAO Qiang . The Random Forest Classification of Wetland from GF-2 Imagery Based on the Optimized Feature Space[J]. Journal of Geo-information Science, 2018 , 20(10) : 1520 -1528 . DOI: 10.12082/dqxxkx.2018.180119
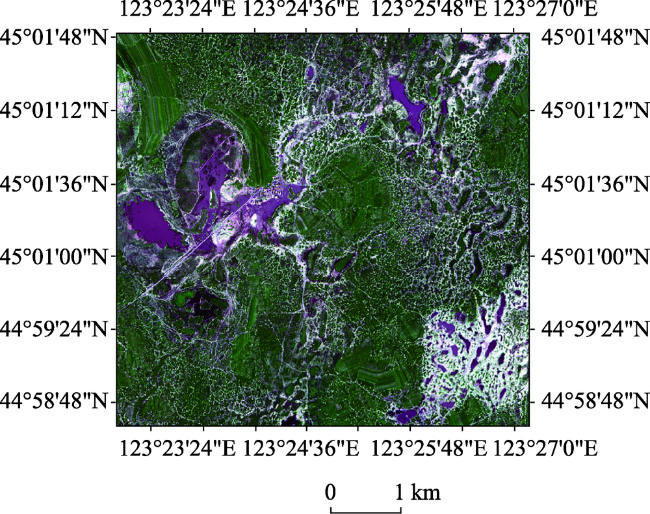
Fig.1 The geographical location map of the study area图1 研究区地理位置图 |
Tab.1 Classification system of wetland表1 湿地遥感分类体系 |
| 类型名称 | 类型含义 | |
|---|---|---|
| 自然湿地 | 盐碱泡 | 盐碱化区域、含盐分较高的湖泊坑塘 |
| 杂草盐生沼泽 | 位于盐碱泡周边、盐碱地上,耐盐植被覆盖 | |
| 香蒲沼泽 | 距离水泡附近,以香蒲植被为主的植被沼泽,呈现暗绿色 | |
| 草丛沼泽 | 分布在香蒲沼泽与耕地之间,覆盖草丛植被 | |
| 非湿地 | 盐碱裸地 | 表层盐碱聚集,基本没有植被的土地 |
| 旱地 | 无灌溉设施,依靠天然水源的耕地 | |
| 树林 | 包含旱地周边的人工树林和天然树林 | |
| 房屋 | 包括达到2×2个像元的建筑 | |
| 道路 | 主要为农村之间修筑的水泥道路 | |
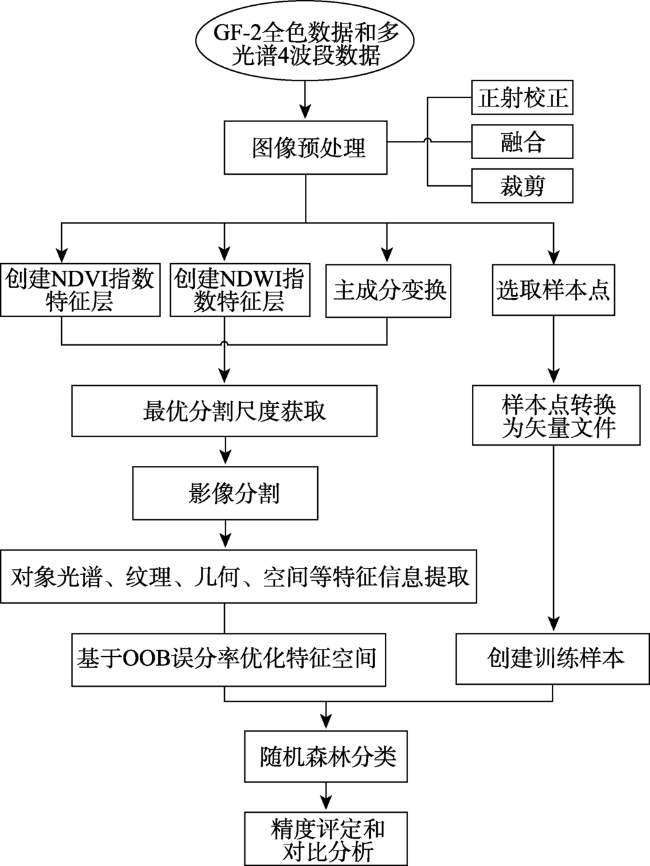
Fig. 2 The technology roadmap of the study图2 技术路线图 |
Tab. 2 The statistical properties of principal component transformation in the study area表2 研究区主成分变换后的统计属性 |
| 主成分PC | 特征值 | 累积特征值百分比/% | 特征值百分比/% |
|---|---|---|---|
| 1 | 40 101.956 3 | 91.27 | 91.27 |
| 2 | 3 572.032 7 | 99.40 | 8.13 |
| 3 | 222.299 9 | 99.91 | 0.51 |
| 4 | 40.822 0 | 100.00 | 0.09 |
Tab. 3 The initial feature space表3 初始特征空间 |
| 特征名称 | |
|---|---|
| 光谱特征 | Mean B、Mean G、Mean R、Mean NIR、Standard deviation B、Standard deviation G、Standard deviation R、Standard deviation NIR、Brightness、AVE(B、R、G 3波段均值) 、Ratio to scene R、Ratio to scene G、Ratio to scene B、Ratio to scene NIR |
| 几何特征 | Area、Length/Width、Width、Asymmetry、Border index、Compactness、Density、Rectangular Fit、Shape index、Number of edges(polygon) 、Stddev of length of edges(polygon) |
| 纹理特征 | GLCM Homogeneity PC2(all dir.) 、GLCM Contrast PC2(all dir.) 、GLCM Dissimilarity PC2(all dir.) 、GLCM Entropy PC2(all dir.) 、GLCM Ang.2nd moment PC2(all dir.) 、GLCM Mean PC2(all dir.) 、GLCM StdDev PC2(all dir.) 、GLDV Entropy PC2(all dir.) 、GLDV Ang.2nd moment PC2(all dir.) 、GLDV Mean PC2(all dir.) 、GLDV Contrast PC2(all dir.) |
| 自定义特征 | BRITHTEN DIFFER(相邻对象亮度差)、SR、SRWC、percent(B)、percent(G)、percent(R)、Max.diff、Mean NDVI、Mean NDWI、Mean PC1、Mean PC2、Standard deviation NDVI、Standard deviation NDWI、Standard deviation PC1、Standard deviation PC2 |
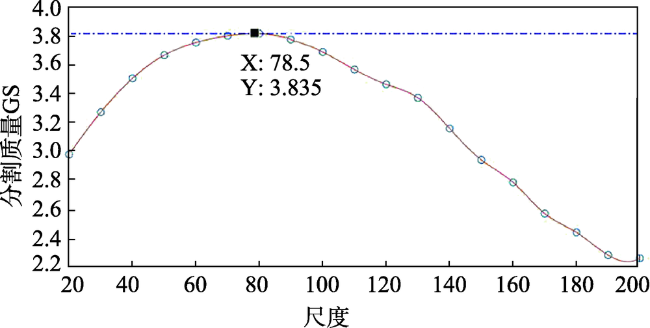
Fig. 3 The relationship between quality of the divide and scale图3 分割质量与尺度的关系曲线 |
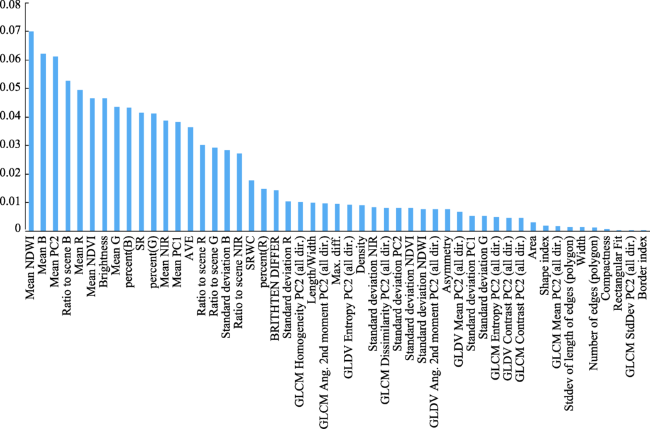
Fig. 4 The importance of features图4 特征重要性 |
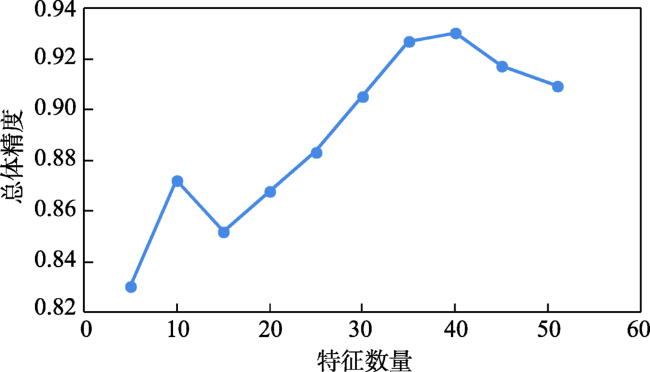
Fig. 5 The relationship between the overall accuracy and the number of features图5 总体精度与特征数量关系折线图 |
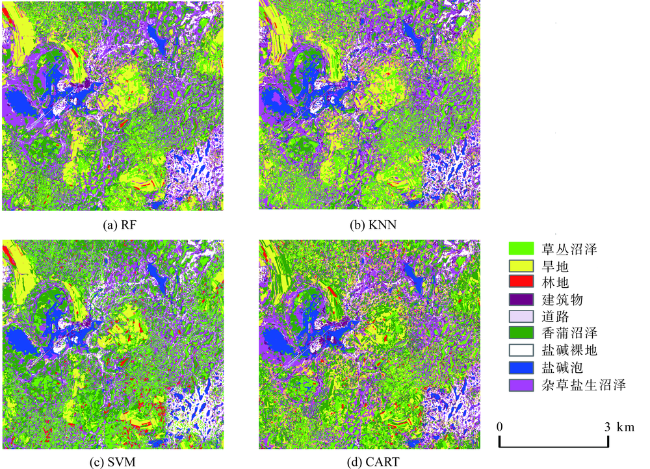
Tab. 4 Comparison of the overall accuracies of the four classifiers表4 4种分类算法总体精度对比 |
| 分类器 | RF | KNN | SVM | CART |
|---|---|---|---|---|
| 总体精度/% | 93.038 | 83.357 | 78.068 | 77.136 |
| Kappa指数 | 0.9177 | 0.8029 | 0.7406 | 0.7290 |
Fig. 6 The classification results of the four models图6 4种算法分类结果 |
Tab. 5 The User's and Producer's accuracy of the RF classification表5 随机森林分类的用户精度和制图精度(%) |
| 类别 | 错分误差 | 漏分误差 | 制图精度 | 用户精度 |
|---|---|---|---|---|
| 盐碱泡 | 0 | 0 | 100 | 100 |
| 香蒲沼泽 | 6.02 | 26.6 | 73.4 | 93.98 |
| 杂草盐生沼泽 | 13.2 | 12.79 | 87.21 | 86.8 |
| 草丛沼泽 | 24.19 | 3.3 | 96.7 | 75.81 |
| 盐碱裸地 | 0 | 2.01 | 97.99 | 100 |
| 林地 | 0 | 0 | 100 | 100 |
| 旱地 | 2.63 | 1.19 | 98.81 | 97.37 |
| 建筑物 | 0 | 0 | 100 | 100 |
| 道路 | 8.11 | 0 | 100 | 91.87 |
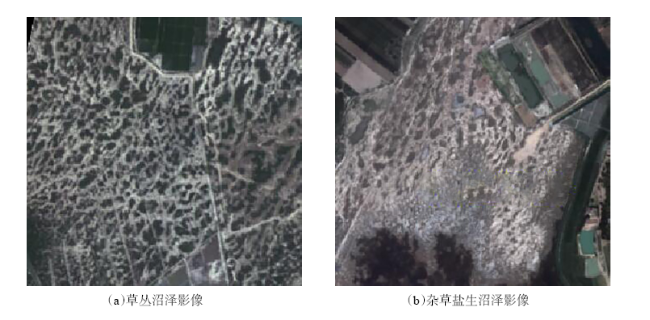
Fig. 7 Brushwood marsh and weed salt marshes图7 草丛沼泽和杂草盐生沼泽 |
The authors have declared that no competing interests exist.
| [1] |
|
| [2] |
|
| [3] |
|
| [4] |
|
| [5] |
|
| [6] |
|
| [7] |
|
| [8] |
|
| [9] |
|
| [10] |
|
| [11] |
|
| [12] |
|
| [13] |
|
| [14] |
[
|
| [15] |
|
| [16] |
[
|
| [17] |
[
|
| [18] |
[
|
| [19] |
[
|
| [20] |
|
| [21] |
|
| [22] |
[
|
| [23] |
[
|
| [24] |
|
| [25] |
[
|
| [26] |
[
|
| [27] |
[
|
| [28] |
|
| [29] |
高分辨率对地观测系统吉林数据与应用中心. GF-2影像数据是2016年7月29日采集[DB/DK].[2016-7-29].
[ High Resolution Earth Observation System Jilin Data and Application Center. GF-2 image data was collected on July 29, 2016.[DB/DK]. [2016-7-29]. ]
|
| [30] |
|
| [31] |
|
| [32] |
|
/
| 〈 |
|
〉 |