
Journal of Geo-information Science >
Characteristics of Land Surface Temperature Disturbance and Its Relationship to Built-up Land Expansion
Received date: 2018-04-16
Request revised date: 2018-07-31
Online published: 2018-10-17
Supported by
Fujian Prov-ince Youth Social Science Project, No.FJ2016C033
Fujian Province Young and Middle-Aged Teacher Education Research Project, No.JT180021.
Copyright
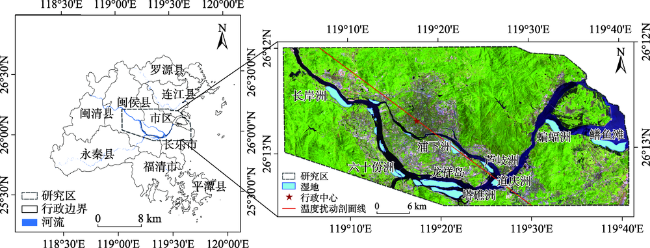
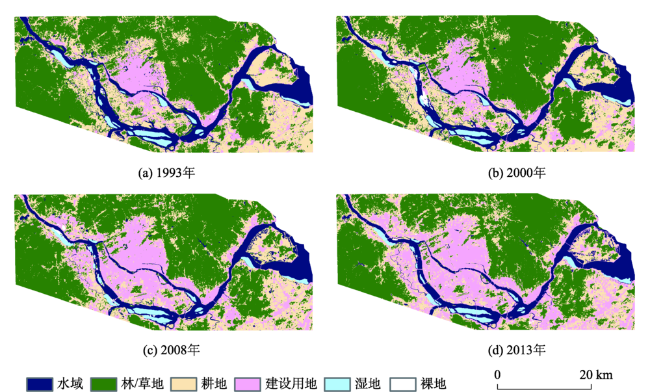
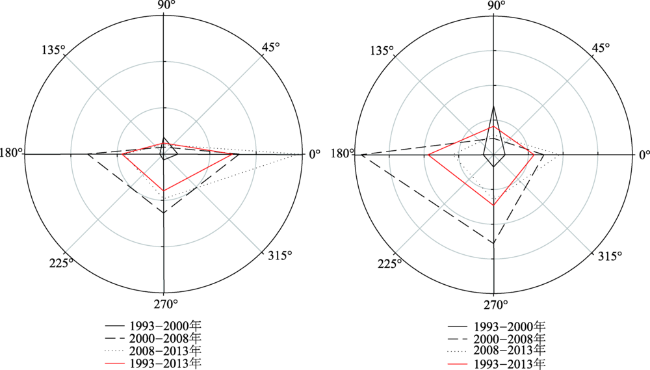
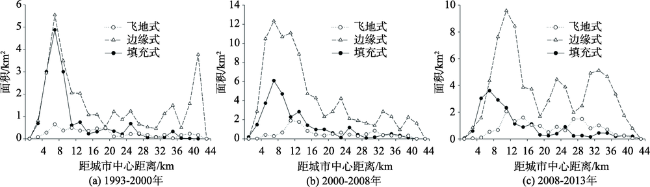
Estuarine region is one of the most densely populated and prosperous area around the world, and it is also an eco-environmental vulnerable area which is more fragile to human activities. The acceleration of urbanization have inevitably resulted in a series of ecological and environmental problems on estuarine region, the thermal environment is a severe part of them. Higher temperatures and extreme heat not only hamper air quality but also increase energy consumption for cooling, threatening the health of urban residents. Based on the multi-source remote sensing images, characteristics of land surface temperature under the urbanization in Minjiang River estuary area were analyzed by using remote sensing techniques and statistical methods. With the help of Moran's I index, spatial clustering characteristic and scale effect of LST were examined. Further, the correlations between LST and different landscapes were found in quantitative analysis. The results showed that: (1) Built-up land area increased sharply from 1993 to 2013, showing a slow-rapid-steady and increasing process. A large number of large-scale edge-expansion was the primary growth type, meanwhile urban sprawl was mainly in east, west and south directions. (2) The area of sub-high and high temperature zone increased markedly, while the sub-low and middle temperature zone reduced; and there was no significant change in low temperature zone. Moreover, the spatial distribution of the high temperature region was consistent with built-up land expansion. (3) The LST exhibited an obvious disturbance characteristic; the temperature near city center presented dramatic changes and the temperature fluctuation in suburb was relatively smoother than Fuzhou city proper. On the other hand, the LST had a significant spatial clustering characteristic, and the spatial pattern of LST had a scale effect. (4) The dominance of built-up land significantly strengthened surface temperature, while increasing the dominance of vegetation and water could cool temperature. Cropland displayed no sign of cooling effect, the LST tended to be stable as the percentage of cropland increased. The results of the study can provide a useful reference for improving urban thermal environment and developing sustainable cities in estuarine regions.
ZHENG Huizhen , CHEN Yanhong , DING Wei , PAN Wenbin , CAI Yuanbin . Characteristics of Land Surface Temperature Disturbance and Its Relationship to Built-up Land Expansion[J]. Journal of Geo-information Science, 2018 , 20(10) : 1529 -1540 . DOI: 10.12082/dqxxkx.2018.180186
Fig. 1 Geographical location of the study area图1 研究区地理位置图 |
Tab. 1 Remote sensing data used in the study表1 遥感影像参数表 |
| 获取日期 | 获取时间(北京时间) | 卫星 | 多光谱波段分辨率/m | 热红外波段分辨率/m |
|---|---|---|---|---|
| 1993-06-26 | 9:55:00 | Landsat 5 | 30 | 120(30) |
| 2000-06-29 | 10:09:14 | Landsat 5 | 30 | 120(30) |
| 2008-07-05 | 10:19:41 | Landsat 5 | 30 | 120(30) |
| 2013-08-04 | 10:32:31 | Landsat 8 | 30 | 100(30) |
注:(30)热红外波段的空间分辨率与多光谱波段不同,将其重采样为30 m空间分辨率 |
Fig. 2 Land use/cover maps of the study area图2 土地利用/覆盖图 |
Tab. 2 Area statistics of different land use/cover types from 1993 to 2013表2 1993-2013年不同土地利用/覆盖类型面积统计 |
| 土地利用/覆盖类型 | 面积/km2 | 总变化量/km2 | ||||
|---|---|---|---|---|---|---|
| 1993年 | 2000年 | 2008年 | 2013年 | 1993-2013年 | ||
| 水域 | 196.29 | 178.82 | 168.27 | 166.90 | -29.39 | |
| 林/草地 | 803.06 | 809.58 | 749.37 | 700.08 | -102.98 | |
| 耕地 | 389.79 | 378.39 | 344.30 | 322.54 | -67.25 | |
| 建设用地 | 175.14 | 193.68 | 306.50 | 380.34 | 205.20 | |
| 湿地 | 37.00 | 35.30 | 31.91 | 30.36 | -6.64 | |
| 裸地 | 3.10 | 8.61 | 4.03 | 4.16 | 1.06 | |
Tab. 3 Variation, annual variance rate, annual increase and annual growth rate of built-up land表3 不同时期建设用地变化量、年变化率、扩张速度和年均增长率 |
| 1993-2000年 | 2000-2008年 | 2008-2013年 | 1993-2013年 | |
|---|---|---|---|---|
| 变化量/km2 | 18.54 | 112.82 | 73.84 | 205.20 |
| 年变化率AVR/% | 1.51 | 7.28 | 4.82 | 5.86 |
| 扩张速度AI/(km2/a) | 2.65 | 14.10 | 14.77 | 10.26 |
| 年均增长率AGR/% | 1.45 | 5.91 | 4.41 | 3.95 |
Fig. 3 Annual increase and annual growth rate of built-up land in different directions图3 各方位建设用地扩张强度和年均增长率 |
Tab. 4 The number patches and areas of three growth types表4 3种扩张模式斑块数量比例和面积比例 |
| 扩张模式 | 1993-2000年 | 2000-2008年 | 2008-2013年 | |||||
|---|---|---|---|---|---|---|---|---|
| 数量比例/% | 面积比例/% | 数量比例/% | 面积比例/% | 数量比例/% | 面积比例/% | |||
| 边缘式 | 51.12 | 61.01 | 40.14 | 69.75 | 37.20 | 68.41 | ||
| 填充式 | 27.86 | 29.51 | 30.76 | 21.78 | 24.72 | 17.20 | ||
| 飞地式 | 21.02 | 9.48 | 29.10 | 8.47 | 38.08 | 14.39 | ||
Fig. 4 Area changes of three growth types based on buffer zones图4 基于缓冲区的3种扩张模式面积变化 |
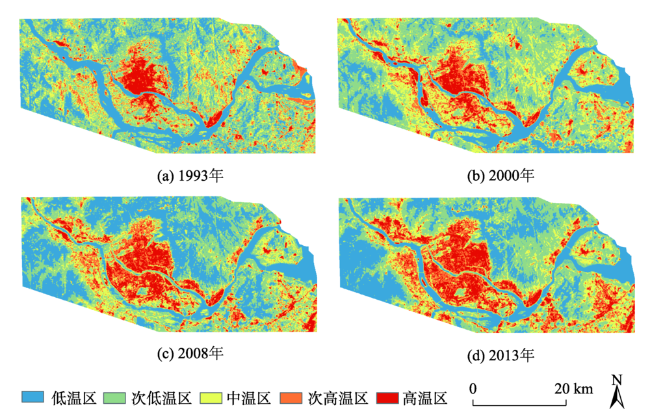
Fig. 5 The spatial distribution maps of land surface temperature图5 地表温度空间分布图 |
Tab.5 Transition matrixes of different temperature zones from 1993 to 2013表5 1993-2013年不同温区转移矩阵(km2) |
| 低温区 | 次低温区 | 中温区 | 次高温区 | 高温区 | 1993年合计 | |
|---|---|---|---|---|---|---|
| 低温区 | 285.26 | 86.86 | 37.55 | 24.55 | 12.50 | 446.72 |
| 次低温区 | 135.57 | 256.56 | 132.27 | 71.86 | 30.27 | 626.53 |
| 中温区 | 29.66 | 116.75 | 71.81 | 58.61 | 27.05 | 303.88 |
| 次高温区 | 9.30 | 25.43 | 26.57 | 54.84 | 42.36 | 158.50 |
| 高温区 | 0.59 | 0.44 | 1.35 | 19.84 | 46.55 | 68.77 |
| 2013年合计 | 460.38 | 486.04 | 269.55 | 229.70 | 158.73 | 1604.40 |
| 面积净变化 | 13.66 | -140.49 | -34.33 | 71.20 | 89.96 | 0.00 |
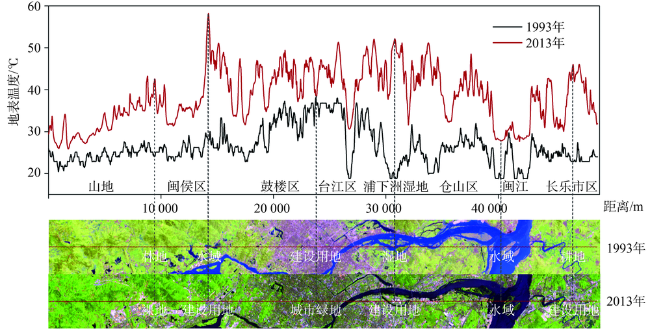
Fig. 6 Profile analysis of surface temperature distribution change图6 地表温度扰动变化剖面分析 |
Tab. 6 Changes of LST’s statistical variables at five scales in 2013表6 2013年地表温度空间统计变量随尺度变化 |
| 300 m×300 m | 600 m×600 m | 900 m×900 m | 1200 m×1200 m | 1500 m×1500 m | |
|---|---|---|---|---|---|
| Moran's I | 0.8967 | 0.8516 | 0.8215 | 0.7962 | 0.7702 |
| Z-Score | 170.0791 | 80.9949 | 52.2108 | 38.1601 | 29.5304 |
Fig. 7 Morans'I scatter diagram of LST(600 m×600 m)图7 地表温度Moran's I散点图(600 m×600 m) |
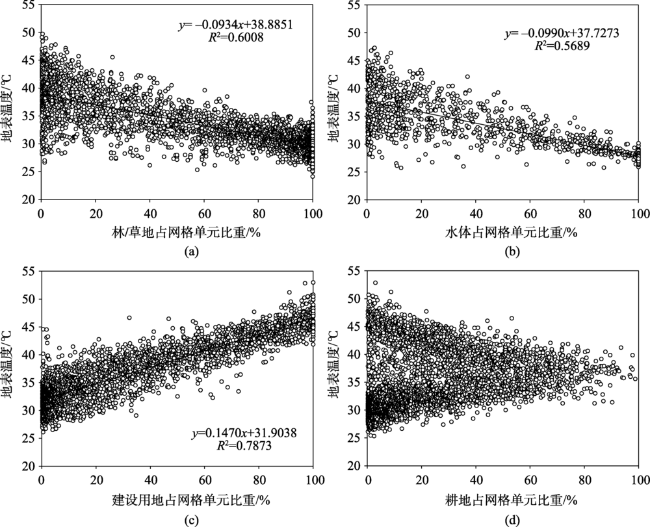
Fig.8 The regression analysis between landscape types and LST at 600m scale in 2013图8 2013年600 m幅度下景观类型与地表温度回归分析 |
The authors have declared that no competing interests exist.
| [1] |
[
|
| [2] |
[
|
| [3] |
[
|
| [4] |
[
|
| [5] |
[
|
| [6] |
|
| [7] |
|
| [8] |
|
| [9] |
|
| [10] |
|
| [11] |
[
|
| [12] |
[
|
| [13] |
[
|
| [14] |
国家气象信息中心.中国地面国际交换站气候资料日值数据集[EB/OL]. .
[ National Meteorological Information Center. Dataset of daily climate data from Chinese surface stations for global exchange. ]
|
| [15] |
福建省地方志编纂委员会.福建省志[EB/OL]. .
[ Compilation Committee of Fujian Province Chorography. Fujian Province Chorography [EB/OL]. ]
|
| [16] |
[
|
| [17] |
福州市统计局 .福州统计年鉴2017 [EB/OL]. .
[ Fuzhou City Bureau of Statistics. Fuzhou Statistical Yearbook 2017 [EB/OL]. . ]
|
| [18] |
[
|
| [19] |
|
| [20] |
[
|
| [21] |
[
|
| [22] |
[
|
| [23] |
[
|
| [24] |
|
| [25] |
|
| [26] |
|
| [27] |
[
|
| [28] |
[
|
| [29] |
[
|
| [30] |
|
| [31] |
[
|
| [32] |
[
|
| [33] |
[
|
| [34] |
[
|
| [35] |
[
|
| [36] |
[
|
| [37] |
|
/
| 〈 |
|
〉 |
