
Journal of Geo-information Science >
Spatio-temporal Distribution of High Temperature Heat Wave in Nanjing
Received date: 2018-05-07
Request revised date: 2018-08-22
Online published: 2018-11-20
Supported by
National Natural Science Foundation of China, No.41571418、41401471
Project of "Blue Project" in Jiangsu Province.
Copyright
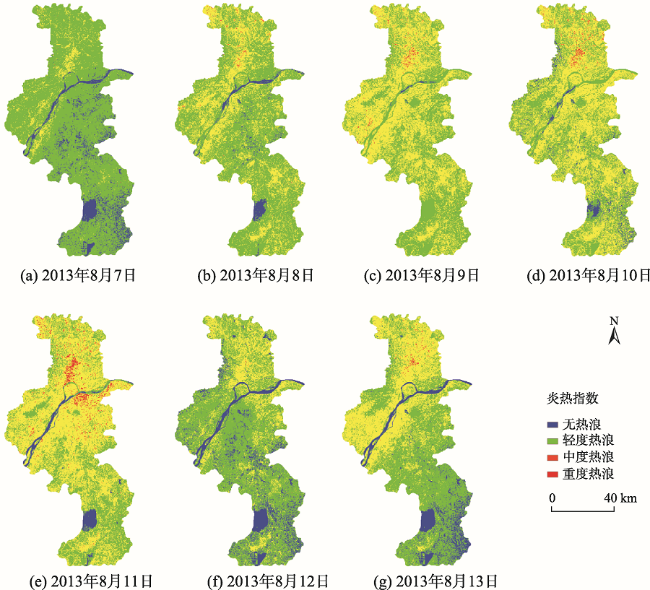
Under the background of global warming, the urban heat wave in summer has become one of the most serious meteorological disasters, which has brought tremendous impact on the health and economic development of urban residents. Taking the heat wave disaster event occurred in Nanjing from August 7 to 13, 2013 as an example, the near-surface air temperatures were estimated based on the downscaled MODIS land surface temperature using the Landsat 8 OLI image data, MODIS data products, and field-measurement meteorological data. Combined with the spatial interpolation data of the relative humidity, the hot index and the high temperature heat-wave index at the resolution of 100m were calculated, and then their spatial and temporal distribution characteristics were analyzed. The results show that during the evolution of the high temperature heat wave in Nanjing, the hot index increased firstly and then decreased with time. The hot index was highest on Aug. 11th with an average of 86.99, and it fell off to the lowest value of 85.05 on Aug. 12th; the heat wave intensity mainly concentrates on mild and moderate degrees, and its range also shows a tendency of expanding firstly and then decreasing with time. In terms of spatial distribution, the hot index is higher in northern region and central urban areas and mainly display as a moderate heat wave, while the heat index in the southern suburbs and central suburbs is lower and the heat wave is mild, and the mountain and the water areas have the lowest heat index.
ZHOU Yang , ZHU Shanyou , HUA Junwei , LIU Yi , XIANG Jiamin , DING Wen . Spatio-temporal Distribution of High Temperature Heat Wave in Nanjing[J]. Journal of Geo-information Science, 2018 , 20(11) : 1613 -1621 . DOI: 10.12082/dqxxkx.2018.180222
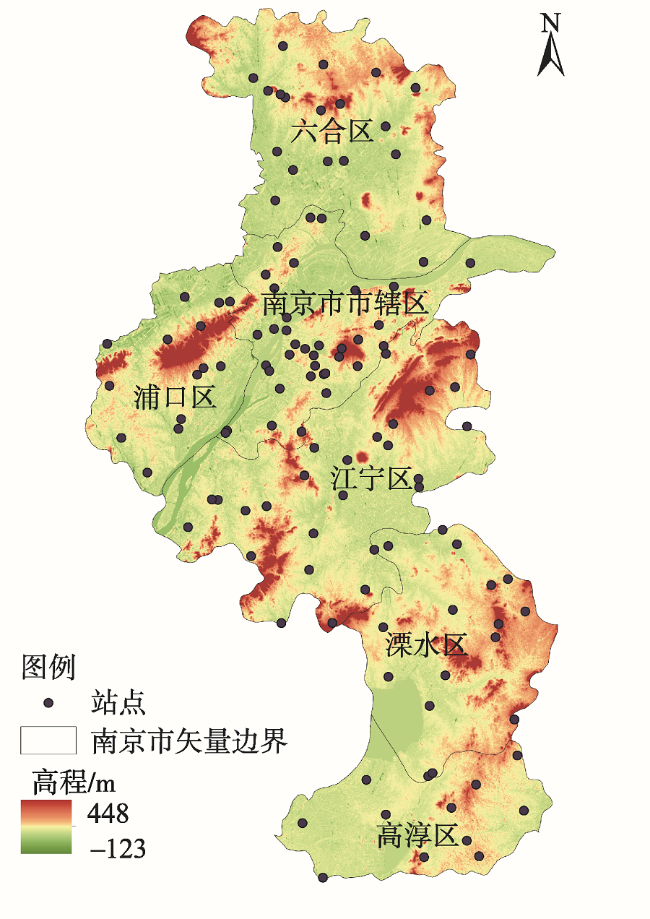
Fig. 1 Elevation distribution and locations of observation sites in Nanjing图1 南京高程及观测站点分布 |
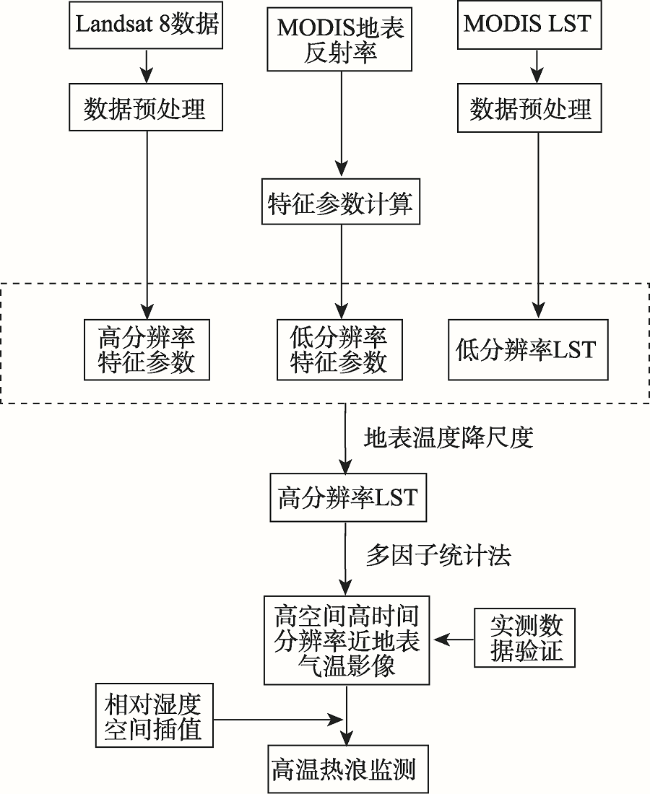
Fig. 2 Schematic flow chart for the produce in this study图2 研究技术路线图 |
Tab. 1 The stepwise regression models for downscaling of surface temperature表1 地表温度降尺度逐步回归模型 |
| 模型 | 因子 | 相关系数R | 决定系数R2 | 随机误差估算值 |
|---|---|---|---|---|
| a | NDBI | 0.823 | 0.677 | 1.24 |
| b | NDBI, MSAVI | 0.839 | 0.703 | 1.19 |
| c | NDBI, MSAVI, BI | 0.843 | 0.711 | 1.16 |
| d | NDBI, MSAVI, BI, NLI | 0.844 | 0.713 | 1.17 |
| e | NDBI, BI, NLI | 0.844 | 0.713 | 1.17 |
Tab. 2 Grading standards of heat waves表2 热浪分级标准 |
| 无热浪 | 轻度热浪 | 中度热浪 | 重度热浪 | |
|---|---|---|---|---|
| 热浪指数 |
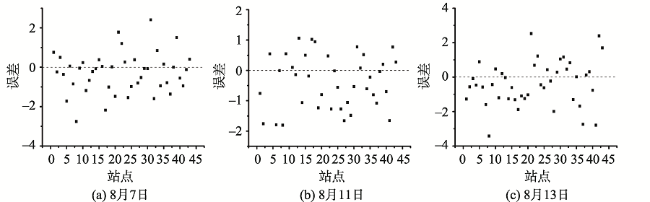
Fig. 3 Error distribution of the air temperature retrievals图3 气温估算误差散点分布 |
Tab. 3 Error statistics of the spatial interpolation of the relative humidity表3 相对湿度插值结果误差统计(%) |
| 8月7日 | 8月8日 | 8月9日 | 8月10日 | 8月11日 | 8月12日 | 8月13日 | |
|---|---|---|---|---|---|---|---|
| ME | 1.90 | 0.89 | 1.37 | -0.30 | -0.35 | -0.40 | 0.95 |
| MAE | 4.21 | 4.56 | 3.86 | 4.31 | 3.93 | 3.32 | 4.71 |
| RMSE | 5.03 | 5.51 | 4.64 | 5.35 | 4.61 | 4.25 | 5.65 |
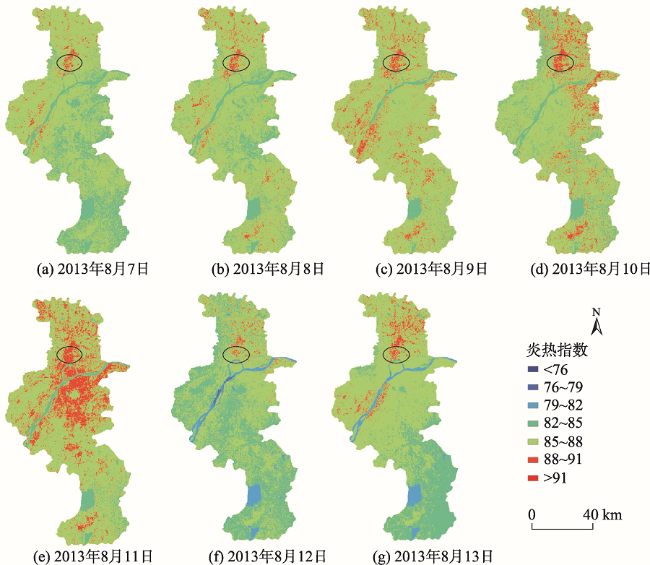
Fig. 4 The distributions of hot index in Nanjing from August 7 to 13图4 南京市8月7日至8月13日炎热指数分布图 |
Fig. 5 Division distributions of high temperature heat-wave in Nanjing from August 7 to 13图5 南京市8月7日至8月13日高温热浪分区 |
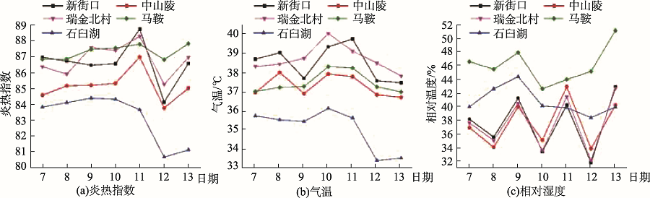
Fig. 6 Time series of the hot index, temperature, and relative humidity in the selected typical areas图6 典型区域炎热指数、气温和相对湿度时间变化图 |
The authors have declared that no competing interests exist.
| [1] |
[
|
| [2] |
|
| [3] |
[
|
| [4] |
|
| [5] |
中国气象局.高温科普五:什么是高温热浪[R].北京:中国气象报社,2011.
[ China Meteorological Administration.High temperature science five: What is high temperature heat wave[R]. Beijing: China Meteorological News, 2011. ]
|
| [6] |
[
|
| [7] |
[
|
| [8] |
[
|
| [9] |
[
|
| [10] |
|
| [11] |
[
|
| [12] |
[
|
| [13] |
[
|
| [14] |
[
|
| [15] |
|
| [16] |
|
| [17] |
|
| [18] |
[
|
| [19] |
[
|
| [20] |
[
|
| [21] |
[
|
| [22] |
[
|
| [23] |
[
|
| [24] |
[
|
| [25] |
[
|
| [26] |
[
|
| [27] |
[
|
| [28] |
[
|
/
| 〈 |
|
〉 |