
Journal of Geo-information Science >
Spatial Difference of the Relationship Between Remote Sensing Index and Land Surface Temperature under Different Underlying Surfaces
Received date: 2018-06-27
Request revised date: 2018-09-17
Online published: 2018-11-20
Supported by
International University Cooperation on Land Protection in European-Asiatic Countries IUCLAND, No.586037-EPP-1-2017-1-HU-EPPKA2-CBHE-JP, No.551857-EPP-1-20L5-1-DE-EPPKA2-CBHE-JP
Special Project under Ministry of Science and Technology, No.247608
Special Project of International Cooperation of Fujian Province, No.2018I0005.
Copyright
Use of remote sensing indices to explain the changes and distribution in urban surface temperature has become a hot topic in the study of urban thermal environment. However, there are obvious differences in interpretation of surface temperature using the same remote sensing index in different studies. The reason for this is that when we use remote sensing index to explain the land surface temperature changes, the spatial differences caused by the interaction of different underlying surfaces are ignored. In this paper, we select Putian metropolitan area as study area to explain the spatial difference of LST using the 2016 Landsat 8 image as the data source. Three remote sensing indices were used for the explanation: normalized difference vegetation index (NDVI), normalized difference building index (NDBI), and modified normalized difference water index (MNDWI). Then we use GF2 image to extract land cover types during the same period. the LST and its relationship with remote sensing indices was anayzed for different underlying surfaces. Then we use the OLS and GWR methods to construct the remote sensing index-LST model, and analyzed the spatial autocorrelation for model residuals. The results show: (1)The underlying surface has a significant impact on LST. Due to the continuity of the geospatial space, LST appear abnormal changes between different underlying surfaces. For example, the high temperature area is mainly concentrated on the artificial surface, but LST drops near water or forest lands as compared to its values on pure artificial surface; (2) NDVI and MNDWI have different positive and negative correlations with LST in water area and non-water area due to their own value range characteristics, while NDBI shows a stable positive correlation when quantifying its relationship with LST. (3)Compared with the OLS model, GWR can better explain the relationship between the remote sensing index and LST by fully considering the spatial difference. Through the spatial autocorrelation analysis for model residuals, there is an aggregation of model residuals under OLS, while the model residual under GWR shows a random distribution. Compared to GWR, OLS has stronger spatial limitations in describing he relationship between remote sensing index and LST.
SHUAI Chen , SHA Jinming , LIN Jinhuang , JI Jianwan , ZHOU Zhenglong , GAO Shang . Spatial Difference of the Relationship Between Remote Sensing Index and Land Surface Temperature under Different Underlying Surfaces[J]. Journal of Geo-information Science, 2018 , 20(11) : 1657 -1666 . DOI: 10.12082/dqxxkx. 2018.180303
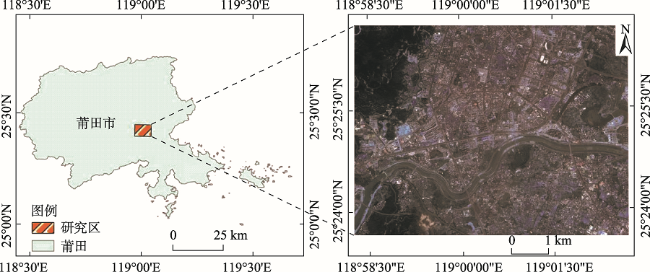
Fig. 1 Study area-metropolitan area in Putian图1 研究区域-莆田市都市区 |
Tab. 1 Atmospheric average temperature Ta estimation equation under several standard atmospheric models表1 几种标准大气模型下的大气平均作用温度Ta估计方程 |
| 标准大气模型 | 大气平均作用温度Ta估计方程 |
|---|---|
| 美国1976大气 | Ta=25.9396+0.88045×To |
| 热带大气 | Ta=17.9769+0.91715×To |
| 中纬度夏季大气 中纬度冬季大气 | Ta=16.0110+0.92621×To Ta=19.2704+0.91118×To |
Tab. 5 Comparison of model statistics between OLS and GWR表5 基于遥感指数的地温OLS模型与GWR模型统计量比较 |
| Model | 指数 | AIC | R2 | Adjust R2 | RSS | 回归残差Moran's I | Z | P | 类型 |
|---|---|---|---|---|---|---|---|---|---|
| OLS | NDVI | 3620.75 | 0.32 | 0.31 | 4745.81 | 0.43 | 24.86 | 0 | Clustered |
| NDBI | 3207.18 | 0.60 | 0.59 | 2788.98 | 0.33 | 18.86 | 0 | Clustered | |
| MNDWI | 3698.29 | 0.25 | 0.24 | 5243.22 | 0.46 | 26.59 | 0 | Clustered | |
| GWR | NDVI | 2912.83 | 0.83 | 0.77 | 1180.35 | -0.002 | -0.03 | 0.97 | Random |
| NDBI | 2726.99 | 0.87 | 0.82 | 917.34 | -0.01 | -0.53 | 0.60 | Random | |
| MNDWI | 2927.23 | 0.83 | 0.76 | 1203.63 | 0.002 | 0.19 | 0.85 | Random |
Fig. 2 Classification results in the study area图2 研究区土地覆盖类型划分结果 |
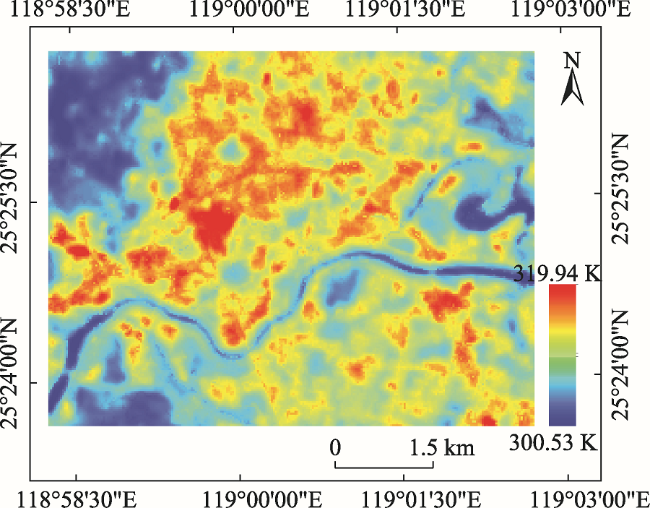
Fig. 3 LST in study area图3 研究区地温反演结果 |
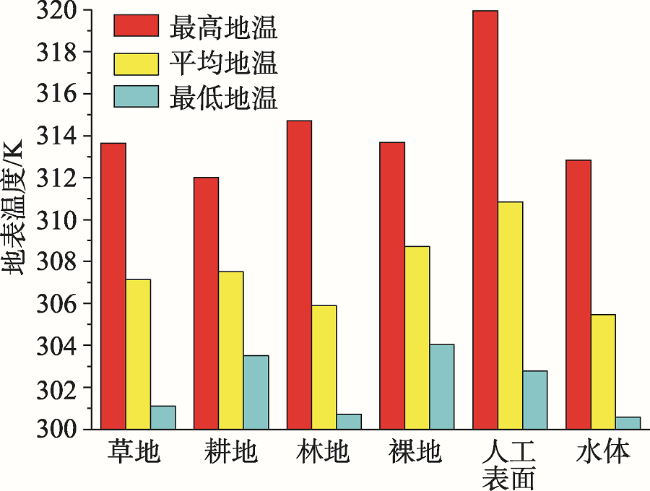
Fig. 4 LST statistics under different land cover types图4 不同土地覆盖类型下地温统计结果 |
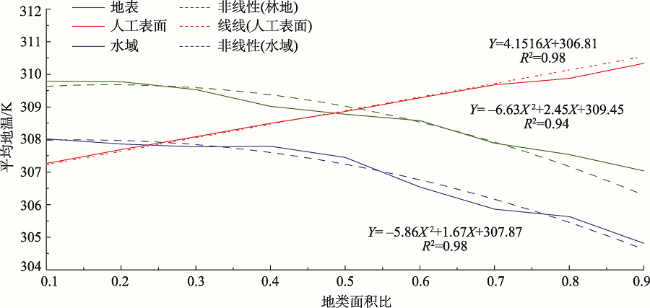
Fig. 5 Influence of different land cover ratio on ground temperature (Single Grid Area: 2500 m2)图5 不同下垫面面积占比对地温的影响(单个格网面积:2500 m2) |
Tab. 2 LST Model based on remote sensing index (OLS)表2 遥感指数-地温的OLS模型 |
| 指数 | OLS | R2 | Adjust R2 | Pearson coefficient |
|---|---|---|---|---|
| NDVI | Y=311.01-6.003X | 0.32 | 0.31 | -0.566 |
| NDBI | Y=311.31+14.54X | 0.60 | 0.59 | 0.775 |
| MNDWI | Y=310.78+6.07X | 0.25 | 0.24 | 0.499 |
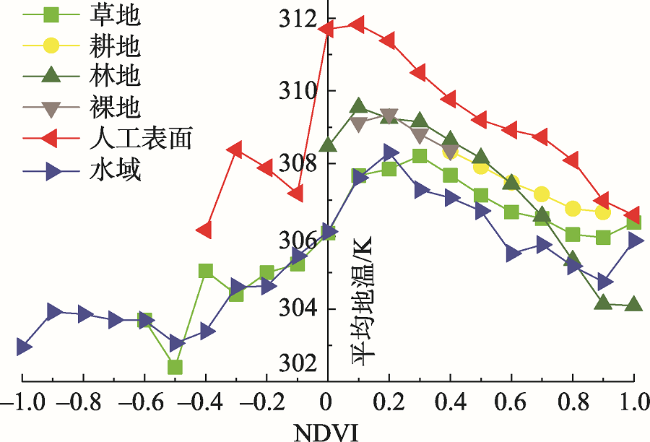
Fig. 6 The relationship between NDVI and LST indiffierent land cover图6 不同土地覆盖类型下的NDVI与LST的关系图 |
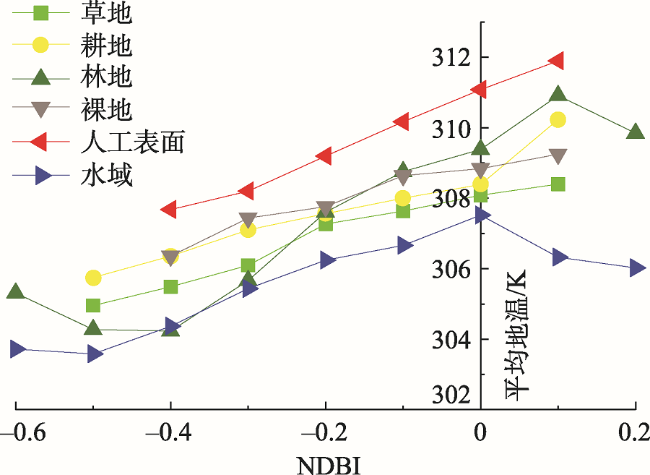
Fig. 7 The relationship between NDBI and LST in diffierent land cover图7 不同土地覆盖类型下的NDBI与LST的关系图 |
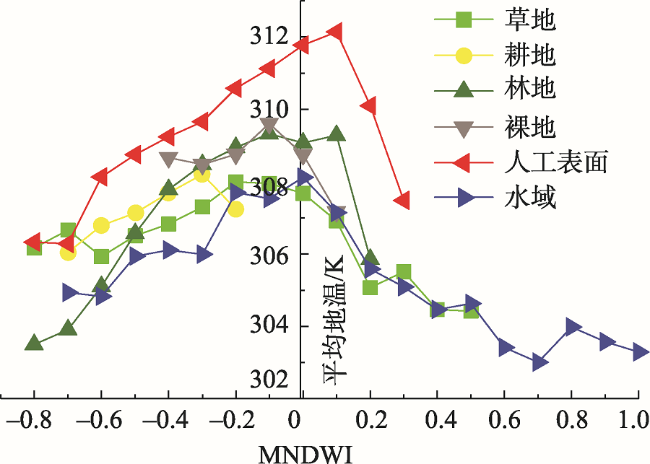
Fig. 8 The relationship between MNDWI and LST in diffierent land cover图8 不同土地覆盖类型下的MNDWI与LST的关系图 |
Tab. 3 Spatial autocorrelation analysis results表3 空间自相关分析结果 |
| LST | NDVI | NDBI | MNDWI | |
|---|---|---|---|---|
| Morans'I | 0.96 | 0.72 | 0.63 | 0.71 |
| Z | 177.03 | 133.06 | 116.86 | 131.65 |
| P | 0 | 0 | 0 | 0 |
| Type | Clustered | Clustered | Clustered | Clustered |
Tab. 4 LST Model based on remote sensing index(GWR)表4 遥感指数-地温的GWR模型 |
| 指数 | 回归系数 | R2 | ||
|---|---|---|---|---|
| 最小值(Min) | 最大值(Max) | 均值(Mean) | ||
| NDVI | -13.07 | 3.49 | -4.70 | 0.83 |
| NDBI | -1.32 | 21.65 | 9.56 | 0.87 |
| MNDWI | -4.53 | 15.08 | 4.87 | 0.83 |
The authors have declared that no competing interests exist.
| [1] |
|
| [2] |
[
|
| [3] |
[
|
| [4] |
|
| [5] |
[
|
| [6] |
[
|
| [7] |
[
|
| [8] |
[
|
| [9] |
|
| [10] |
[
|
| [11] |
[
|
| [12] |
[
|
| [13] |
[
|
| [14] |
[
|
| [15] |
|
| [16] |
|
| [17] |
|
| [18] |
USGS. Landsat 8(L8) operational land imager (OLI) and thermal infrared sensor (TIRS). , 2013.
|
| [19] |
[
|
| [20] |
[
|
| [21] |
[
|
| [22] |
中华人民共和国国家标准(GB/T 21010-2017).土地利用现状分类[S].2017-11-01.
[ China's national standard (GB/T21010-2017). Current Land Use Condition Classification. 2017-11-01
|
| [23] |
|
| [24] |
[
|
| [25] |
|
| [26] |
[
|
| [27] |
|
| [28] |
|
| [29] |
|
| [30] |
|
| [32] |
|
| [33] |
|
/
| 〈 |
|
〉 |
