
Journal of Geo-information Science >
Extraction of Loess Dissected Saddle and Its Terrain Analysis by Using Digital Elevation Models
Received date: 2018-07-31
Online published: 2018-12-20
Supported by
National Natural Science Foundation of China, No.41601411, 41671389;Priority Academic Program Development of Jiangsu Higher Education Institutions.
Copyright
Dissected saddle, as an important terrain control point, is the result of the struggle statue between positive and negative terrains. The width of the dissected saddle ranges from only a few meters to about twenty meters, which represents the critical stage of gully capture. That is, the headward erosion of gullies on both sides of watersheds are going to erode and dissect the boundary of the watershed. Thus, the division of positive terrains and the connection of negative terrains are achieved. The typical dissected saddle is located in the loess landform in the Loess Plateau, also known as the loess dissected saddle. This dissected saddle could act as an important indicator for distinguishing the extent between loess interfluve area and loess gully area during the landform evolution process. In this paper, taking the typical loess landform as an example, and on a basis of DEM data and remote sensing images, the semi-automatic extraction of dissected saddles is conducted. The terrain characteristics of these extracted dissected saddles, i.e., slope, relief, depth of cut, were then calculated based on the DEM data. Moreover, the spatial pattern of the dissected saddle was summarized. The experimental results show that the dissected saddles are distributed at the boundary of the main stream and perpendicular to the widest part of the main channel, indicating an obvious terrain controlling effect. The quantity and distribution of dissected saddles determine the development and the shape of the watershed to some extent. The results of slope, relief, and depth of cut for dissected saddles are all larger than that for the normal saddles. At the same time, the value of the high-hierarchical watershed is greater than the value of the lower-hierarchical watershed, which reflects that the dissected saddle has characteristics of strong erosion and high surface fragmentation. In summary, the dissected saddle is highly eroded by the channel, which could help to demonstrate the development stage of the loess landform. Along with the development of the landform, the dissected saddle could be regarded as a symbol, indicating the development of the loess landform has reached the metaphase of the landform evolution process.
Key words: DEM; dissected saddle points; loess landform; spatial pattern; watershed
XUE Kaikai , XIONG Liyang , ZHU Shijie , TANG Guoan . Extraction of Loess Dissected Saddle and Its Terrain Analysis by Using Digital Elevation Models[J]. Journal of Geo-information Science, 2018 , 20(12) : 1710 -1720 . DOI: 10.12082/dqxxkx.2018.180358
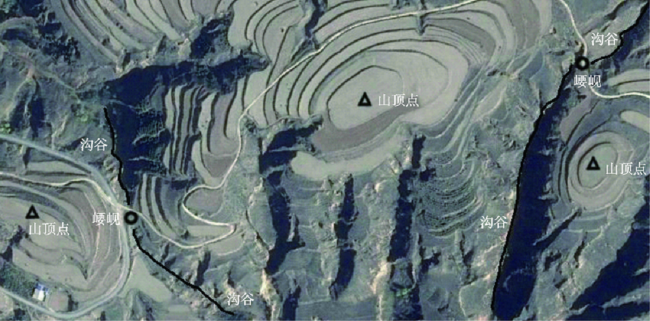
Fig. 1 Dissected saddle image map (Wucheng Village, Pianguan County, Xinzhou City, Shanxi Province)图1 崾岘影像图(山西省忻州市偏关县吴城村) |
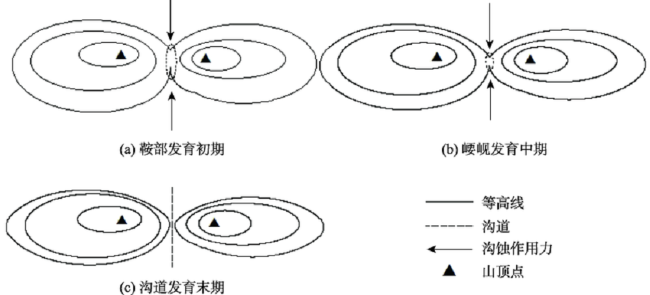
Fig. 2 Dissected saddle erosion stage schematic图2 崾岘侵蚀阶段图 |
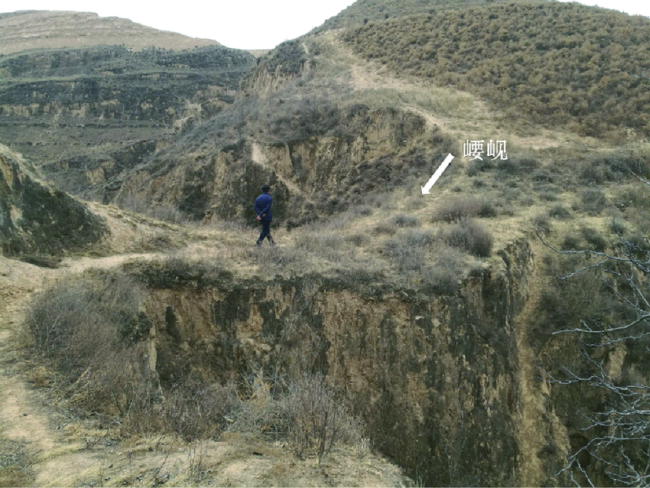
Fig. 3 The dissected saddle in the Loess mountain area of northern Shaanxi (Xuejiajian Village, Zizhou County, Yulin City, Shaanxi Province)图3 陕北一山区崾岘(陕西省榆林市子洲县薛家硷村) |
Tab. 1 Characterization of related terrain factors表1 相关地形因子表征 |
| 地形因子 | 公式 | 意义 |
|---|---|---|
| 坡度 | 为X方向高程变化率,为Y方向高程变化率 | |
| 地形起伏度 | 是分析窗口的最大高程值,是分析窗口的最小高程值 | |
| 局部割裂度 | 是局部流域范围内的负地形面积,是局部流域面积 | |
| 地表切割深度 | 是分析窗口的平均高程值,是分析窗口的最小高程值 | |
| 切割指数 | 是分析窗口的最大高程值,是崾岘高程值,是地形起伏度 | |
| 最邻近指数 | 为各崾岘点与最邻近点的平均距离,N为崾岘个数,A为流域面积 | |
| 分布均衡度 | 为划分正方形边长,为包含崾岘点的正方形数目,b为系数 | |
| 空间关联度 | 为崾岘个数,为设定的距离临界值,为两点间距离 |
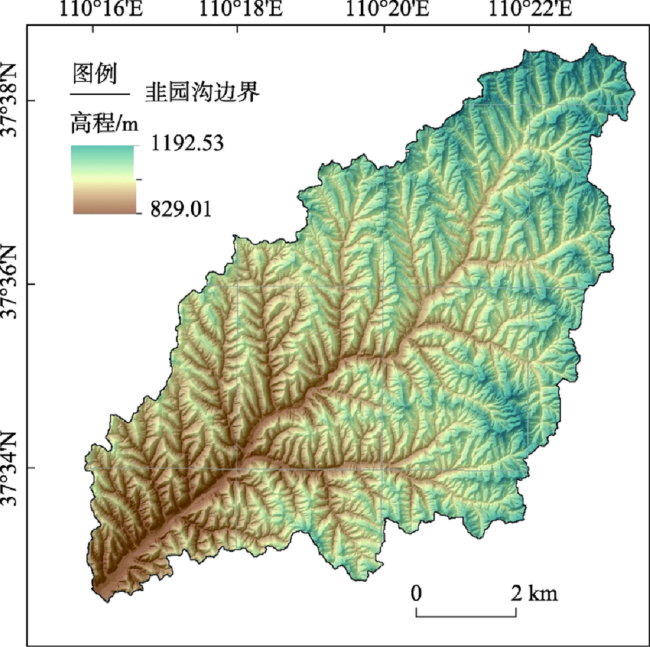
Fig. 4 DEM of the Jiuyuangou Watershed (Suide County, Yulin City, Shaanxi Province)图4 韭园沟流域DEM(陕西省榆林市绥德县) |
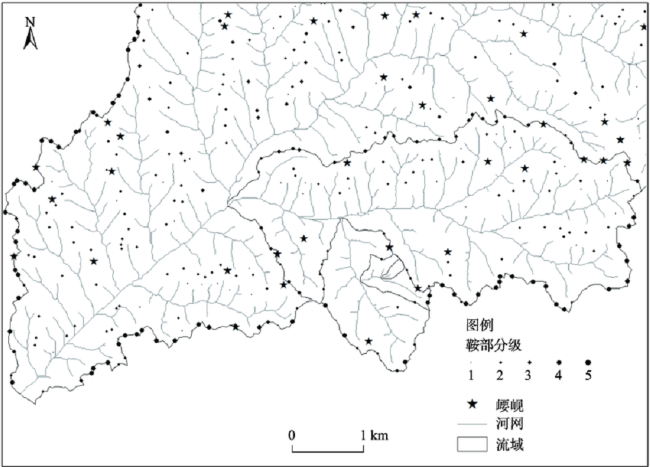
Fig. 5 Extraction results of normal saddle and dissected saddle (partial)图5 鞍部点与崾岘提取结果(局部) |
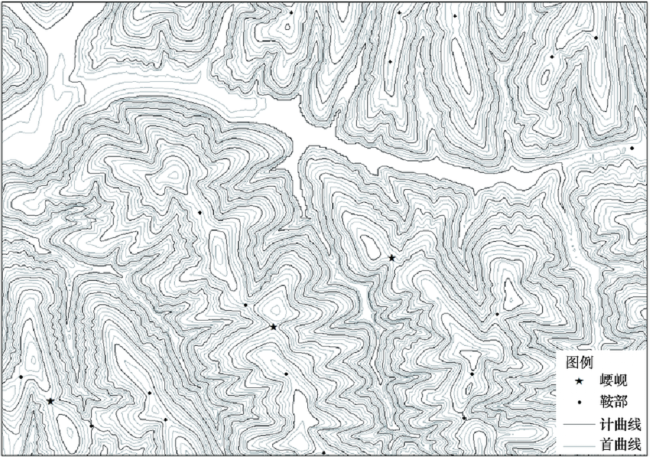
Fig. 6 Matching the contour line with the corresponding point (partial)图6 等高线与对应点位的匹配(局部) |
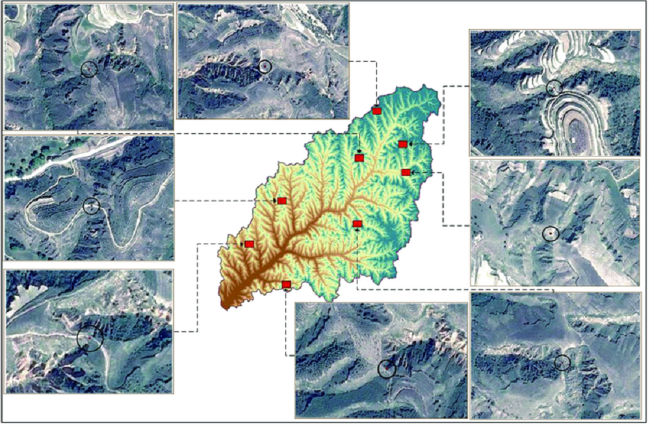
Fig. 7 Distribution of dissected saddles (partial)图7 影像下的崾岘分布(局部) |
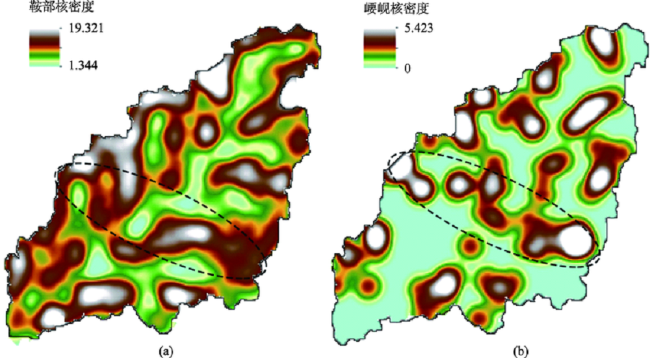
Fig. 8 Kernel density of saddle and dissected saddle图8 鞍部与崾岘核密度图 |
Tab. 2 Statistical properties of the nearest neighbor表2 最邻近点的统计属性 |
| 最大值/m | 最小值/m | 平均值/m | 标准差/m | 中位数/m | 平均离差/m | 变异系数 | |
|---|---|---|---|---|---|---|---|
| 鞍部 | 514.42 | 11.18 | 167.76 | 77.15 | 156.21 | 60.62 | 0.46 |
| 崾岘 | 1234.15 | 97.08 | 510.59 | 260.67 | 466.31 | 215.23 | 0.51 |
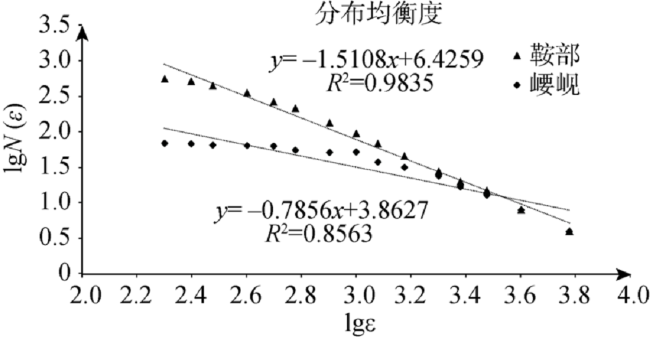
Fig. 9 Distribution equilibrium degree图9 分布均衡度图 |
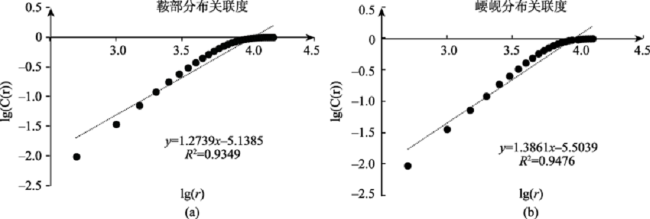
Fig. 10 Distribution relevant degree图10 分布关联度图 |
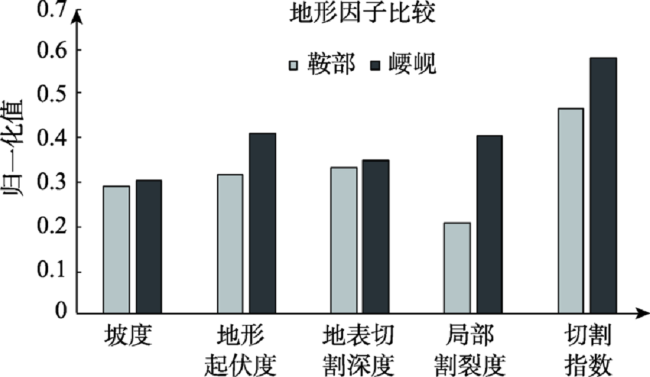
Fig. 11 Comparison of terrain factors图11 地形因子比较图 |
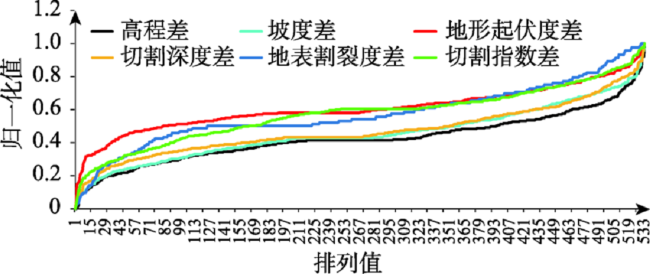
Fig. 12 Line chart of terrain factors图12 各地形因子值排列折线图 |
Tab. 3 Differ of terrain factors in different level表3 各级地形因子差值表 |
| 级别 | 高程差 | 坡度差 | 地形起伏度差 | 局部割裂度差 | 地表切割深度差 | 切割指数差 |
|---|---|---|---|---|---|---|
| 1 | -1.55 | -1.38 | -1.01 | 0.02 | -0.61 | -0.11 |
| 2 | -1.97 | 0.01 | 0.44 | 0.06 | 0.31 | 0.01 |
| 3 | -0.71 | 0.25 | 0.70 | 0.05 | 0.46 | 0.04 |
| 4 | -2.51 | 3.25 | 1.26 | 0.28 | 0.44 | 0.07 |
| 5 | -6.07 | 3.69 | 1.76 | 0.32 | 1.33 | 0.06 |
The authors have declared that no competing interests exist.
| [1] |
[
|
| [2] |
[
|
| [3] |
[
|
| [4] |
[
|
| [5] |
[
|
| [6] |
[
|
| [7] |
[
|
| [8] |
[
|
| [9] |
[
|
| [10] |
[
|
| [11] |
[
|
| [12] |
[
|
| [13] |
[
|
| [14] |
[
|
| [15] |
|
| [16] |
[
|
| [17] |
|
| [18] |
|
| [19] |
|
| [20] |
[
|
| [21] |
[
|
| [22] |
[
|
| [23] |
[
|
| [24] |
[
|
| [25] |
[
|
| [26] |
[
|
/
| 〈 |
|
〉 |