
Journal of Geo-information Science >
Analysis of Vegetation Coverage Change in Yunnan Province Based on MODIS-NDVI
Received date: 2018-08-09
Online published: 2018-12-20
Supported by
Strategic Priority Research Program of Chinese Academy of Sciences, No.XDA20030302;IWHR (China Institute of Water Resources and Hydropower Research) National Mountain Flood Disaster Investigation Project, No.SHZH-IWHR-57;National Natural Science Foundation of China, No.51774250;The Tibet Autonomous Region Science And Technology Support Project, No.809;Southwest Petroleum University Of Science And Technology Innovation Team Projects, No.2017CXTD09.
Copyright
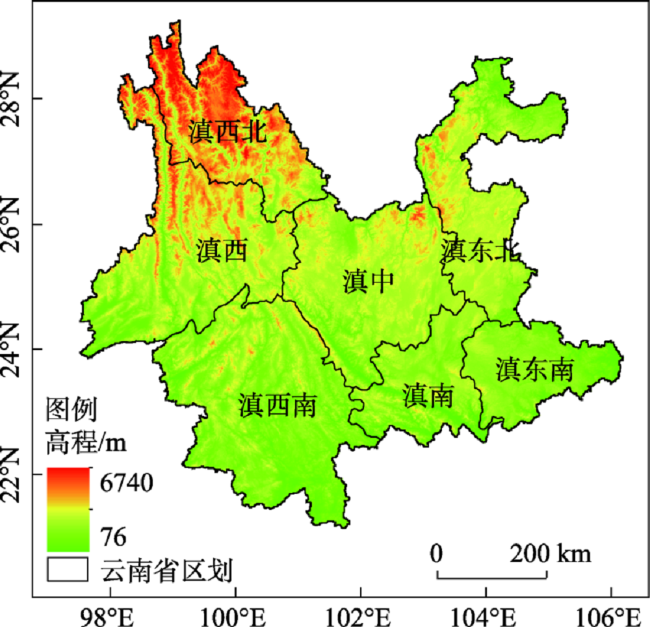
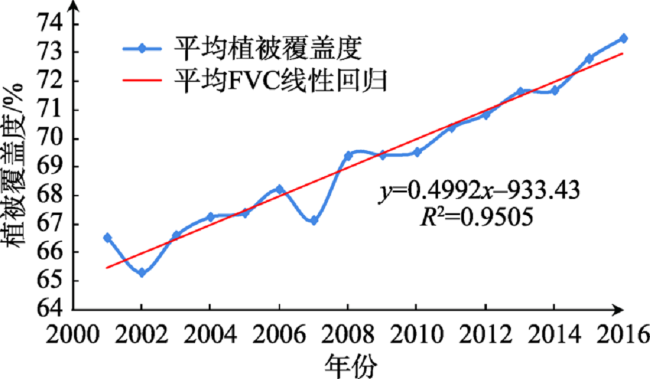
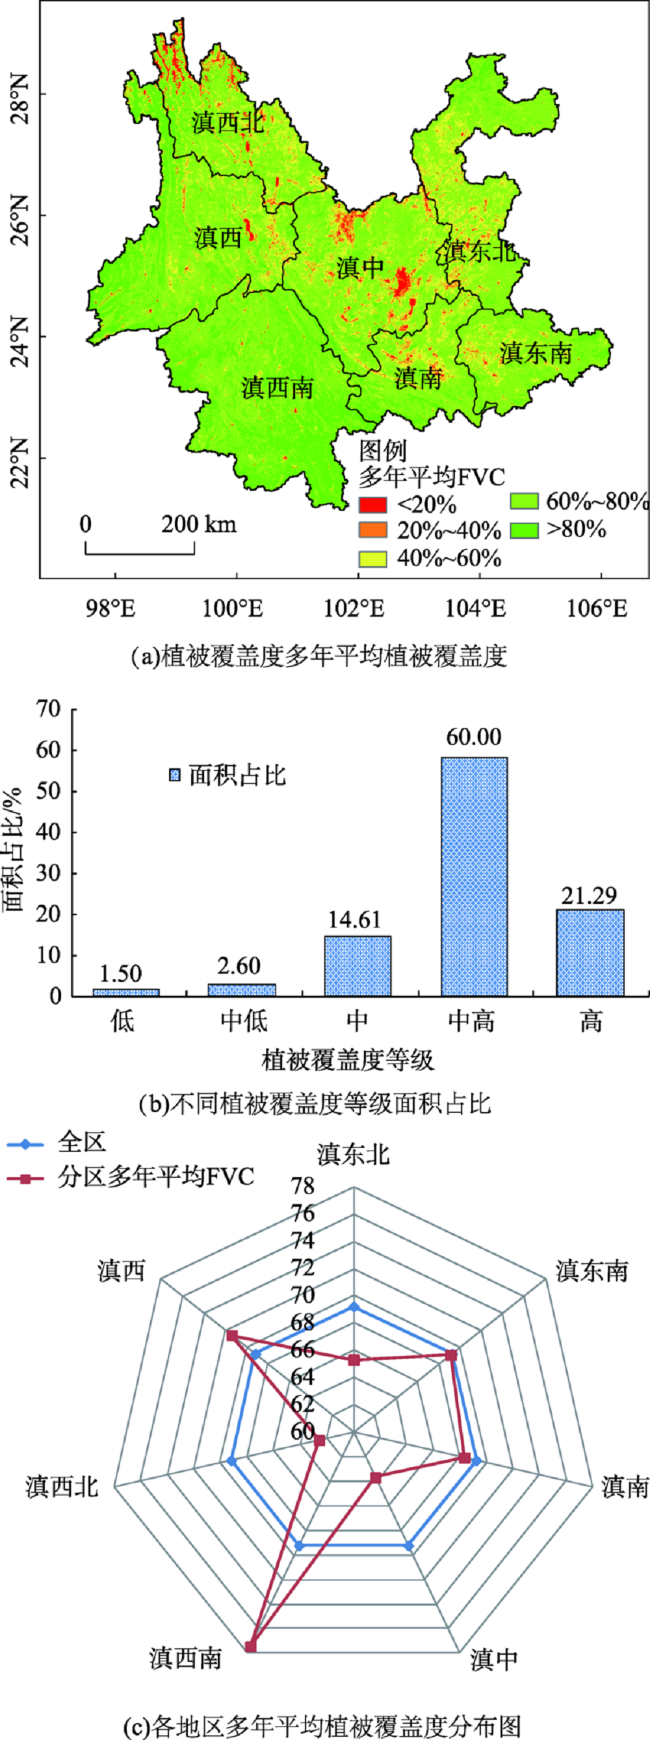
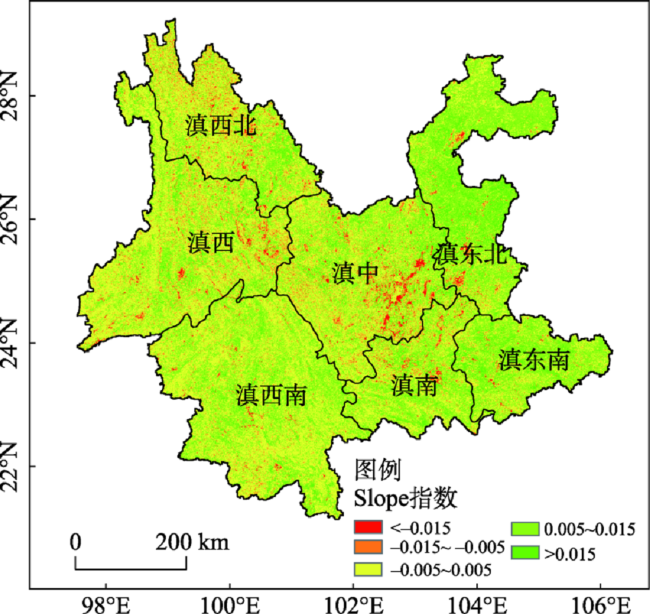
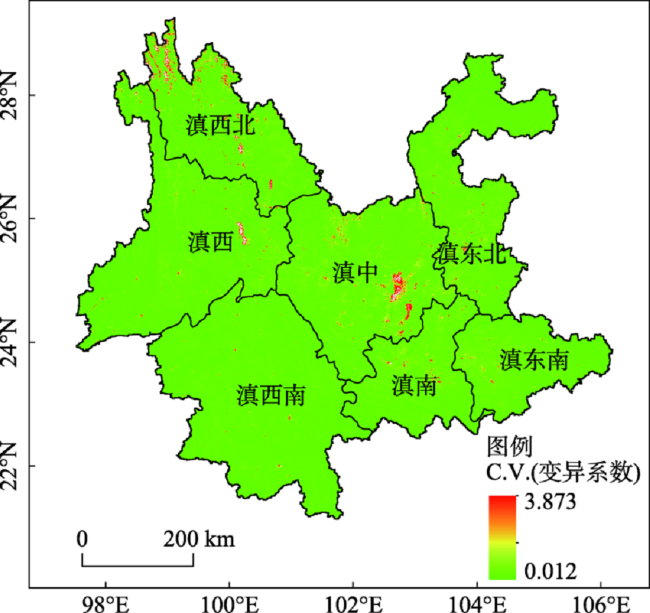
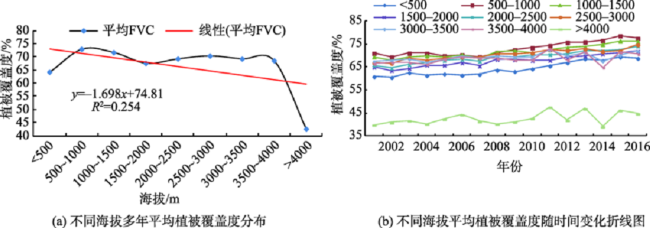
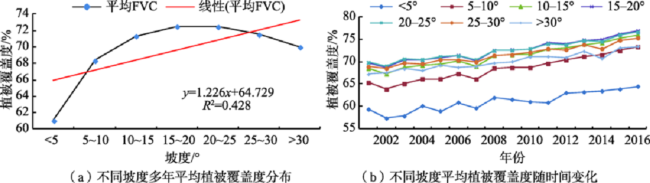
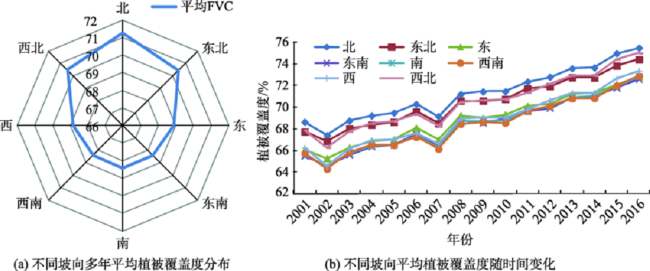
The monitoring of vegetation cover change is the basis of regional resource and environmental bearing capacity research. This paper estimates the vegetation of Yunnan Province from 2001 to 2016 by calculating the MODIS-NDVI vegetation index from 2001 to 2016, supplemented by trend analysis, and coefficient of variation. Next, the spatial and temporal variation characteristics of vegetation coverage and its distribution relationship with topographic factors are discussed in depth. Results are shown as follows: ① From 2001 to 2016, the vegetation coverage in Yunnan shows a significant increase, with a growth rate of 4.992%/10 a.② Spatially, the spatial pattern of vegetation coverage appears to be gradually decreasing from the south to the north and from the west to the east. The vegetation coverage is highest in the west and southwestern Yunnan and the lowest in the northwestern Yunnan. The stability of the vegetation coverage is characterized by increasing volatility from southwest to northeast; the increase of vegetation coverage in northeastern Yunnan was significantly better than other areas. The study region of the vegetation coverage change trend which was increased, basically stable and decreased, accounting for 49.53%, 43.76% and 6.71%, respectively.③ The area transfer matrix results of vegetation coverage in the three periods from 2001-2006, 2006-2011, and 2011-2016 all showed that the vegetation cover evolution area was larger than the degraded area, and the ratios of the two were 1.42, 1.63, and 2.0. It indicates that the vegetation coverage shows a continuous improvement trend in the study area. ④ The relationship between vegetation coverage and topographic factors in Yunnan Province shows that the average vegetation coverage increases first, then decreases, then increases, and then decreases with the increase in altitude; it increases first and then decreases with increasing slope; Changes have gradually decreased from north to south.
XIONG Junnan , PENG Chao , CHENG Weiming , LI Wei , LIU Zhiqi , FAN Chunkun , SUN Huaizhang . Analysis of Vegetation Coverage Change in Yunnan Province Based on MODIS-NDVI[J]. Journal of Geo-information Science, 2018 , 20(12) : 1830 -1840 . DOI: 10.12082/dqxxkx.2018.180371
Fig. 1 Location of the study area and the area division图1 研究区位置及区域划分 |
Fig. 2 Temporal variation of average vegetation coverage from 2001 to 2016图2 2001-2016年平均植被覆盖度随时间变化趋势 |
Tab. 1 Statistical characteristics of vegetation coverage changes in Yunnan (Some years)表1 云南地区植被覆盖度变化统计特征(部分年份) |
| 区域 | 年份 | 平均值 | 标准差 | 增长率/% | |||||
|---|---|---|---|---|---|---|---|---|---|
| 2001 | 2004 | 2007 | 2010 | 2013 | 2016 | ||||
| 滇东北 | 60.72 | 62.54 | 64.77 | 67.89 | 70.16 | 71.87 | 65.32 | 4.28 | 18.36 |
| 滇东南 | 64.20 | 64.87 | 67.87 | 68.05 | 72.60 | 75.77 | 69.09 | 3.80 | 18.02 |
| 滇南 | 65.40 | 66.05 | 65.82 | 67.61 | 71.01 | 72.27 | 68.32 | 2.62 | 10.50 |
| 滇西 | 69.53 | 70.06 | 69.50 | 71.62 | 73.20 | 75.15 | 71.43 | 1.71 | 8.09 |
| 滇西北 | 59.76 | 60.72 | 62.14 | 63.39 | 65.25 | 64.89 | 62.60 | 1.63 | 8.57 |
| 滇西南 | 75.13 | 75.39 | 73.34 | 77.84 | 79.34 | 81.40 | 77.44 | 2.50 | 8.34 |
| 滇中 | 62.32 | 62.95 | 61.59 | 63.00 | 64.75 | 67.61 | 63.68 | 1.98 | 8.49 |
| 全区 | 66.52 | 67.25 | 67.13 | 69.52 | 71.63 | 73.50 | 69.22 | 2.36 | 10.49 |
Fig. 3 Spatial distribution of vegetation coverage in Yunnan Province图3 云南省植被覆盖度空间分布 |
Fig. 4 Trend of vegetation coverage in Yunnan Province from 2001 to 2016图4 云南省2001-2016年植被覆盖度变化趋势 |
Tab. 2 Area and ratio of vegetation coverage change in Yunnan Province表2 云南省植被覆盖度变化面积及比例 |
| 变化趋势等级 | 面积/km2 | 面积比例/% |
|---|---|---|
| 明显减少 | 4727.5625 | 1.23 |
| 轻度减少 | 20 986.4375 | 5.48 |
| 基本稳定 | 16 7670.9375 | 43.76 |
| 轻度增加 | 15 9351.8750 | 41.58 |
| 明显增加 | 30 467.7500 | 7.95 |
Fig. 5 Stability of vegetation coverage change in Yunnan Province from 2001 to 2016图5 云南省2001-2016年植被覆盖度变化稳定性 |
Tab. 3 The transfer matrix of the coverage degree of vegetation coverage in Yunnan Province from 2001 to 2016表3 2001-2016年云南省各植被覆盖度等级面积的转移矩阵 |
| 时段 | FVC等级 | 低/% | 中低/% | 中/% | 中高/% | 高/% | 总计/% |
|---|---|---|---|---|---|---|---|
| 2001-2006 | 低 | 1.36 | 0.41 | 0.15 | 0.05 | 0.02 | 1.98 |
| 中低 | 0.45 | 1.56 | 1.33 | 0.30 | 0.07 | 3.72 | |
| 中 | 0.20 | 2.17 | 9.71 | 5.59 | 0.94 | 18.61 | |
| 中高 | 0.06 | 0.69 | 9.66 | 33.20 | 9.43 | 53.04 | |
| 高 | 0.02 | 0.13 | 1.37 | 11.25 | 9.88 | 22.65 | |
| 总计 | 2.08 | 4.96 | 22.22 | 50.40 | 20.34 | 100.00 | |
| 2006-2011 | 低 | 1.35 | 0.42 | 0.23 | 0.08 | 0.02 | 2.10 |
| 中低 | 0.43 | 1.34 | 1.47 | 0.44 | 0.07 | 3.75 | |
| 中 | 0.15 | 1.48 | 7.78 | 5.26 | 0.67 | 15.34 | |
| 中高 | 0.04 | 0.40 | 7.80 | 32.03 | 7.92 | 48.19 | |
| 高 | 0.01 | 0.08 | 1.33 | 15.22 | 13.97 | 30.63 | |
| 总计 | 1.98 | 3.72 | 18.61 | 53.04 | 22.65 | 100.00 | |
| 2011-2016 | 低 | 1.27 | 0.33 | 0.17 | 0.07 | 0.02 | 1.86 |
| 中低 | 0.48 | 0.88 | 0.75 | 0.26 | 0.06 | 2.43 | |
| 中 | 0.26 | 1.68 | 4.79 | 3.14 | 0.58 | 10.45 | |
| 中高 | 0.07 | 0.75 | 8.29 | 28.38 | 9.22 | 46.71 | |
| 高 | 0.02 | 0.11 | 1.33 | 16.33 | 20.75 | 38.55 | |
| 总计 | 2.10 | 3.75 | 15.34 | 48.19 | 30.63 | 100.00 |
注: 表示植被覆盖度等级没有发生变化的面积和比例 |
Fig. 6 Distribution and change characteristics of average vegetation coverage at different altitudes in Yunnan Province from 2001 to 2016图6 2001-2016年云南省不同海拔平均植被覆盖度分布规律及变化特征 |
Fig. 7 Distribution and change characteristics of average vegetation coverage at different slopes in Yunnan Province from 2001 to 2016图7 2001-2016年云南省不同坡度平均植被覆盖度分布规律及变化特征 |
Fig. 8 Distribution and change characteristics of average vegetation coverage at different slope directions in Yunnan Province from 2001 to 2016图8 2001-2016年云南省不同坡向平均植被覆盖度的分布规律及变化特征 |
The authors have declared that no competing interests exist.
| [1] |
[
|
| [2] |
|
| [3] |
[
|
| [4] |
[
|
| [5] |
|
| [6] |
[
|
| [7] |
[
|
| [8] |
[
|
| [9] |
[
|
| [10] |
[
|
| [11] |
[
|
| [12] |
[
|
| [13] |
|
| [14] |
|
| [15] |
|
| [16] |
[
|
| [17] |
[
|
| [18] |
[
|
| [19] |
|
| [20] |
|
| [21] |
[
|
| [22] |
[
|
| [23] |
[
|
| [24] |
[
|
| [25] |
[
|
| [26] |
[
|
| [27] |
[
|
/
| 〈 |
|
〉 |