
Journal of Geo-information Science >
Spatial Structure and Population Flow Analysis in Chengdu-Chongqing Urban Agglomeration based on Weibo Check-in Big Data
Received date: 2018-05-10
Request revised date: 2018-11-21
Online published: 2019-01-20
Supported by
Higher Education Teaching Reform Project of Chongqing, No.183171
Chongqing R&D Project of the High Technology and Major Industries, No.2017-1231
Chinese Academy of Sciences Undergraduate Innovation Training Program
Copyright
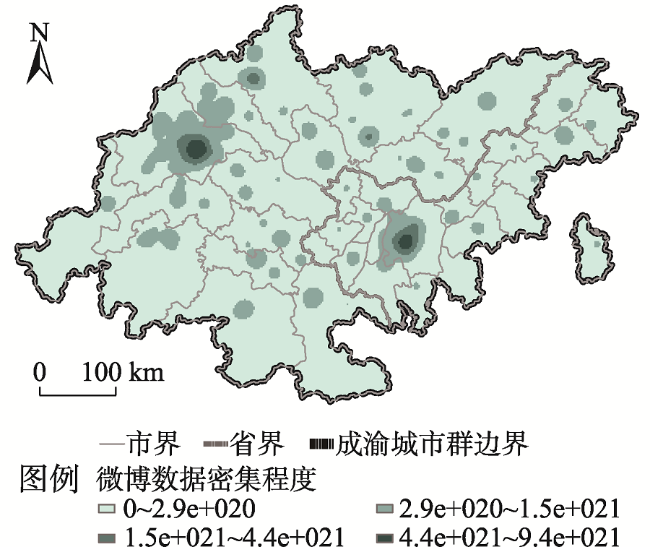
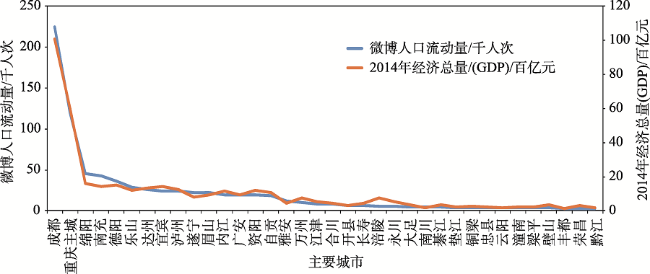
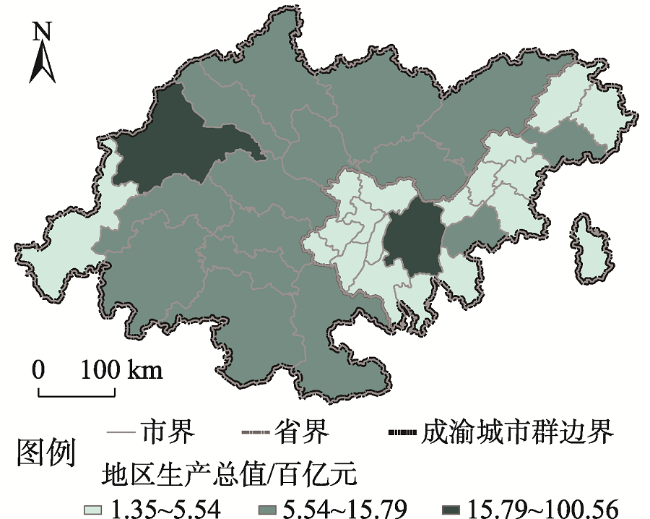
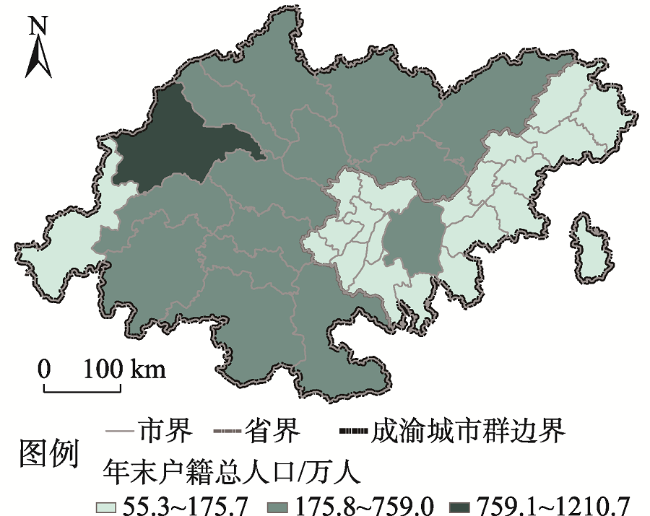
With the rapid development of regional integration, nowadays the regional inter-city migration gets the more attention of the scholars at home and abroad. Micro-blog, as one of the most popular application in China, has become a hotspot of research in areas such as sociology and computer. Check-in, as one of Micro-blog's functions, can reflect the flow of inter-city population in real time. We used the crawler program to collect the research samples in the Chengdu-Chongqing urban agglomeration in January 2014. The information includes the Micro-blog's unique ID number, the grid coordinates of Micro-blog sending place, and the city code of the registered place, etc. By running this program, a total of 804204 valid Micro-blog check-in data weare obtained from the Chengdu-Chongqing urban agglomeration. Based on Micro-blog checking areas, this study analyzeds the spatial structure of the Chengdu-Chongqing urban agglomeration. And Wwe combined the micro-blog data with the traditional socioeconomic data, in order to analyze the impact factors of the regional migration. The results indicates that the spatial structure of micro-blog shows the characteristics of "many centers of dual-core" group in this area. There are only two cities whose micro-blog flows are more than 100,000. They are Chengdu and Chongqing, forming athe “dual-core”. The direction of Micro-blog flow is affected by administrative division, and the intensity of Micro-blog flow presents a certain grade difference. The network shows an obvious hierarchy, and it closely correlatesnnects with the actual social-economic area closely, such as GDP, population size and the strength of traffic connection. For Chengdu and Chongqing, its GDP ranksed first and second,1, 2 respectively, with athe population size all of greater than 7.59 million and both as a regional transport hubs, it makes their micro-blogWeibo flows areintensity in ranked 1st and, 2nd, places respectively. Lastly, there are still some differences between Micro-blog's space and the actual geographic space inof Chengdu-Chongqing urban agglomeration. In the background of the national Yangtze River Economic Belt and China's new urbanization, we put the network information into the geographical space. Actually In this paper we discovered the spatial network characteristics of Chengdu-Chongqing urban agglomeration, and then this paper pointeds out the influence of socioeconomic factors on Micro-blog cyberspace flow. Of course, there may still be other factors behind Micro-blog's cyberspace, which need to be explored and analyzed in the future.
PAN Bilin , WANG Jianghao , GE Yong , MA Mingguo . Spatial Structure and Population Flow Analysis in Chengdu-Chongqing Urban Agglomeration based on Weibo Check-in Big Data[J]. Journal of Geo-information Science, 2019 , 21(1) : 68 -76 . DOI: 10.12082/dqxxkx.2019.180235
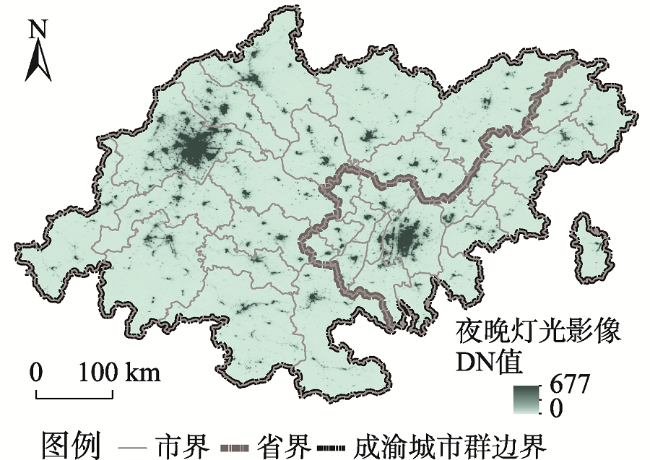
Fig. 1 Night lights from remote sensing图1 夜晚灯光遥感 |
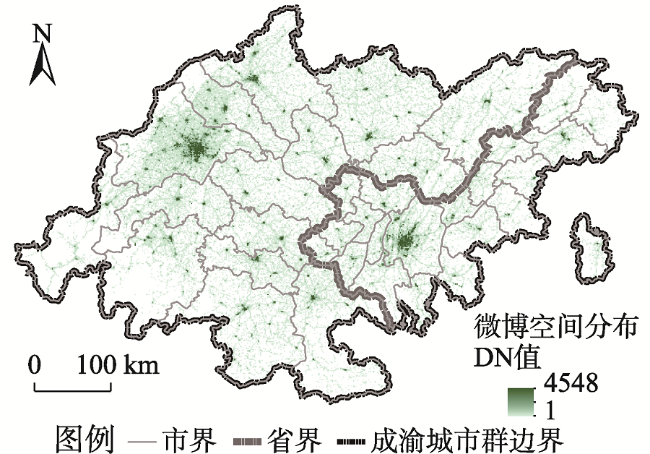
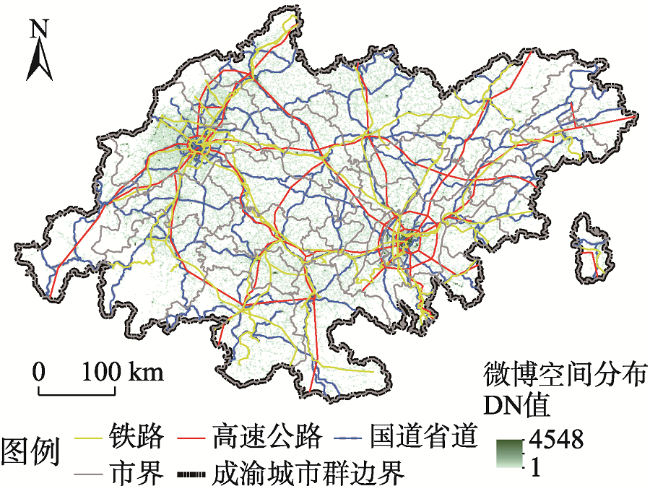
Fig. 2 The spatial distribution of micro-blog图2 微博空间分布 |
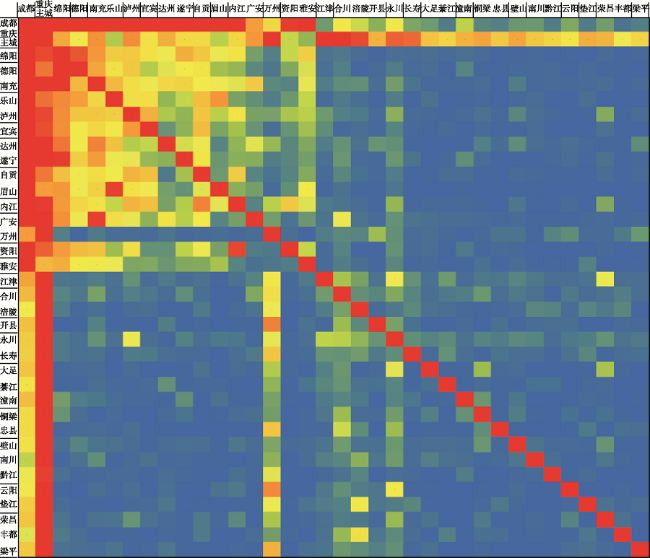
Fig. 3 The matrix of population flow图3 人口流动矩阵 |
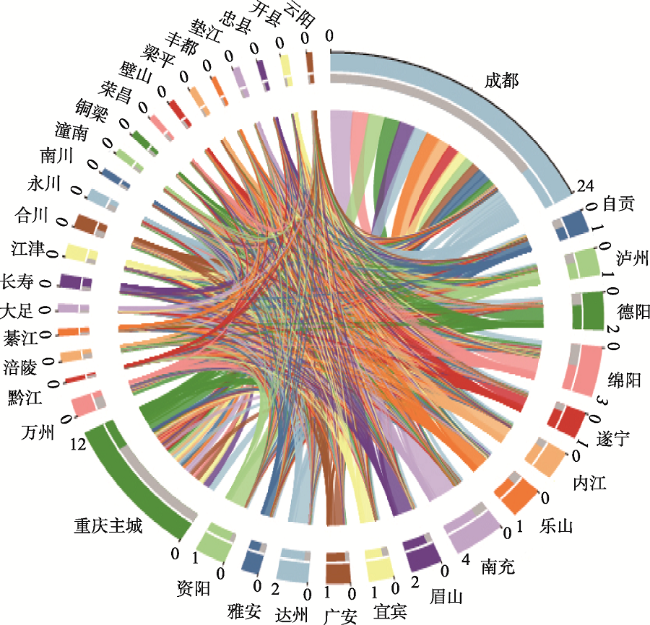
Fig. 4 The diagram of micro-blog flow图4 微博流量 |
Tab. 1 City orientation of Chengdu-Chongqing urban agglomeration表1 成渝城市群的城市定位 |
| 城市定位 | 城市目录 |
|---|---|
| 辐射带动城市 | 重庆、成都 |
| 区域中心城市 | 万州、黔江、绵阳、南充、乐山、泸州、宜宾 |
| 重要节点城市 | 涪陵、长寿、江津、合川、永川、南川、綦江、大足、璧山、铜梁、潼南、荣昌、梁平、丰都、垫江、忠县、开县、云阳、达州、内江、自贡、德阳、眉山、遂宁、资阳、广安、雅安 |
注:来自2016年4月《成渝城市群发展规划》。 |
Fig. 5 The density of Micro-blog activity图5 微博活动空间密集度 |
Fig. 6 Comparisons of the intensity of micro-blog flow with the social-economic development level图6 微博流动强度与社会经济发展水平 |
Fig. 7 The GDP of each district cities图7 各地级市地区生产总值 |
Fig. 8 The size of city household register图8 各市户籍人口规模 |
Fig. 9 The relationship between traffic network and Micro-blog space图9 交通网络与微博空间关系 |
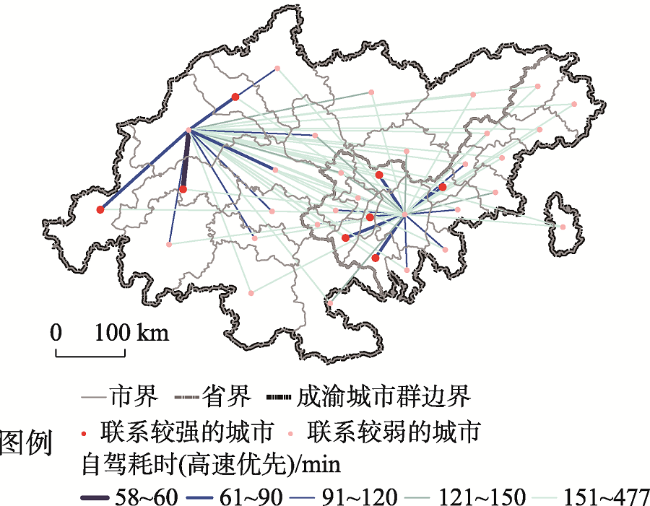
Fig. 10 The strength of the transport links图10 成都和重庆主城的交通联系 |
The authors have declared that no competing interests exist.
| [1] |
|
| [2] |
|
| [3] |
|
| [4] |
|
| [5] |
|
| [6] |
[
|
| [7] |
[
|
| [8] |
[
|
| [9] |
[
|
| [10] |
[
|
| [11] |
[
|
| [12] |
[
|
| [13] |
[
|
| [14] |
[
|
| [15] |
[
|
| [16] |
[
|
| [17] |
[
|
| [18] |
[
|
| [19] |
|
| [20] |
|
| [21] |
|
| [22] |
[
|
| [23] |
[
|
| [24] |
[
|
| [25] |
[
|
| [26] |
[
|
| [27] |
[
|
| [28] |
[
|
| [29] |
[
|
| [30] |
[
|
| [31] |
[
|
/
| 〈 |
|
〉 |