
Journal of Geo-information Science >
Dynamics of Monthly Vegetation Activity and Its Responses to Climate Change in the Qinghai-Tibet Plateau
Received date: 2018-09-11
Request revised date: 2018-11-11
Online published: 2019-01-30
Supported by
National Key Research and Development Program of China, No.2016YFC0500401-5
National Science Foundation of China, No.41001055
Copyright
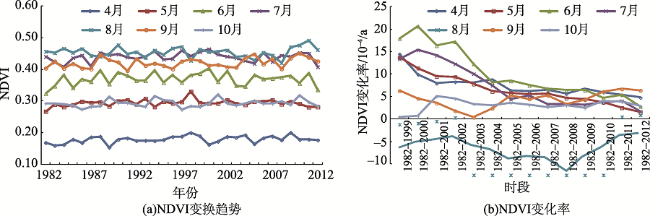
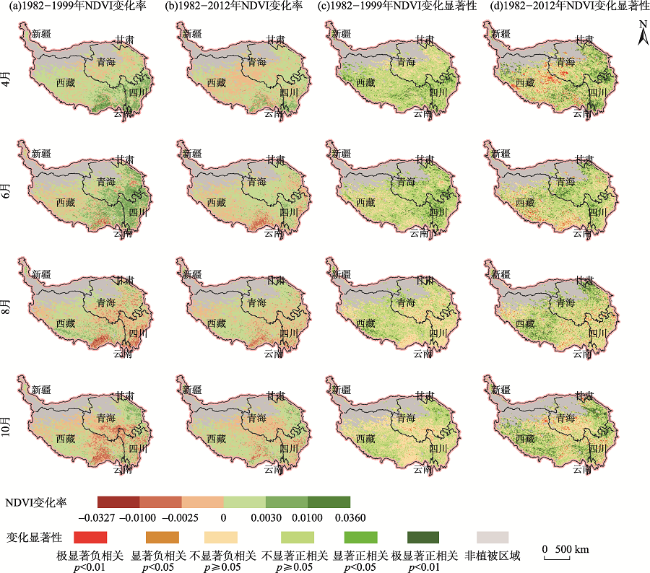
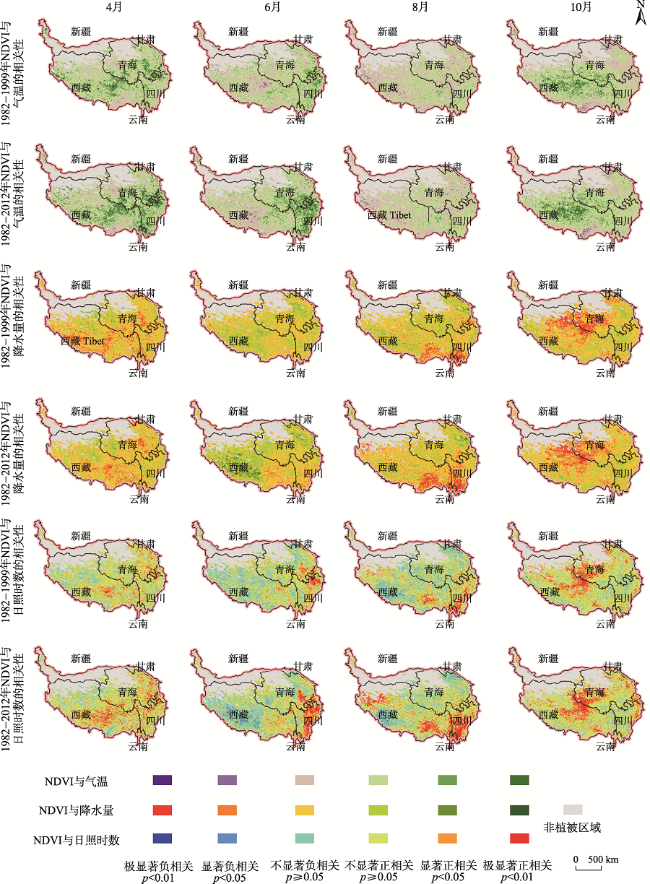
Understanding the spatial pattern and dynamic processes of vegetation changes and their causes is one of the key topics in research on global change of terrestrial ecosystems. Characterized by vulnerable alpine vegetation, which is sensitive to external disturbance, the Qinghai-Tibet Plateau is one of the ideal areas for studying the response of vegetation to climate change. It is necessary to investigate the impacts of climate change on vegetation in a short synthetic period because of the intense climate variations in the Qinghai-Tibet Plateau. Previous studies have not sufficiently investigated NDVI change comparisons between various periods and the persistence of NDVI trends. In this study, we investigated monthly vegetation dynamics in the Qinghai-Tibet Plateau and their relationships with climatic factors over 15 progressive periods of 18-32 years starting in 1982. This was accomplished by using the updated Global Inventory Modeling and Mapping Studies (GIMMS) third generation global satellite Advanced Very High Resolution Radiometer (AVHRR) Normalized Difference Vegetation Index (NDVI) dataset and climate data. The NDVI time-synthesis method of each season masks the trends of NDVI variations within the single month. Except for August, vegetation increased in other six months, with a significant increase occurring in April-July and September. The increase rate of NDVI in most months decreased significantly with the extension of the period, indicating that the increasing trend of NDVI slowed down. At pixel scale, the regions with significant changes (including both increase and decrease) in NDVI showed increasing trends in most months, but the range of significant decreases in NDVI expanded faster than that of significant increases. Vegetation activities in the Qinghai-Tibet Plateau are generally controlled by temperature changes, but the dominant climatic factors affecting vegetation are varied in different months and regions. The vegetation activities in April and July were mainly promoted by temperature and sunshine hours, and those in June and September were controlled by temperature, and in August were mainly affected by precipitation. The emergence of long time series NDVI data sets provides a precondition for application of nested time series to study the trend analysis of vegetation growth and change. The persistence of the trend of vegetation activity may help to visualize the process of vegetation change, understand the vegetation response to climate change, and to predict thevegetation growth trend. It is inferred that the increases of NDVI in the future tend to be more moderate in general, but areas with significant pixel-scale changes in NDVI tend to increase in most months.
ZHENG Hailiang , FANG Shifeng , LIU Chengcheng , WU Jinhua , DU Jiaqiang . Dynamics of Monthly Vegetation Activity and Its Responses to Climate Change in the Qinghai-Tibet Plateau[J]. Journal of Geo-information Science, 2019 , 21(2) : 201 -214 . DOI: 10.12082/dqxxkx.2019.180458
Fig. 1 Trends in monthly NDVI in the Qinghai-Tibet Plateau图1 青藏高原生长季月尺度NDVI变化趋势 |
Tab. 1 Slopes in monthly NDVI during nested periods in the Qinghai-Tibet Plateau (10-4/yr)表1 青藏高原各时段月NDVI变化率 |
| 4月 | 5月 | 6月 | 7月 | 8月 | 9月 | 10月 | |
|---|---|---|---|---|---|---|---|
| 1982-1999 | 14.51** | 13.72* | 17.96* | 13.37* | -1.15 | 6.32 | 0.51 |
| 1982-2000 | 9.96* | 11.37* | 20.68* | 15.37* | -0.89 | 4.61 | 0.77 |
| 1982-2001 | 7.96 | 9.52* | 16.36* | 14.18** | -0.45 | 3.59 | 5.05 |
| 1982-2002 | 8.30* | 9.42* | 17.25* | 12.31* | 0.37 | 1.87 | 4.54 |
| 1982-2003 | 8.10* | 7.83* | 12.32 | 10.11* | -1.55 | 0.42 | 3.35 |
| 1982-2004 | 8.78* | 6.18 | 8.18 | 7.50 | -2.61 | 2.43 | 3.02 |
| 1982-2005 | 6.41 | 5.84 | 8.50 | 4.40 | -4.70 | 5.24 | 3.61 |
| 1982-2006 | 6.18 | 5.55 | 7.53 | 5.23 | -4.08 | 4.47 | 3.13 |
| 1982-2007 | 6.44* | 5.69* | 6.79 | 3.33 | -4.33 | 5.29 | 2.71 |
| 1982-2008 | 5.64* | 4.71 | 6.44 | 3.37 | -6.38 | 3.38 | 3.02 |
| 1982-2009 | 6.71* | 4.45 | 6.43 | 3.16 | -4.27 | 4.33 | 2.45 |
| 1982-2010 | 6.00* | 3.77 | 4.75 | 3.77 | -2.17 | 6.14 | 3.98 |
| 1982-2011 | 5.42* | 2.53 | 5.44 | 4.08 | 0.53 | 6.72* | 3.82 |
| 1982-2012 | 4.78* | 1.52 | 2.82 | 1.74 | 0.96 | 6.41* | 2.94 |
注:*和 **分别为统计显著性检验P<0.05和P<0.01。 |
Fig. 2 Spatial patterns of monthly NDVI changes in the Qinghai-Tibet Plateau图2 青藏高原部分月份NDVI变化的空间格局 |
Tab. 2 Area proportions of significant increase and decrease in monthly NDVI (%)表2 青藏高原月NDVI呈增加、显著增加和显著减少区域比例 |
| 时段 | 4月 | 5月 | 6月 | 7月 | ||||||||
|---|---|---|---|---|---|---|---|---|---|---|---|---|
| 增加 P | 显著减少SN | 显著增加SP | 增加 P | 显著减少SN | 显著增加SP | 增加 P | 显著减少SN | 显著增加SP | 增加 P | 显著减少SN | 显著增加SP | |
| 1982-1999 | 80.00 | 0.23 | 11.92 | 84.73 | 0.21 | 22.10 | 75.40 | 0.73 | 13.41 | 72.69 | 1.47 | 13.51 |
| 1982-2000 | 74.04 | 0.32 | 7.43 | 83.74 | 0.24 | 20.74 | 85.08 | 0.32 | 18.97 | 79.02 | 0.65 | 16.83 |
| 1982-2001 | 74.36 | 0.33 | 7.66 | 81.69 | 0.33 | 19.47 | 83.49 | 0.31 | 14.44 | 76.60 | 0.77 | 17.30 |
| 1982-2002 | 70.25 | 0.75 | 8.35 | 81.40 | 0.45 | 22.32 | 85.24 | 0.32 | 16.87 | 74.76 | 0.85 | 16.21 |
| 1982-2003 | 67.18 | 1.51 | 8.69 | 78.46 | 0.90 | 23.08 | 80.42 | 0.52 | 12.74 | 71.71 | 1.15 | 14.47 |
| 1982-2004 | 68.92 | 1.88 | 11.20 | 75.34 | 1.29 | 23.49 | 75.60 | 0.94 | 10.58 | 67.68 | 1.78 | 13.44 |
| 1982-2005 | 62.47 | 3.13 | 9.12 | 73.36 | 2.06 | 24.09 | 75.06 | 1.06 | 10.31 | 61.95 | 2.41 | 8.65 |
| 1982-2006 | 58.80 | 5.14 | 10.03 | 71.49 | 2.74 | 23.91 | 74.27 | 1.30 | 10.53 | 63.87 | 2.28 | 9.74 |
| 1982-2007 | 57.09 | 6.70 | 11.08 | 71.11 | 3.50 | 25.68 | 73.74 | 1.48 | 9.69 | 60.25 | 2.55 | 7.58 |
| 1982-2008 | 54.65 | 8.31 | 11.25 | 67.59 | 5.17 | 24.23 | 74.63 | 1.68 | 10.82 | 59.82 | 2.89 | 8.72 |
| 1982-2009 | 61.08 | 5.91 | 14.46 | 62.63 | 7.30 | 18.91 | 73.99 | 1.67 | 10.97 | 60.17 | 3.30 | 8.60 |
| 1982-2010 | 62.48 | 5.93 | 15.73 | 58.88 | 9.96 | 18.37 | 68.17 | 2.83 | 10.43 | 61.72 | 2.06 | 8.14 |
| 1982-2011 | 63.21 | 6.22 | 16.94 | 53.42 | 13.45 | 16.17 | 69.76 | 3.00 | 13.15 | 65.47 | 2.34 | 10.36 |
| 1982-2012 | 63.06 | 6.67 | 17.72 | 50.26 | 15.98 | 15.63 | 63.17 | 4.70 | 11.67 | 58.19 | 3.96 | 8.98 |
| 时段 | 8月 | 9月 | 10月 | |||||||||
| 增加 P | 显著减少SN | 显著增加SP | 增加 P | 显著减少SN | 显著增加SP | 增加 P | 显著减少SN | 显著增加SP | ||||
| 1982-1999 | 54.84 | 1.99 | 4.38 | 62.30 | 1.14 | 3.23 | 53.69 | 1.42 | 2.64 | |||
| 1982-2000 | 58.95 | 2.00 | 6.66 | 61.75 | 1.08 | 3.08 | 55.68 | 1.28 | 2.76 | |||
| 1982-2001 | 57.73 | 2.30 | 7.44 | 61.78 | 1.04 | 3.77 | 63.73 | 0.67 | 4.43 | |||
| 1982-2002 | 57.00 | 2.52 | 7.94 | 56.92 | 1.68 | 3.22 | 60.21 | 1.09 | 5.54 | |||
| 1982-2003 | 51.82 | 4.13 | 6.26 | 53.89 | 2.06 | 3.03 | 59.05 | 1.51 | 5.58 | |||
| 1982-2004 | 48.56 | 5.71 | 6.26 | 57.78 | 2.09 | 4.86 | 53.21 | 2.77 | 6.01 | |||
| 1982-2005 | 44.81 | 7.74 | 6.22 | 63.67 | 2.02 | 8.44 | 55.55 | 3.32 | 7.75 | |||
| 1982-2006 | 42.97 | 7.47 | 4.72 | 61.09 | 2.13 | 7.14 | 52.29 | 4.34 | 7.94 | |||
| 1982-2007 | 40.32 | 8.42 | 3.57 | 61.94 | 2.22 | 8.94 | 53.45 | 4.82 | 7.47 | |||
| 1982-2008 | 36.19 | 11.62 | 3.26 | 56.55 | 3.14 | 6.59 | 53.29 | 5.87 | 7.94 | |||
| 1982-2009 | 42.19 | 8.47 | 4.43 | 59.13 | 3.23 | 8.60 | 52.79 | 6.06 | 8.07 | |||
| 1982-2010 | 48.30 | 5.66 | 6.20 | 67.96 | 2.11 | 13.02 | 59.82 | 4.17 | 12.45 | |||
| 1982-2011 | 56.42 | 4.31 | 9.53 | 71.46 | 2.02 | 16.65 | 61.36 | 4.32 | 13.37 | |||
| 1982-2012 | 57.46 | 4.85 | 12.15 | 72.84 | 2.11 | 19.01 | 60.90 | 5.18 | 15.68 | |||
注:P为呈正趋势的像元所占比例;SN为显著负趋势像元所占比例;SP为显著正趋势像元所占比例,下同。 |
Tab. 3 Relationships between monthly NDVI and temperature in the Qinghai-Tibet Plateau表3 研究区域NDVI与气温的相关系数 |
| 时段 | 4月 | 5月 | 6月 | 7月 | 8月 | 9月 | 10月 |
|---|---|---|---|---|---|---|---|
| 1982-1999 | 0.55** | 0.40 | 0.36 | 0.38 | 0.08 | 0.46 | 0.32 |
| 1982-2000 | 0.56** | 0.39 | 0.40 | 0.48* | 0.07 | 0.46* | 0.32 |
| 1982-2001 | 0.56** | 0.39 | 0.41 | 0.47* | 0.08 | 0.41 | 0.38 |
| 1982-2002 | 0.58** | 0.29 | 0.44* | 0.46* | 0.10 | 0.41 | 0.38 |
| 1982-2003 | 0.59** | 0.30 | 0.47* | 0.45* | -0.07 | 0.35 | 0.33 |
| 1982-2004 | 0.62** | 0.28 | 0.48* | 0.47* | -0.12 | 0.39 | 0.32 |
| 1982-2005 | 0.58** | 0.27 | 0.49* | 0.33 | -0.24 | 0.49* | 0.33 |
| 1982-2006 | 0.58** | 0.27 | 0.48* | 0.38 | -0.20 | 0.47* | 0.33 |
| 1982-2007 | 0.60** | 0.31 | 0.48* | 0.36 | -0.24 | 0.49* | 0.30 |
| 1982-2008 | 0.58** | 0.27 | 0.48* | 0.37 | -0.16 | 0.43* | 0.29 |
| 1982-2009 | 0.64** | 0.28 | 0.48** | 0.35 | -0.11 | 0.48* | 0.27 |
| 1982-2010 | 0.63** | 0.26 | 0.45* | 0.39* | 0.03 | 0.52** | 0.29 |
| 1982-2011 | 0.63** | 0.22 | 0.46* | 0.39* | 0.07 | 0.54** | 0.29 |
| 1982-2012 | 0.63** | 0.16 | 0.36* | 0.29 | 0.09 | 0.54** | 0.30 |
注:*和 **分别为统计显著性检验P<0.05和P<0.01。 |
Tab. 4 Relationships between monthly NDVI and precipitation in the Qinghai-Tibet Plateau表4 研究区域NDVI与降水量的相关系数 |
| 时段 | 4月 | 5月 | 6月 | 7月 | 8月 | 9月 | 10月 |
|---|---|---|---|---|---|---|---|
| 1982-1999 | -0.56* | 0.08 | -0.25 | -0.56* | -0.77** | -0.22 | -0.16 |
| 1982-2000 | -0.61** | 0.07 | -0.10 | -0.57* | -0.75** | -0.23 | -0.17 |
| 1982-2001 | -0.60** | 0.06 | -0.12 | -0.58** | -0.74** | -0.23 | -0.19 |
| 1982-2002 | -0.56** | 0.10 | -0.11 | -0.57** | -0.75** | -0.22 | -0.19 |
| 1982-2003 | -0.57** | 0.09 | -0.18 | -0.57** | -0.76** | -0.25 | -0.18 |
| 1982-2004 | -0.51* | 0.06 | -0.22 | -0.59** | -0.74** | -0.32 | -0.18 |
| 1982-2005 | -0.51* | 0.06 | -0.24 | -0.58** | -0.76** | -0.36 | -0.13 |
| 1982-2006 | -0.49* | 0.08 | -0.24 | -0.60** | -0.75** | -0.35 | -0.13 |
| 1982-2007 | -0.48* | 0.10 | -0.23 | -0.62** | -0.75** | -0.33 | -0.13 |
| 1982-2008 | -0.48* | 0.08 | -0.22 | -0.60** | -0.74** | -0.32 | -0.09 |
| 1982-2009 | -0.51** | 0.09 | -0.24 | -0.60** | -0.69** | -0.38* | -0.09 |
| 1982-2010 | -0.50** | 0.06 | -0.23 | -0.60** | -0.59** | -0.30 | -0.07 |
| 1982-2011 | -0.50** | 0.03 | -0.20 | -0.57** | -0.62** | -0.26 | -0.08 |
| 1982-2012 | -0.49** | 0.07 | -0.22 | -0.62** | -0.62** | -0.27 | -0.06 |
注:*和 **分别为统计显著性检验P<0.05和P<0.01。 |
Tab. 5 Relationships between monthly NDVI and sunshine hour in the Qinghai-Tibet Plateau表5 研究区域NDVI与日照时数的相关系数 |
| 时段 | 4月 | 5月 | 6月 | 7月 | 8月 | 9月 | 10月 |
|---|---|---|---|---|---|---|---|
| 1982-1999 | 0.60** | 0.07 | 0.04 | 0.45 | 0.69** | -0.05 | 0.28 |
| 1982-2000 | 0.61** | 0.07 | -0.05 | 0.38 | 0.67** | -0.03 | 0.28 |
| 1982-2001 | 0.60** | 0.07 | 0.00 | 0.39 | 0.66** | -0.03 | 0.27 |
| 1982-2002 | 0.54* | 0.04 | -0.01 | 0.38 | 0.66** | 0.02 | 0.27 |
| 1982-2003 | 0.53* | 0.06 | 0.04 | 0.39 | 0.68** | 0.03 | 0.25 |
| 1982-2004 | 0.53** | 0.05 | 0.06 | 0.41 | 0.68** | 0.10 | 0.25 |
| 1982-2005 | 0.53** | 0.05 | 0.06 | 0.43* | 0.70** | 0.16 | 0.19 |
| 1982-2006 | 0.52** | 0.05 | 0.06 | 0.44* | 0.70** | 0.15 | 0.19 |
| 1982-2007 | 0.50** | 0.06 | 0.06 | 0.44* | 0.71** | 0.14 | 0.19 |
| 1982-2008 | 0.49** | 0.08 | 0.07 | 0.43* | 0.66** | 0.16 | 0.17 |
| 1982-2009 | 0.55** | 0.06 | 0.08 | 0.42* | 0.64** | 0.19 | 0.16 |
| 1982-2010 | 0.55** | 0.07 | 0.09 | 0.42* | 0.57** | 0.13 | 0.11 |
| 1982-2011 | 0.54** | 0.07 | 0.07 | 0.38* | 0.59** | 0.12 | 0.11 |
| 1982-2012 | 0.54** | 0.02 | 0.10 | 0.44* | 0.58** | 0.13 | 0.11 |
注:*和 **分别为统计显著性检验P<0.05和P<0.01。 |
Fig. 3 Correlations between monthly NDVI and climate factors in the Qinghai-Tibet Plateau图3 青藏高原部分月份NDVI与气候因子的相关性 |
Tab. 6 Area proportions of different correlations between monthly NDVI and temperature (%)表6 月NDVI与气温正相关、显著负相关和显著正相关的区域面积比例 |
| 时段 | 4月 | 5月 | 6月 | 7月 | ||||||||
|---|---|---|---|---|---|---|---|---|---|---|---|---|
| 增加 P | 显著减少 SN | 显著增加SP | 增加 P | 显著减少SN | 显著增加SP | 增加 P | 显著减少SN | 显著增加SP | 增加 P | 显著减少SN | 显著增加SP | |
| 1982-1999 | 81.57 | 0.21 | 16.93 | 80.63 | 0.21 | 15.47 | 70.80 | 1.01 | 9.21 | 63.03 | 0.87 | 3.49 |
| 1982-2000 | 82.51 | 0.28 | 17.02 | 79.84 | 0.24 | 16.14 | 76.06 | 0.57 | 10.57 | 67.37 | 0.85 | 6.15 |
| 1982-2001 | 82.63 | 0.23 | 16.93 | 78.92 | 0.19 | 14.53 | 75.56 | 0.51 | 11.14 | 66.50 | 0.87 | 4.55 |
| 1982-2002 | 80.85 | 0.22 | 15.78 | 73.31 | 0.57 | 11.09 | 77.20 | 0.54 | 13.12 | 65.86 | 0.87 | 4.63 |
| 1982-2003 | 79.83 | 0.22 | 15.55 | 72.92 | 0.66 | 11.55 | 78.30 | 0.30 | 14.44 | 66.36 | 0.83 | 4.61 |
| 1982-2004 | 80.59 | 0.27 | 17.22 | 74.01 | 0.52 | 11.75 | 78.35 | 0.30 | 15.74 | 68.10 | 0.65 | 5.30 |
| 1982-2005 | 79.68 | 0.33 | 16.72 | 74.14 | 0.52 | 11.95 | 78.08 | 0.31 | 16.59 | 61.77 | 1.06 | 3.97 |
| 1982-2006 | 80.07 | 0.30 | 16.82 | 74.08 | 0.53 | 12.03 | 78.68 | 0.35 | 16.59 | 64.82 | 0.53 | 4.58 |
| 1982-2007 | 77.13 | 0.40 | 17.10 | 75.77 | 0.44 | 11.92 | 78.63 | 0.34 | 16.90 | 62.89 | 0.63 | 4.50 |
| 1982-2008 | 75.19 | 0.47 | 17.24 | 73.77 | 0.65 | 11.19 | 78.82 | 0.37 | 17.22 | 63.04 | 0.68 | 4.56 |
| 1982-2009 | 79.92 | 0.48 | 22.42 | 74.39 | 0.39 | 10.94 | 78.16 | 0.50 | 17.64 | 62.65 | 1.10 | 5.47 |
| 1982-2010 | 79.18 | 0.64 | 23.80 | 71.96 | 0.42 | 10.67 | 75.42 | 0.74 | 17.27 | 64.41 | 2.14 | 9.08 |
| 1982-2011 | 79.61 | 0.65 | 24.34 | 69.55 | 0.42 | 9.62 | 76.04 | 0.63 | 17.90 | 65.29 | 1.81 | 9.12 |
| 1982-2012 | 80.01 | 0.64 | 24.33 | 65.61 | 0.73 | 8.49 | 73.34 | 1.22 | 17.04 | 62.34 | 2.09 | 8.05 |
| 时段 | 8月 | 9月 | 10月 | |||||||||
| 增加 P | 显著减少SN | 显著增加SP | 增加 P | 显著减少SN | 显著增加SP | 增加 P | 显著减少SN | 显著增加SP | ||||
| 1982-1999 | 52.11 | 1.83 | 2.05 | 68.81 | 1.50 | 4.59 | 68.24 | 1.39 | 12.28 | |||
| 1982-2000 | 47.84 | 3.03 | 1.84 | 67.84 | 1.44 | 4.72 | 69.08 | 1.36 | 13.16 | |||
| 1982-2001 | 48.96 | 2.65 | 1.92 | 67.13 | 1.63 | 5.63 | 73.23 | 1.20 | 14.48 | |||
| 1982-2002 | 49.20 | 3.03 | 1.92 | 67.76 | 1.34 | 5.73 | 73.22 | 1.35 | 14.64 | |||
| 1982-2003 | 41.42 | 4.59 | 1.28 | 66.07 | 1.43 | 5.61 | 72.33 | 1.51 | 14.84 | |||
| 1982-2004 | 39.64 | 5.11 | 1.32 | 66.96 | 1.50 | 6.92 | 72.87 | 1.55 | 15.27 | |||
| 1982-2005 | 35.71 | 6.48 | 1.18 | 71.94 | 1.49 | 10.93 | 72.85 | 1.64 | 15.13 | |||
| 1982-2006 | 35.46 | 7.11 | 1.32 | 70.49 | 1.61 | 10.28 | 73.45 | 1.63 | 15.65 | |||
| 1982-2007 | 32.91 | 8.70 | 1.27 | 70.45 | 1.75 | 11.10 | 73.09 | 1.26 | 15.18 | |||
| 1982-2008 | 34.86 | 7.76 | 1.29 | 68.57 | 1.85 | 9.60 | 73.28 | 1.49 | 14.92 | |||
| 1982-2009 | 37.41 | 6.71 | 1.45 | 70.62 | 1.76 | 11.36 | 72.71 | 1.50 | 14.86 | |||
| 1982-2010 | 48.72 | 5.66 | 2.87 | 75.79 | 1.42 | 14.93 | 75.29 | 1.40 | 16.19 | |||
| 1982-2011 | 50.40 | 4.53 | 3.30 | 77.59 | 1.22 | 17.60 | 75.55 | 1.43 | 16.29 | |||
| 1982-2012 | 52.01 | 3.85 | 4.10 | 78.04 | 1.28 | 18.05 | 74.66 | 1.40 | 14.39 | |||
Tab.7 Area proportions of different correlations between monthly NDVI and precipitation (%)表7 月NDVI与降水量正相关、显著负相关和显著正相关的区域面积比例 |
| 时段 | 4月 | 5月 | 6月 | 7月 | ||||||||
|---|---|---|---|---|---|---|---|---|---|---|---|---|
| 增加 P | 显著减少SN | 显著增加SP | 增加 P | 显著减少SN | 显著增加SP | 增加 P | 显著减少SN | 显著增加SP | 增加 P | 显著减少SN | 显著增加SP | |
| 1982-1999 | 24.19 | 11.74 | 0.54 | 39.58 | 5.33 | 3.58 | 40.81 | 2.74 | 1.21 | 34.30 | 6.83 | 1.03 |
| 1982-2000 | 21.64 | 13.88 | 0.43 | 42.68 | 5.22 | 4.98 | 49.20 | 1.78 | 2.35 | 32.90 | 7.06 | 1.06 |
| 1982-2001 | 23.02 | 12.87 | 0.43 | 46.21 | 4.68 | 5.91 | 50.29 | 1.83 | 3.34 | 34.21 | 5.97 | 1.08 |
| 1982-2002 | 22.88 | 11.75 | 0.52 | 46.07 | 4.75 | 5.67 | 50.84 | 1.76 | 3.44 | 34.08 | 6.03 | 1.03 |
| 1982-2003 | 23.57 | 11.86 | 0.54 | 46.52 | 4.96 | 5.97 | 48.79 | 2.44 | 3.46 | 33.74 | 6.37 | 1.04 |
| 1982-2004 | 22.92 | 11.13 | 0.42 | 46.62 | 5.29 | 5.86 | 47.90 | 3.00 | 3.38 | 32.99 | 6.56 | 0.92 |
| 1982-2005 | 22.02 | 11.96 | 0.44 | 46.30 | 5.54 | 5.96 | 47.42 | 3.47 | 3.60 | 32.99 | 6.42 | 0.92 |
| 1982-2006 | 21.76 | 13.75 | 0.46 | 45.70 | 6.35 | 6.29 | 47.73 | 3.11 | 3.47 | 31.52 | 6.89 | 0.82 |
| 1982-2007 | 24.93 | 12.18 | 0.71 | 46.28 | 6.19 | 5.78 | 46.95 | 3.48 | 3.46 | 30.33 | 7.18 | 0.69 |
| 1982-2008 | 26.36 | 11.86 | 0.86 | 45.61 | 7.89 | 5.99 | 47.52 | 3.45 | 4.71 | 29.96 | 7.59 | 0.62 |
| 1982-2009 | 23.24 | 13.38 | 0.65 | 40.08 | 11.24 | 5.37 | 46.92 | 3.66 | 4.39 | 30.60 | 7.44 | 0.59 |
| 1982-2010 | 21.50 | 15.63 | 0.71 | 39.56 | 11.36 | 5.49 | 47.82 | 3.44 | 5.57 | 28.63 | 7.36 | 0.47 |
| 1982-2011 | 21.46 | 15.62 | 0.72 | 37.91 | 11.75 | 5.39 | 49.62 | 3.55 | 5.03 | 29.88 | 7.19 | 0.56 |
| 1982-2012 | 20.34 | 15.65 | 0.61 | 38.30 | 11.02 | 4.93 | 48.51 | 4.32 | 5.54 | 27.05 | 10.02 | 0.54 |
| 时段 | 8月 | 9月 | 10月 | |||||||||
| 增加 P | 显著减少SN | 显著增加SP | 增加 P | 显著减少SN | 显著增加SP | 增加 P | 显著减少SN | 显著增加SP | ||||
| 1982-1999 | 32.93 | 10.85 | 1.42 | 33.87 | 4.47 | 0.65 | 24.01 | 18.48 | 0.64 | |||
| 1982-2000 | 33.50 | 10.91 | 1.49 | 34.50 | 4.50 | 0.75 | 23.44 | 19.20 | 0.59 | |||
| 1982-2001 | 32.97 | 11.03 | 1.39 | 33.75 | 5.14 | 0.77 | 22.47 | 19.76 | 0.49 | |||
| 1982-2002 | 33.42 | 10.45 | 1.53 | 32.32 | 5.51 | 0.72 | 22.06 | 19.60 | 0.47 | |||
| 1982-2003 | 27.59 | 11.72 | 1.09 | 31.81 | 5.78 | 0.69 | 21.87 | 20.08 | 0.40 | |||
| 1982-2004 | 27.29 | 11.72 | 1.16 | 30.38 | 6.43 | 0.61 | 22.42 | 20.37 | 0.39 | |||
| 1982-2005 | 26.91 | 12.60 | 1.21 | 29.07 | 7.51 | 0.67 | 23.85 | 18.99 | 0.42 | |||
| 1982-2006 | 27.39 | 13.22 | 1.26 | 29.85 | 7.45 | 0.73 | 23.97 | 18.08 | 0.41 | |||
| 1982-2007 | 26.13 | 13.84 | 1.26 | 30.46 | 7.26 | 0.77 | 22.69 | 18.65 | 0.44 | |||
| 1982-2008 | 25.04 | 15.61 | 1.23 | 29.12 | 6.64 | 0.56 | 25.50 | 18.11 | 0.47 | |||
| 1982-2009 | 27.45 | 14.78 | 1.36 | 26.32 | 9.18 | 0.53 | 23.75 | 18.18 | 0.43 | |||
| 1982-2010 | 28.80 | 14.46 | 1.33 | 29.58 | 7.06 | 0.74 | 23.59 | 17.79 | 0.37 | |||
| 1982-2011 | 26.48 | 15.81 | 1.04 | 32.98 | 6.71 | 0.82 | 22.45 | 17.88 | 0.34 | |||
| 1982-2012 | 25.87 | 16.18 | 1.06 | 27.83 | 7.30 | 0.55 | 19.92 | 18.97 | 0.19 | |||
Tab. 8 Area proportions of different correlations between monthly NDVI and sunshine hours (%)表8 月NDVI与日照时数正相关、显著负相关和显著正相关的区域面积比例 |
| 时段 | 4月 | 5月 | 6月 | 7月 | ||||||||
|---|---|---|---|---|---|---|---|---|---|---|---|---|
| 增加 P | 显著减少SN | 显著增加SP | 增加 P | 显著减少SN | 显著增加SP | 增加 P | 显著减少SN | 显著增加SP | 增加 P | 显著减少SN | 显著增加SP | |
| 1982-1999 | 82.39 | 0.11 | 11.84 | 72.23 | 0.84 | 7.16 | 66.96 | 0.71 | 9.05 | 69.98 | 0.89 | 7.86 |
| 1982-2000 | 83.05 | 0.12 | 13.31 | 70.58 | 0.84 | 6.59 | 62.97 | 0.79 | 7.71 | 67.55 | 1.70 | 8.05 |
| 1982-2001 | 79.67 | 0.18 | 12.25 | 68.07 | 1.26 | 6.61 | 62.87 | 1.12 | 8.34 | 65.86 | 1.72 | 7.22 |
| 1982-2002 | 81.12 | 0.22 | 13.46 | 67.44 | 1.13 | 6.33 | 62.70 | 1.19 | 8.91 | 66.08 | 1.75 | 7.23 |
| 1982-2003 | 81.73 | 0.20 | 14.29 | 66.67 | 1.20 | 6.34 | 64.12 | 1.24 | 10.22 | 66.34 | 1.82 | 7.53 |
| 1982-2004 | 82.90 | 0.18 | 14.58 | 67.50 | 1.15 | 6.64 | 64.63 | 1.45 | 11.68 | 66.71 | 1.53 | 7.56 |
| 1982-2005 | 83.09 | 0.18 | 15.61 | 67.74 | 1.17 | 6.97 | 64.34 | 1.49 | 11.96 | 67.67 | 1.38 | 7.66 |
| 1982-2006 | 83.27 | 0.17 | 15.80 | 68.67 | 1.20 | 6.68 | 64.13 | 1.41 | 11.65 | 68.91 | 1.34 | 8.52 |
| 1982-2007 | 81.88 | 0.22 | 14.93 | 68.13 | 1.10 | 6.68 | 64.51 | 1.46 | 12.14 | 69.74 | 1.26 | 9.03 |
| 1982-2008 | 81.41 | 0.24 | 15.12 | 67.83 | 1.03 | 7.50 | 65.57 | 2.12 | 12.19 | 69.78 | 1.36 | 9.62 |
| 1982-2009 | 85.49 | 0.18 | 18.29 | 73.51 | 0.84 | 10.55 | 65.22 | 2.23 | 11.95 | 68.68 | 1.49 | 10.02 |
| 1982-2010 | 85.46 | 0.19 | 19.69 | 73.79 | 0.83 | 10.80 | 64.94 | 2.53 | 12.14 | 70.93 | 1.15 | 10.57 |
| 1982-2011 | 85.99 | 0.18 | 19.77 | 74.30 | 0.68 | 10.67 | 64.51 | 2.59 | 12.49 | 69.28 | 1.26 | 10.13 |
| 1982-2012 | 87.14 | 0.16 | 21.09 | 72.31 | 0.71 | 9.49 | 65.18 | 2.78 | 14.37 | 71.44 | 1.14 | 12.32 |
| 8月 | 9月 | 10月 | ||||||||||
| 增加 P | 显著减少SN | 显著增加SP | 增加 P | 显著减少SN | 显著增加SP | 增加 P | 显著减少SN | 显著增加SP | ||||
| 1982-1999 | 67.69 | 1.45 | 11.45 | 69.02 | 0.34 | 5.25 | 85.97 | 0.45 | 19.93 | |||
| 1982-2000 | 66.81 | 3.07 | 12.67 | 68.50 | 0.39 | 5.81 | 86.35 | 0.45 | 20.63 | |||
| 1982-2001 | 66.79 | 3.15 | 12.62 | 68.41 | 0.41 | 5.87 | 87.71 | 0.38 | 21.39 | |||
| 1982-2002 | 66.06 | 3.11 | 12.55 | 71.35 | 0.36 | 7.09 | 87.75 | 0.36 | 21.95 | |||
| 1982-2003 | 70.06 | 2.84 | 14.28 | 72.31 | 0.33 | 7.70 | 87.78 | 0.33 | 22.19 | |||
| 1982-2004 | 71.06 | 2.91 | 14.80 | 73.52 | 0.30 | 7.86 | 88.58 | 0.32 | 23.08 | |||
| 1982-2005 | 71.83 | 3.00 | 16.14 | 75.24 | 0.30 | 9.56 | 87.34 | 0.27 | 21.08 | |||
| 1982-2006 | 71.87 | 3.02 | 17.31 | 74.89 | 0.32 | 9.44 | 87.62 | 0.27 | 22.17 | |||
| 1982-2007 | 73.17 | 2.87 | 18.17 | 74.91 | 0.33 | 10.07 | 87.88 | 0.25 | 23.52 | |||
| 1982-2008 | 74.99 | 2.37 | 20.52 | 76.38 | 0.30 | 10.26 | 87.30 | 0.26 | 23.87 | |||
| 1982-2009 | 74.05 | 2.19 | 19.36 | 77.74 | 0.29 | 12.13 | 88.13 | 0.23 | 24.39 | |||
| 1982-2010 | 74.16 | 1.93 | 19.41 | 75.44 | 0.30 | 10.99 | 87.34 | 0.26 | 23.09 | |||
| 1982-2011 | 75.82 | 1.34 | 20.41 | 74.67 | 0.31 | 11.70 | 87.59 | 0.25 | 23.11 | |||
| 1982-2012 | 74.83 | 1.33 | 20.62 | 78.10 | 0.24 | 12.62 | 88.57 | 0.18 | 23.47 | |||
The authors have declared that no competing interests exist.
| [1] |
|
| [2] |
|
| [3] |
|
| [4] |
|
| [5] |
|
| [6] |
|
| [7] |
[
|
| [8] |
[
|
| [9] |
|
| [10] |
|
| [11] |
|
| [12] |
|
| [13] |
|
| [14] |
|
| [15] |
[
|
| [16] |
|
| [17] |
|
| [18] |
|
| [19] |
[
|
| [20] |
|
| [21] |
|
| [22] |
|
| [23] |
|
| [24] |
|
| [25] |
|
| [26] |
|
| [27] |
|
| [28] |
|
| [29] |
|
| [30] |
[
|
| [31] |
[
|
| [32] |
[
|
| [33] |
|
| [34] |
|
| [35] |
[
|
| [36] |
|
| [37] |
[EB/OL].
|
| [38] |
|
| [39] |
|
| [40] |
[EB/OL].
|
| [41] |
|
| [42] |
|
| [43] |
|
| [44] |
|
| [45] |
|
| [46] |
|
| [47] |
|
/
| 〈 |
|
〉 |