
Journal of Geo-information Science >
Remote Sensing Monitoring and Dynamic Change of Urban Land Cover Structure of Main Urban Region in Wuhan
Received date: 2018-09-15
Request revised date: 2018-11-26
Online published: 2019-01-30
Supported by
The Strategic Priority Research Program of Chinese Academy of Sciences,No.XDA20010302
Innovation Projects of Graduate Education of Central China Normal University, No.2018CXZZ001
Copyright
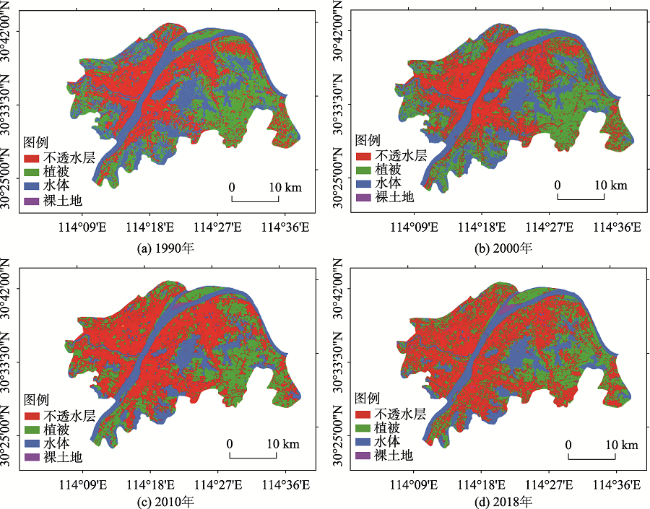
The land use structure and its spatio-temporal evolution characteristics within cities can not only reflect the level of urban economic development, but also predict the future development space and development potential of the city and even directly affect the suitability of the urban human settlement environment. There are significant differences in the internal land use structure of cities in different stages of development and different regions. In this paper, we used object-oriented multi-scale segmentation algorithm to carry out long-term remote sensing monitoring on the internal land cover structure of Wuhan main urban area based on the Landsat TM/OLI remote sensing images of 1990, 2000, 2010 and 2018. Then, the land use patterns in Wuhan were monitored, and the characteristics of land use structure changes during the 1990, 2000, 2010 and 2018 were further discussed. The research shows that: the internal land-use structure in the main urban area of Wuhan city is dominated by impervious surface, vegetation, and waterbody during the recent 28 years. The land use change pattern mainly reflects the transformation of vegetation and waterbody into impervious surface. From 1990 to 2018, impervious surface is the main type of land use in the study area, which increased from 329.73 km2 in 1990 to 466.69 km2 in 2018, which increased by 136.96 km2. The vegetation and waterbody area decreased from 332.74 km2, 318.26 km2 in 1990 to 320.46 km2, 196.39 km2 in 2018 respectively, which decreased by 12.28 km2 and 121.87 km2 respectively; bare land area is too small, and it's change is not as significant as the first three types of land changes. This study can provide reference for urban functional land mapping, urban land efficiency analysis and comprehensive evaluation of urban ecological environment quality.
CHEN Bin , WANG Hongzhi , XU Xinliang , CHEN Dechao , WU Xinmei , FU Yangyang . Remote Sensing Monitoring and Dynamic Change of Urban Land Cover Structure of Main Urban Region in Wuhan[J]. Journal of Geo-information Science, 2019 , 21(2) : 293 -303 . DOI: 10.12082/dqxxkx.2019.180470.
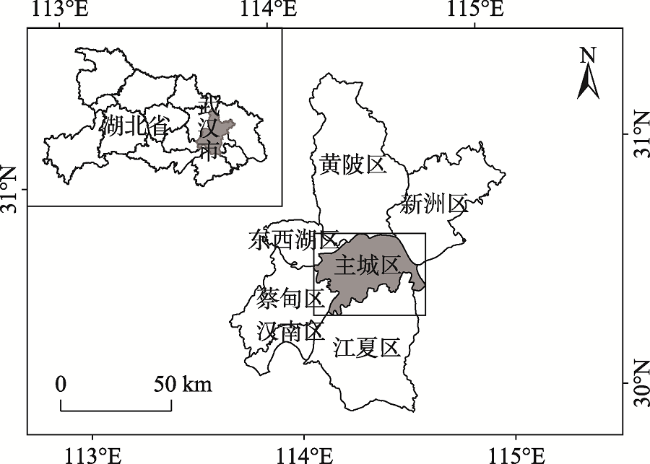
Fig. 1 Location of the study area图1 研究区范围 |
Tab. 1 The training sample of typical objects表1 典型地类训练样本 |
| 序号 | 地物类型 | 地物样本 | |||
|---|---|---|---|---|---|
| A | 不透水层 |  |  |  |  |
| B | 植 被 |  |  |  |  |
| C | 水 体 |  |  |  |  |
| D | 裸土地 |  |  |  |  |
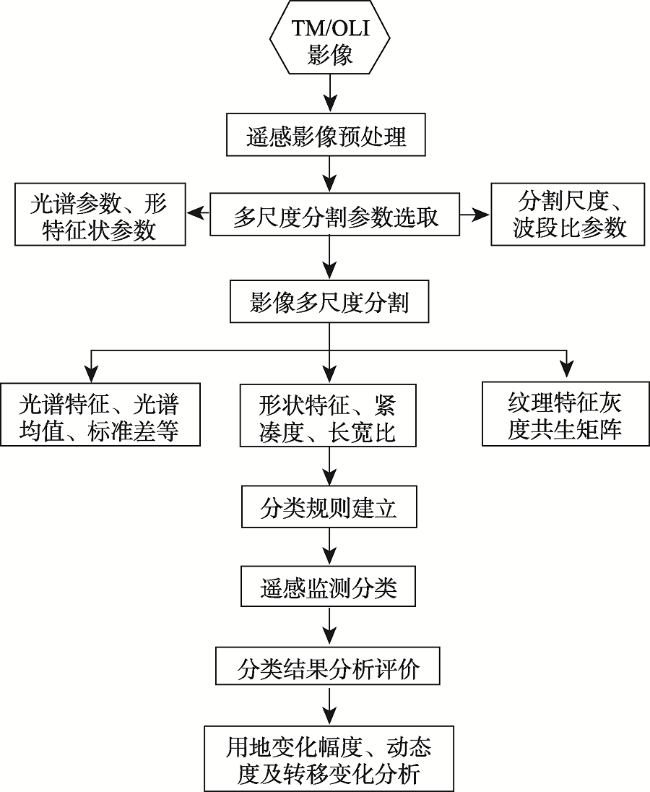
Fig. 2 The technology flow chart of algorithm classification图2 算法分类技术流程 |
Tab. 2 Accuracy evaluation of land use types in urban area of Wuhan from 1990 to 2018表2 1990-2018年武汉市主城区土地利用类型精度评价 |
| 年份 | 用户精度/% | 生产者精度/% | 总体精度/% | Kappa系数 | ||||||
|---|---|---|---|---|---|---|---|---|---|---|
| 不透水层 | 植被 | 水体 | 裸土地 | 不透水层 | 植被 | 水体 | 裸土地 | |||
| 1990 | 95.52 | 93.86 | 95.36 | 78.69 | 92.75 | 93.04 | 92.90 | 92.31 | 92.83 | 0.9012 |
| 2000 | 94.50 | 96.41 | 95.17 | 83.58 | 91.96 | 93.06 | 97.18 | 90.32 | 93.70 | 0.9138 |
| 2010 | 93.62 | 92.10 | 95.71 | 79.66 | 94.28 | 92.68 | 91.78 | 92.16 | 92.82 | 0.9011 |
| 2018 | 93.60 | 94.93 | 91.53 | 83.54 | 90.70 | 92.96 | 92.31 | 91.67 | 91.74 | 0.8882 |
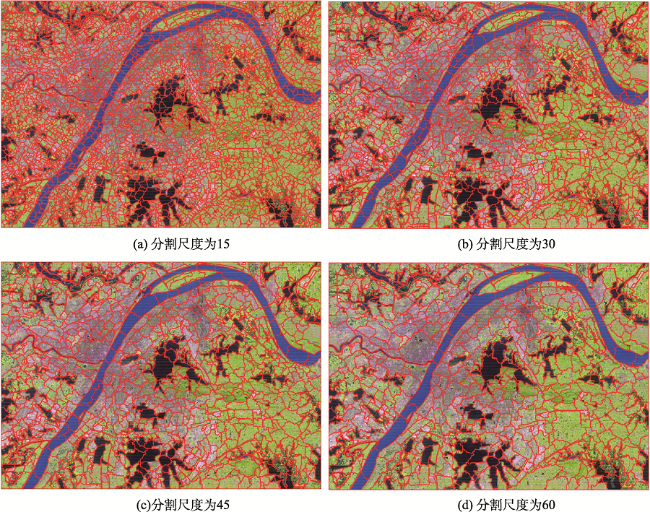
Fig. 3 The result of Multi-scale segmentation remote sensing images图3 遥感影像多尺度分割结果 |
Fig. 4 Spatial pattern of land cover in urban area of Wuhan from 1990 to 2018图4 1990-2018年武汉市主城区用地结构空间格局 |
Tab. 3 Area of land-use status and land-use change in Wuhan city from 1990 to 2018 (km2)表3 1990-2018年武汉市主城区内部土地利用现状及变化面积 |
| 用地类型 | 1990年 | 1990-2000年 | 2000年 | 2000-2010年 | 2010年 | 2010-2018年 | 2018年 | |||
|---|---|---|---|---|---|---|---|---|---|---|
| ΔU1 | K1 | ΔU2 | K2 | ΔU3 | K3 | |||||
| 不透水层 | 329.73 | 16.59 | 1.66 | 346.32 | 62.74 | 6.27 | 409.06 | 57.63 | 7.20 | 466.69 |
| 植被 | 332.74 | 25.98 | 2.60 | 358.72 | -13.53 | -1.35 | 345.19 | -24.73 | -3.09 | 320.46 |
| 水体 | 318.26 | -42.95 | -4.30 | 276.31 | -48.28 | -4.82 | 228.03 | -31.64 | -3.96 | 196.39 |
| 裸土地 | 7.16 | -0.62 | -0.06 | 6.54 | -0.93 | -0.09 | 5.61 | -1.26 | -0.16 | 4.35 |
注:ΔU1、ΔU2、ΔU3表示3个时间段各用地类型的总变化幅度;K1、K2、K3表示用地类型在3个时间段内的年变化幅度。 |
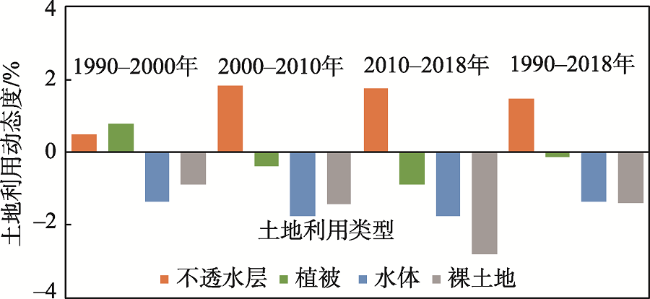
Fig. 5 Land-use dynamics degree of build up area of Wuhan from 1990 to 2018图5 1990-2018年武汉市主城区内部土地利用变动态度 |
Tab. 4 Area of land-use change in Wuhan city from 1990 to 2018(km2)表4 1990-2018年武汉市主城区用地类型转移矩阵 |
| 变化类型 | 1990-2000年 | 2000-2010年 | 2010-2018年 | 1990-2018年 |
|---|---|---|---|---|
| 不透水层→不透水层 | 250.14 | 257.96 | 333.04 | 242.26 |
| 植被→植被 | 236.50 | 221.14 | 205.12 | 171.63 |
| 水体→水体 | 226.17 | 167.32 | 161.33 | 166.63 |
| 不透水层→植被 | 72.77 | 79.16 | 99.88 | 87.43 |
| 水体→植被 | 61.50 | 57.32 | 6.68 | 58.23 |
| 植被→不透水层 | 59.37 | 138.75 | 127.96 | 142.64 |
| 植被→水体 | 36.65 | 9.62 | 23.92 | 19.97 |
| 水体→不透水层 | 30.63 | 49.17 | 8.05 | 85.31 |
Tab. 5 Area of probability land-use change in Wuhan city from 1990 to 2018(%)表5 1990-2018年武汉市主城区用地类型概率转移矩阵 |
| 变化类型 | 1990-2000年 | 2000-2010年 | 2010-2018年 | 1990-2018年 |
|---|---|---|---|---|
| 不透水层→不透水层 | 74.37 | 75.86 | 74.65 | 72.03 |
| 植被→植被 | 71.08 | 59.70 | 57.32 | 50.08 |
| 水体→水体 | 71.01 | 60.72 | 89.92 | 53.89 |
| 不透水层→植被 | 21.64 | 23.28 | 22.39 | 25.99 |
| 水体→植被 | 19.31 | 20.80 | 3.72 | 18.28 |
| 植被→不透水层 | 17.85 | 37.46 | 35.76 | 42.87 |
| 植被→水体 | 11.02 | 2.60 | 6.69 | 6.03 |
| 水体→不透水层 | 9.62 | 17.84 | 4.49 | 26.79 |
The authors have declared that no competing interests exist.
| [1] |
[
|
| [2] |
|
| [3] |
[
|
| [4] |
|
| [5] |
|
| [6] |
[
|
| [7] |
[
|
| [8] |
[
|
| [9] |
[
|
| [10] |
[
|
| [11] |
[
|
| [12] |
[
|
| [13] |
[
|
| [14] |
[
|
| [15] |
[
|
| [16] |
[
|
| [17] |
[
|
| [18] |
[
|
| [19] |
[
|
| [20] |
|
| [21] |
|
| [22] |
[
|
| [23] |
|
| [24] |
[
|
| [25] |
[
|
| [26] |
|
/
| 〈 |
|
〉 |