Spatio-temporal Pattern of Chinese Economy Development based on Nightlight Data

  • LI Xiang ,
  • ZHU Jiang , * ,
  • YIN Xiangdong
Expand
  • Guangzhou Urban Planning and Design Survey Research Institute, Guangzhou 510060, China
*Corresponding author: ZHU Jiang, E-mail:

Received date: 2018-11-08

  Request revised date: 2019-01-04

  Online published: 2019-03-15

Supported by

Youth Fund Sustentation Project of Guangzhou Urban Planning and Design Survey Research Institute, No.2018-60.

Copyright

《地球信息科学学报》编辑部 所有

Abstract

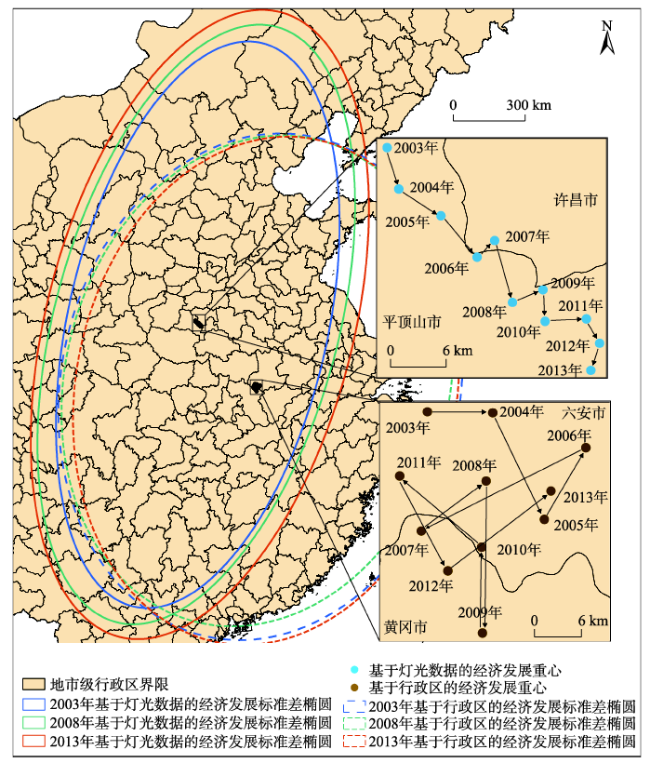
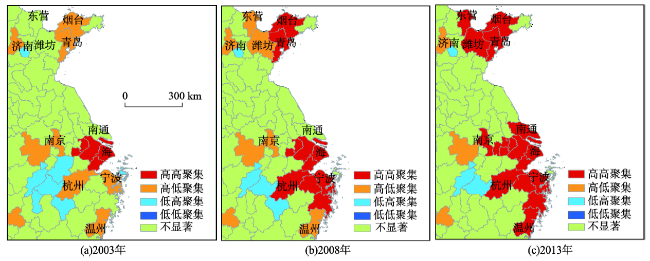
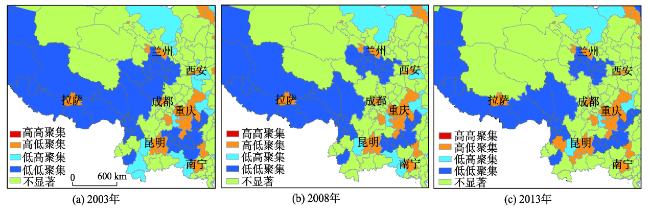
Knowledge on the spatio-temporal pattern of economy development can effectively help inform policy on economy. Most current studies on spatio-temporal pattern in economic development mainly rely on statistical data. However, these statistical data have disadvantages such as lacking of consistently statistical standard and low spatial resolution. These shortcomings prevent the use of statistical data to accurately describe the real pattern of economic development. Nightlight data covers the most surface on the earth, and it is available with free of charge. Moreover, the nightlight data is highly related to socio-economic activities, so it can be used as a proxy variable to study human activities. Based on the Defense Meteorological Satellite Program's Operational Linescan System (DMSP/OLS) nightlight data, three methods including gravity center, standard deviation ellipse, and local Moran'I were used in this study to explore the spatio-temporal pattern in Chinese economic development at different scales. The results showed that: (1) Chinese economic gravity center moved to the southeast from 2003 to 2013, but the moving distance was reduced year by year. These results indicated that there existed an economic gap between eastern region and inland region, but the gap was reduced gradually in these periods. The ellipse's extent of standard deviation in Chinese economy expanded, but its oblateness decreased from 2003 to 2013. This implies that the total volume of Chinese economy continued to rais, however, the spatial pattern became locally aggregated gradually. Besides, the direction angle of Chinese economy's standard deviation ellipse deflected to the east in these periods, which agrees with the result that the economic gravity center moved to the southeast. (2) High-high and low-low clustered areas were the two most obvious features of Chinese economy.

Cite this article

LI Xiang , ZHU Jiang , YIN Xiangdong . Spatio-temporal Pattern of Chinese Economy Development based on Nightlight Data[J]. Journal of Geo-information Science, 2019 , 21(3) : 417 -426 . DOI: 10.12082/dqxxkx.2019.180569

1 引言

自1978年改革开放以来,中国经济迅速发展,总体水平不断攀升。但是由于自然条件、政策等原因,区域之间存在较大发展差异[1]。根据刘夏明等[2]、滕召建[3]等的研究成果,2000年以来,中国各省的经济发展差距呈扩大趋势。实现区域协调发展是国民经济健康运行的重要条件,也是全面建成小康社会的重要基础[4]。过大的发展差异有悖于新发展理念,甚至威胁中国稳定有序的发展环境[5]。因此,全面系统地掌握经济发展的时空格局特征对于明确经济发展差异、合理制定宏观经济战略意义重大。
国内外学者对经济发展的时空格局进行了广泛的研究。Chung等[6]基于SES(Social Economic Status)方法和政府统计数据测度了1976-2010年香港各区之间的经济发展差异;Chirila等[7]研究了金融危机对欧盟各国经济发展差异的影响;刘夏明等[2]利用基尼系数考察了省级尺度上的中国地区经济发展差异[2];杨丰硕等[8]研究了江西省的地理因素对经济差异的影响。这些成果为进一步研究经济时空格局特征提供了思路和方法,但是以往研究主要利用GDP、人均收入等统计数据表征经济发展水平。统计数据存在口径不统一、可比价换算复杂等问题[9],而且统计数据一般为均质的面板数据,空间分辨率较低,难以表现行政区内部经济发展的空间异质性。因此,借助更客观、尺度更精细的数据有助于更全面地研究经济发展的时空格局特征。
夜间灯光数据能探测到地球表面发出的亮光,是研究人类活动的有效数据源[10]。DMSP/OLS数据是目前应用最广泛的夜间灯光数据之一[11],已被用于用人口估算[12]、用电量估算[13]、城市扩张监测[14]等方面的研究。夜间灯光数据可以通过亮度值高低反应社会经济水平的高低[15,16]。Marx等研究发现,DMSP/OLS夜间灯光数据的亮度值与GDP数据高度相关,利用DMSP/OLS夜间灯光数据能有效估算GDP[17]。因此,将DMSP/OLS夜间灯光数据作为经济发展的代理变量是合理的。以往利用夜间灯光数据对经济的研究主要侧重于对GDP[17]、贫困度[18]等指标的估算,或者研究灯光累计值对人口、GDP的统计数据的响应情况[1,4],较少涉及长时间序列的全国尺度经济发展格局的分析。
本文以中国大陆为研究区,研究时段为2003-2013年。首先对DMSP/OLS夜间灯光数据进行预处理,提高数据质量;然后利用重心、标准差椭圆和局部莫兰指数等空间分析工具从格网和地级行政区尺度探究2003-2013年中国经济发展时空格局特征,检验以往政策实施效果,提出了一套在格网尺度上测度经济发展时空格局的方法,为制定宏观经济发展战略提供参考依据。

2 数据源与研究方法

2.1 数据源

本文涉及数据包括3类:矢量数据、栅格数据和统计数据。数据具体参数如表1所示。
Tab. 1 Main parameters of data source

表1 数据主要参数

数据类型 数据名称 数据来源 比例尺/分辨率 数据时间
矢量数据 地市级行政区划 国家基础地理信息中心 1:400万 2017年
栅格数据 DMSP/OLS夜间灯光数据 美国国家海洋和大气管理局 1 km 2003-2013年
MODIS数据 美国国家航空航天局
统计数据 地区生产总值(GDP) 各省市统计年鉴 - 2003-2013年
(1)矢量数据:中国地市级行政区划数据[19],用于裁剪栅格数据和计算以行政区为单位的经济重心和标准差椭圆。
(2)栅格数据:包含DMSP/OLS夜间灯光数据[20]和MODIS数据[21]。DMSP/OLS夜间灯光数据作为经济水平的代理变量,用于计算格网尺度的经济重心、标准差椭圆以及统计每个地市级区划的灯光值。MODIS数据中包含EVI数据和MOD13A3数据产品。EVI数据用以缓解DMSP/OLS夜间灯光数据的亮度饱和现象,MOD13A3数据产品包含土地利用分类数据,用于提取建设用地上的灯光数据。
(3)统计数据:各地市级区划的国内生产总值(GDP)[5],与地市级行政区划数据结合计算以行政区为单位的经济重心和标准差椭圆。

2.2 数据预处理

由于传感器性能的原因,DMSP/OLS夜间灯光数据存在灯光值不连续、亮度饱和的缺点[22],这些缺点会影响数据可靠性。本文数据预处理主要是对DMSP/OLS夜间灯光数据进行不连续性矫正与去饱和处理。进行预处理前对矢量数据和栅格数据定义投影,然后按照1 km×1 km的格网大小对栅格数据重采样。
2.2.1 DMSP/OLS夜间灯光数据不连续性矫正
不连续性矫正的目的是为了缓解卫星传感器本身及偶然误差的影响,使DMSP/OLS夜间灯光数据DN值的累计值随时间呈增长趋势[23]。根据曹子阳等[20]的研究,不连续性矫正分为2步:
(1)年间校正。对同一年存在两幅影像的情况,计算两幅影像的平均值作为该年份的影像。
(2)年际校正。一个地区的灯光亮度是逐年增加的,一般不会骤增也不会骤减(除非遭遇战争、特大自然灾害),尤其对于中国这样发展较快的国家[20]。因此规定后一年的DMSP/OLS夜间灯光数据的DN值,不小于前一年同位置上的DN值,如式(1)所示。
DN (n , i) = 0 DN ( n - 1 , i ) DN ( n , i ) DN ( n + 1 , i ) = 0 DN ( n + 1 , i ) > 0 DN ( n - 1 , i ) > DN ( n , i ) 其他 (1)
式中:DN(n-1, i),DN(n, i),DN(n+1, i)分别代表第n-1年、第n年和第n+1年经过年间校正的影像第 i 个像元的DN值。
图1图2展示了不连续性校正前后DMSP/OLS夜间灯光数据DN值累计值随时间的对比。从图1可以看出同一年由不同卫星获取的夜间灯光数据差别很大,且DN值累计值随时间波动很大,这种缺点极大地影响了DMSP/OLS夜间灯光数据的质量。经过处理后,DMSP/OLS夜间灯光数据的DN值累计值随时间呈上升趋势,不连续性得到有效校正。
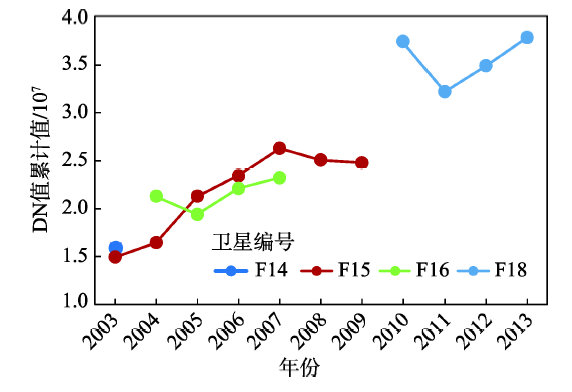
Fig. 1 Accumulated values of DN value in DMSP/OLS nightlight data before discontinuity correction

图1 不连续性校正前DMSP/OLS夜间灯光数据DN值累计值

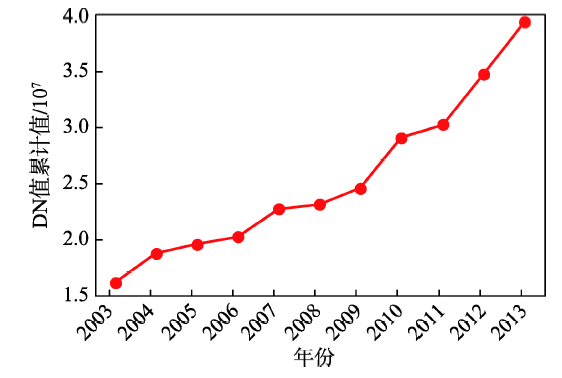
Fig. 2 Accumulated values of DN value in DMSP/OLS nightlight data after discontinuity correction

图2 不连续性校正后DMSP/OLS夜间灯光数据DN值累计值

2.2.2 DMSP/OLS夜间灯光数据去饱和处理
根据Zhang等[24]的研究,同一位置的空间单元的灯光值与植被指数呈负相关。目前对DMSP/OLS夜间灯光数据进行去饱和处理的方法主要基于这一研究成果,如差值去饱和指数(Difference Index, DI)[13],如式(2)所示;归一化去饱和指数(Normalized Difference Index, NDI)[13],如式(3)所示;改进型去饱和指数(Enhanced Index, EI)[22],如式(4)所示。本文将几种方法的去饱和效果做比较,选出最优方法。归一化植被指数(Normalized Difference Vegetation Index, NDVI)和增强型植被指数(Enhanced Vegetation Index, EVI)是最常用的2种植被指数数据。NDVI和EVI相比,在植被覆盖度较高地区易出现指数饱和现象[25],影响去饱和效果,因此本文选择EVI数据进行去饱和处理。
DI = NL D n - VI (2)
NDI = NL D n - VI NL D n + VI (3)
EI = 1 + NL D n - VI 1 - ( NL D n - VI ) (4)
式中:NLDn代表夜间灯光数据的归一化值,VI代表植被指数。
以2013年DMSP/OLS夜间灯光数据为例,选择北京、长沙、昆明、汉中4个发展水平不同、区位不同的城市表现3种方法去饱和效果的差异。由图3可以看出,原始DMSP/OLS夜间灯光数据存在严重的亮度饱和问题,且亮度范围远超过城市的建成区范围。比较3种方法的结果发现,改进型去饱和指数能最有效地降低亮度饱和缺点,更加清晰地刻画城市内部空间结构。因此,本文选择改进型去饱和指数对2003-2013年的DMSP/OLS夜间灯光数据进行去饱和处理。
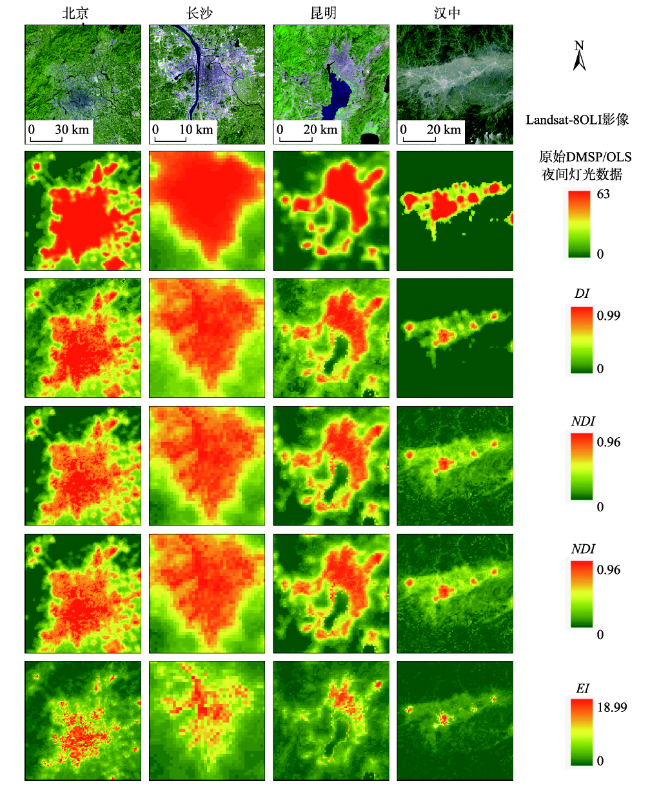
Fig. 3 Comparison of desaturation effect of different methods in DMSP/OLS nightlight data

图3 不同方法对DMSP/OLS夜间灯光数据的去饱和效果比较

2.2.3 建设用地上夜间灯光数据提取
根据以往研究,DMSP/OLS夜间灯光数据中存在大量噪声亮光(主要是地表反射的月光),这些亮光与人类活动无关,分布范围广,会严重干扰对社会经济活动的研究[26]。与人类活动有关的夜间灯光一般分布在特定的土地利用类型上,主要是建设用地[27]。利用MOD13A3数据产品中的建设用地分类结果提取建设用地上的DMSP/OLS夜间灯光数据。
以2013年为例,比较各市全域灯光和建设用地上灯光累计值与GDP的相关性,发现建设用地上灯光数据的DN值累计值与GDP相关性更高,如图4所示,说明提取建设用地上的灯光数据能有效过滤噪声亮度的影响,提高灯光数据与经济的关联度。
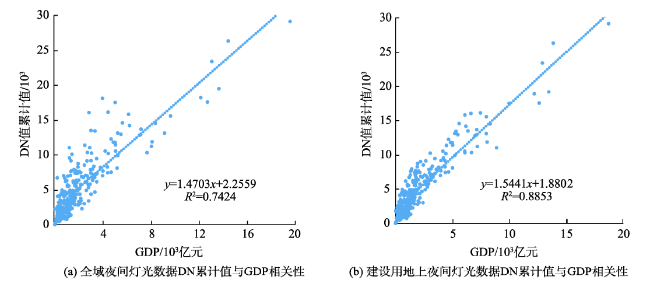
Fig. 4 Comparison of the relevance of DN accumulated values with GDP between nightlight data of whole extent and construction land

图4 全域灯光数据和建设用地上灯光数据的DN值累计值与GDP相关性比较

2.3 经济发展方向特征度量

和统计数据相比,夜间灯光数据可以看作一种连续的点数据。重心和标准差椭圆是点数据中常用的反映方向特征的模型,可以反映出地理要素的平均中心和主导方向等特点[28]。因此,本文选择重心和标准差椭圆表征经济发展的方向特征。
(1) 重心计算方法
重心的概念源自物理学,也称平均中心。通过计算重心及其迁移轨迹,可以明确经济发展的空间差异以及动态变化特征[27]。计算如式(5)所示。
x t ¯ = i = 1 n I ti X ti i = 1 n I t i ; y t ¯ = i = 1 n I ti Y ti i = 1 n I ti (5)
式中: x t ¯ y t ¯ 分别为第t年经济重心的横坐标和纵坐标; I ti ¯ 表示第t年第i个格网单元的灯光值; X ti ¯ Y ti ¯ 分别为第t年第i个格网单元的横坐标和纵坐标。
(2) 标准差椭圆计算方法
地理要素的重心也是其标准差椭圆的中心。标准差椭圆通过长短轴、方向角、扁率等参数定量描述地理要素的空间分布状况[29]。长短轴表现地理要素的分布范围;方向角为长轴与正北方向顺时针的夹角,表现地理要素分布方向;长轴和短轴的比值为扁率,扁率越大,表明数据分布越集聚,反之越分散。标准差椭圆计算方法如式(6)所示[29]
SD E x = i = 1 n x ˜ i 2 n , SD E y = i = 1 n y ˜ i 2 n (6)
式中:SDExSDEy分别表示标准差椭圆x轴和y轴方向上的轴长; x ˜ i = X ti ¯ - x t ¯ , y ˜ i = Y ti ¯ - y t ¯ ; X ti ¯ Y ti ¯ 分别为第t年第i个格网单元的横坐标和纵坐标; x t ¯ y t ¯ 表示第t年重心的横、纵坐标。

2.4 经济发展空间集聚性度量

受空间相互作用影响,相邻城市的经济发展在空间分布上可能存在关联,这种关联表现为空间集聚性[30]。局部莫兰指数是常用的空间集聚性度量方法[19]。局部莫兰指数计算方法[19]如式(7)所示,计算结果分为5种类型:高高集聚,表示对象自身和相邻对象均为高值;高低集聚,表示对象自身为高值,相邻对象为低值;低高集聚,表示对象自身为低值,相邻对象为高值;低低集聚,表示对象自身和相邻对象均为低值;不显著,表示对象自身和相邻对象差别不大。
$LI_{i}=\frac{X_{i}-\bar{X}}{m}\sum_{j}W_{ij}(X_{j}-\bar{X})$其中$m=\sum_{j}W_{ij}\frac{X_{j}-\bar{X}}{n}$(7)
式中:LIi表示第i个城市的局部莫兰指数的值;Xi表示第i城市灯光数据DN值累计值;$\bar{x}$表示所有城市灯光数据DN值累计值平均值;Xj表示除第i个以外的其他城市灯光数据DN值累计值;Wij为空间邻接矩阵;n代表城市总个数。

3 结果及分析

3.1 中国经济发展方向特征分析

根据2.3节的方法,分别基于夜间灯光数据和统计数据计算得到各年份的格网尺度和行政区尺度的经济重心和标准差椭圆,如图5所示。从图5可以看出,利用地级行政区的GDP统计数据计算得到的经济重心迁移轨迹无明显方向特征。主要原因有两点:①地级行政单位个数只有349个,存在样本数量偏少的缺点;②以行政区为单位计算时,认为行政区内的GDP分布是均质的,忽略了GDP分布的空间异质性。
Fig. 5 Migration of the gravity center and standard deviation ellipse of Chinese economy development based on nightlight data and statistical data

图5 基于夜间灯光数据和统计数据的中国经济重心迁移和标准差椭圆

利用夜间灯光数据能有效克服样本数量少、空间分辨率低的缺点,更加真实地反映中国经济重心的变迁。从重心移动过程来看,2003-2013年基于夜间灯光数据的经济重心大体朝东南方向移动,重心位移32.5 km,说明东部地区的经济体量高于内陆地区。经济发展受历史、自然、交通和政策等多种因素影响,改革开放以来,东部地区凭借相对较好的经济基础与政策优势迅速发展,与内陆地区拉开差距。经过几十年发展,东部地区的优势持续巩固,中国区域经济发展差异短期内不会彻底消除[2]
进一步分析发现,2003-2013年经济重心每年移动距离呈逐年减小的趋势,有明显的“刹车效应”。主要原因包括政策扶持、资金支持和基础设施建设等方面。政策扶持方面,国家提出并实施“振兴东北”、“中部崛起”、“西部大开发”等战略,特别是实施“西部大开发”战略实施以来,国家通过规划指导、项目安排等方式加大了对西部地区的扶持力度,“西气东输”、“西电东输”等国家级重大项目盘活了中西部地区的资源禀赋,为中西部经济增长提供了重要支点。同时,重庆两江新区、甘肃兰州新区等国家级新区的设立为中西部经济发展提供科学实验区。随着“一带一路”等国家级倡议的提出,胡焕庸线以西地区被推向开放前沿,可以预见,中西部地区的资源红利和区位红利将被持续激活,西部地区经济发展空间将被继续拉开,吸引人流、物流的不断进入。资金支持方面,中央财政对西部地区转移支付从2000年的1089亿元增加到2008年的7933亿元,累计达30 338亿元,占中央对地方转移支付总额的43.6%[9],资金支持不仅对维持西部地区社会经济正常运行起到关键作用,而且对刺激生产、扩大消费市场有重要意义。基础设施建设方面,青藏铁路、兰新铁路等重大基础设施的投入使用加强了西部地区与东部地区联系,同时促进了西部地区各项资源的流动,为西部地区经济长效增长构建了稳定的交通框架。2005年以来,中西部地区经济增长迅速,特别是西部地区,GDP增长速度保持在9%以上[3],中西部地区经济增长迅猛,使得中国区域经济发展差异有所缓解,经济重心向东南方向移动的距离也逐渐减小。以往研究主要基于省级或市级尺度的经济统计数据测度中国经济发展的空间差异,研究结论大多为中国区域经济差异呈逐渐扩大趋势。然而统计数据存在口径不统一,可比价换算复杂,难以反映行政区内部经济发展空间异质性等缺点,无法从精细尺度准确探究中国经济发展的时空格局。本研究融合公里格网尺度的夜间灯光数据,一定程度上避免了上述数据的缺陷,使研究结果更贴合实际。
从标准差椭圆角度来看,利用统计数据计算的各年份椭圆高度重合,无法准确揭示中国经济发展空间特征(表1)。基于夜间灯光数据计算的经济标准差椭圆更加瘦长,长轴为南北向,长度由2003年的2414 km增加到2013年的2701 km,短轴为东西向,长度由2003年的622 km增加到2013年的 740 km。长短轴长度的增加使经济标准差椭圆面积不断扩大,由2003年的2 057 585 km2扩大到2013年的2 713 679 km2,主要原因是中国经济不断发展,在灯光数据上表现为空间单元的DN值普遍增大,亮区范围变广,因此需要更大的椭圆范围来囊括新增的亮区。中国经济标准差椭圆的方向角由2003年的18.65°变为2013年的20.04°,不断向东偏转,与前文经济重心朝东南方向移动的结果吻合。虽然经济标准差椭圆范围不断变大,但是椭圆扁率从2003年的3.87变为2013年的3.64,呈减小趋势,说明从中国经济逐渐呈现局部聚集、多点开花的特点,总体集聚度有所下降。

3.2 中国经济发展空间集聚性分析

本文利用地级行政区内的灯光累计值作为该行政区经济发展的代理变量,能避免部分地区统计数据不全、统计口径不统一的问题。利用局部莫兰指数表征中国经济发展的空间集聚性,选择2003年、2008年和2013年3个时间节点进行展示,表现中国经济发展空间集聚性的变化,如图6图7所示。
Fig. 6 Change of spatial aggregation of Shandong Peninsula and Yangzi River Delta's economy development from 2003 to 2013

图6 2003-2013年山东半岛及长三角地区经济发展空间集聚性变化

Fig. 7 Change of spatial aggregation of western region's economy development from 2003 to 2013

图7 2003-2013年西部地区经济发展空间集聚性变化

高高集聚的城市只分布在环渤海、长江三角洲、珠江三角洲等地区,而且区域范围和相应城市群范围基本吻合。2003-2013年,山东半岛和长江三角洲地区的高高集聚区域表现出了最明显的辐射和带动作用。2003年山东半岛只有济南、青岛等地为高低集聚,长江三角洲只有上海、苏州等地为高高集聚,到2013年,山东半岛形成了以济南和青岛为核心,包含烟台、东营和潍坊等地的高高集聚区域,长江三角洲形成了以上海、南京和杭州为核心的包含苏州、无锡、宁波等地的泛长江三角洲高高集聚区域。环渤海和珠江三角洲的高高集聚范围从2003年开始基本无变化,说明这两个高高集聚区域对周边城市的辐射作用较弱。高低集聚一般为区域重点城市,这些城市相对周边城市有着更好的发展环境,对人口、资源的吸引力更大,经济增长相对较快。值得注意的是,山东半岛和长江三角洲一些高低集聚的城市随着时间的推移发生了转变,变成高高集聚类型,而中西部高低集聚城市由于自然和交通等原因对周边区域的带动作用不足,难以完成这样的转变。低高集聚主要分布在内蒙古和贵州、云南等地,且2003-2013年变化不大,主要为欠发达城市。低低集聚范围在2003-2013年有所减少,这与前文的经济重心移动距离减小的结论一致。2003年低低集聚主要分布在西藏、甘肃、青海、贵州和东北等地,为连片状分布。随着经济不断发展,部分城市脱离低低聚集区,到2013年,西藏、青海和贵州等地的低低聚集区范围有所减少,但东北的低低聚集区范围有所增多。
Tab. 2 Main parameters of Chinese economy’s standard deviation ellipse based on nightlight data of different years

表2 各年份基于夜间灯光数据计算的中国经济标准差椭圆的主要参数

年份 长轴长度/km 短轴长度/km 椭圆面积/km2 方向角/° 扁率
2003 2414 622 2 057 585 18.65 3.87
2008 2563 682 2 396 771 19.62 3.75
2013 2701 740 2 713 679 20.04 3.64

4 结论与讨论

本文首先对DMSP/OLS夜间灯光数据进行预处理,提高数据质量,然后以夜间灯光数据作为经济发展代理变量,利用重心、标准差椭圆和局部莫兰指数等工具从格网尺度和行政区尺度探究了2003-2013年中国经济发展的方向特征与空间集聚特征,弥补了以往只用统计数据的样本数量偏少、空间分辨率低等缺点,主要结论如下:
(1)利用统计数据计算重心和标准差椭圆无法准确地揭示中国经济发展的时空格局特征。2003-2013年,基于夜间灯光数据计算的中国经济重心不断向东南方向移动,但是移动距离大致呈逐年减小的趋势,说明中国东部地区和内陆地区经济体量仍然存在差距,但是差距逐渐减小。基于夜间灯光数据计算的经济标准差椭圆范围不断扩大但是扁率逐渐减小,表明中国经济总量不断增加,但是区域集聚性更加突出,整体聚集度有所下降。
(2)研究时段内,高高集聚分布在长江三角洲、珠江三角洲等经济发达地区,且山东半岛和长江三角洲的高高集聚区域对周边城市有最明显的带动作用。高低集聚主要是区域重点城市。低高集聚区域主要是中西部欠发达城市。低低集聚主要位于西藏、青海、贵州、东北等地区,研究时段内低低集聚区域范围有所减少,分布特点由连片状变为局部聚集。
DMSP/OLS夜间灯光数据为研究人类活动提供了新的数据源,但是其数据质量不高,应用之前需要进行复杂的预处理,且数据存档只有1992-2013年。和DMSP/OLS夜间灯光数据相比,NPP/VIIRS(National Polar-orbiting Partnership, Visible Infrared Imaging Radiometer Suite)夜间灯光数据、珞珈一号数据等新一代夜间灯光数据在空间分辨率、时间分辨率和光谱分辨率上有明显提升,更加适合用于研究人类经济社会活动。另外,由于夜间灯光数据几乎覆盖全球范围,后续可以利用它在洲际甚至全球尺度上探索人类社会经济活动的特征和规律。

The authors have declared that no competing interests exist.

[1]
周玉科,高锡章,倪希亮.利用夜间灯光数据分析我国社会经济发展的区域不均衡特征[J].遥感技术与应用,2017,32(6):1107-1113.夜间灯光遥感数据与人口和经济变量具有较好的相关性,已经广泛用于研究城市扩张和人类社会经济活动。采用VIIRS灯光数据定量化地分析了我国30个省(直辖市)的灯光辐射值对GDP、人口统计数据的响应情况。利用线性回归方法从地级市和省级两个尺度分析了灯光、GDP和人口的相关性。研究发现灯光辐射值与GDP、人口在多个空间尺度均存在显著的正相关性。采用经济学研究中常用的基尼(Gini)系数和不对称洛伦兹(Lasym)系数,从地级市和县级尺度上计算各省灯光、GDP和人口对应的得分值,探索各省社会经济不均衡情况。结果表明:各省在县级尺度上的不均衡比地级市尺度上严重;人口加权的灯光不均衡系数表明我国西部不发达地区的社会经济不均衡情况比东部发达地区严重。灯光Lasym系数表明不均衡状况比较严重的省份主要是由个别比较发达的区域引起。研究结果表明:基于灯光数据探索社会经济发展不均衡情况,可以从不同空间尺度分析问题,弥补了常规统计数据时间和空间不连续的问题。

DOI

[ Zhou Y K, Gao X Z, Ni X L.Analyzing regional inequality of socioeconomic development in China with night light[J]. Remote Sensing Technology and Application, 2017,32(6):1107-1113. ]

[2]
刘夏明,魏英琪,李国平.收敛还是发散?——中国区域经济发展争论[J].经济研究,2004(7):70-81.

[ Liu M X, Wei Y Q, Li G P.Convergence or divergence?——Debate on China's regional development[J]. Economic Research Journal, 2004(7):70-81. ]

[3]
滕召建. 中国省域经济发展的空间计量分析[D].昆明:云南财经大学,2017.

[ Teng Z J.Chinese economy development spatial econometric analysis at provincial scale[D]. Kunming: Yunnan University of Finance and Economics,2017. ]

[4]
刘华军,杜广杰.中国经济发展的地区差距与随机收敛检验——基于2000-2013年DMSP/OLS夜间灯光数据[J].数量经济技术经济研究,2017,34(10):43-59.研究目标:测度中国经济发展地区差距并识别随机收敛俱乐部。研究方法:基于DMSP/OLS夜间灯光数据,利用Dagum基尼系数及分解方法测度中国经济发展的空间非均衡程度,并通过面板单位根检验对地区内经济发展收敛俱乐部进行识别。研究发现:中国总体地区差距主要来源于地区间差距,而不同地区间交叉重叠的影响极小。东部地区的河北、江苏、浙江、福建等省份,中部地区的河南、湖北、湖南等省份,西部地区的广西、重庆、四川、贵州等省份,它们的经济发展存在向局部均值随机收敛的趋势。研究创新:基于夜间灯光数据重新审视了中国经济发展的地区差距与随机收敛特征。研究价值:揭示出中国总体地区差距的主要来源,并进一步识别出各地区内经济发展收敛俱乐部。

[ Liu H J, Du G J.Regional inequality and stochastic convergence in China[J]. The Journal of Quantitative & Technical Economics, 2017,34(10):43-59. ]

[5]
任启龙,王利,李会.中国区域经济发展空间差异性分析[J].地理与地理信息科学,2017,33(1):110-116.选择中国大陆31个省级行政区,以国家5年规划期末年份为时间节点,从经济发展实力、经济发展水平两方面优化指标体系,并采用基于主成分的综合加权法计算了中国2000年以来省域之间的经济发展差异。结果表明:1)各省域间经济实力差距逐渐缩小,经济实力的提升表现为由东部沿海逐渐向内陆扩展;2)研究期内各省的经济水平虽均有较高幅度的提升,但东强西弱对比格局基本未变,沿海省份优势明显;3)中国经济重心逐渐北移,经济活力向东南沿海和长江中下游省份集聚。采用泰尔指数对中国三大地带和六大区域的区间差异和区内差异进行分析,发现区间经济趋向均衡,区内经济向优势区域集中。最后,利用地理加权回归(GWR)模型分析了中国经济发展的影响因素,得出消费是所选因素中最重要的经济影响因素。

DOI

[ Ren Q L, Wang L, Li H.Analysis on spatial disparities of regional economic development in China[J]. Geography and Geo-information Science, 2017,33(1):110-116. ]

[6]
Chung R Y, Lai F T, Chung G K, et al.Socioeconomic disparity in mortality risks widened across generations during rapid economic development in Hong Kong: An age-period-cohort analysis from 1976 to 2010[J]. Annals of Epidemiology, 2018,28(11):743-752.The share of health benefits brought by economic growth was notably unequal by SES with greater benefits for those of higher SES. More attention should be paid to post-war baby-boomers of lower SES.

DOI

[7]
Chirila V, Chirila C.The impact of economic and financial crisis on the regional disparities in romania and European Union[J]. Procedia-Social and Behavioral Sciences, 2014,109:502-506.The reduction of economic disparities represents one of the priorities of the European Union. This is the reason why we aim to study the evolution of disparities both at national level among the economic development regions of Romania and at the level of the European Union, by taking into consideration all the member countries. In order to study the disparities among the economic development regions of Romania, we took into account the following variables: the available income of private households, the rate of occupied population, the human resources in sciences and technology (as a percentage of the occupied population), the life expectancy at birth, the gross domestic product and the unemployment rate. For the study we used the method of multivariate data analysis, the analysis of main components by taking into consideration the variables used and recorded at the end of the year 2006, in the moment of Romania's adherence to the European Union and at the end of the year 2009.

DOI

[8]
杨丰硕,杨晓梅,王志华,等.江西省典型县域经济差异影响因子地理探测研究[J].地球信息科学学报,2018,20(1):79-88.地理环境因子对区域经济差异的影响一直是国内外学者关注的重点及热点问题,探究各因子对区域经济差异的影响力,科学揭示各因子的作用机制,将为区域经济发展战略的制定提供重要指导依据.本文利用多元回归和地理探测器等方法,综合探测了地形、地貌、土地利用、交通区位等因子对江西典型贫困县及富裕县县域经济差异的影响,深入对比分析了各因子的影响力、交互作用及指示作用,总结主导影响因子及其在2类县域的演变趋势,提出分类精准施策的建议,进一步深化了对该问题的研究.结果表明:①所选的9个地理环境因子均对贫困县及富裕县县域经济产生影响,不同类型县域的主导影响因子及不同因子对同一类型县域的影响力均存在差异;②从主导影响因子来看,贫困县主要受自然条件、地理区位的影响,而富裕县主要受资源丰度、交通区位的影响;③对比2种县域经济差异的显著影响因子,发现由贫困地区到富裕地区主导影响因素逐步由自然禀赋等不可控因素向交通、技术等可控因素变化;④经济发展过程中,应根据区域经济主导影响因子因地制宜,分类精准施策.同时,利用影响因子的强交互作用性,注重对该类因子的改善,对促进经济发展可起到事半功倍的效果.

DOI

[ Yang F S, Yang X M, Wang Z H, et al.Geographic detection of impact factors of economic differences among typical counties in Jiangxi province[J]. Journal of Geo-information Science, 2018,20(1):79-88. ]

[9]
徐康宁,陈丰龙,刘修岩.中国经济增长的真实性:基于全球夜间灯光数据的检验[J].经济研究,2015,50(9):17-29.

[ Xu K N, Chen F L, Liu X Y.The truth of China economic growth: Evidence from global night-time light data[J]. Economic Research Journal, 2015,50(9):17-29. ]

[10]
Elvidge C, Cinzano P, Pettit D, et al.The night-sat mission concept[J]. International Journal of Remote Sensing, 2007,28(12):2645-2670.

DOI

[11]
Wu J, Wang Z, Li W F, et al.Exploring factors affecting the relationship between light consumption and GDP based on DMSP/OLS nighttime satellite imagery[J]. Remote Sensing of Environment, 2013,134:111-119.We consider night light as a type of consumer goods and propose a model for factors affecting the relationship between night lights and GDP. It is then decomposed into agricultural and non-agricultural productions. Further, the model is modified to determine how the factors affect residents' propensity to consume lights. Models are tested with time-fixed regression on a set of 15-year panel data of 169 countries globally and regionally. We find that light consumption propensity is affected by GDP per capita, latitude, spatial distribution of human activities and gross saving rate, and that light consumption per capita has an inverted-U relationship with GDP per capita. (c) 2013 Elsevier Inc. All rights reserved.

DOI

[12]
李翔,陈振杰,吴洁璇,等.基于夜间灯光数据和空间回归模型的城市常住人口格网化方法研究[J].地球信息科学学报,2017,19(10):1298-1305.精确掌握常住人口的数量和分布特征有助于明确社会发展情况、提高人口管理能力。目前人口数据主要以行政区为单元统计,难以表现城市内部的人口分布特征。然而,在城市中,受道路、公共服务设施、城市亮化灯光的影响,利用夜间灯光数据对人口回归,精度降低。如何提高城市常住人口回归结果的精度,值得深入研究。上海是中国的国家中心城市之一,在快速城镇化进程中上海面临巨大人口压力。因此,本文以上海市为研究区,以NPP-VIIRS(National Polar-orbiting Partnership Visible Infrared Imaging Radiometer Suite)夜间灯光数据、乡镇级常住人口统计数据为基础,提取商业和居住区的灯光数据来缓解交通、城市亮化区的影响,提高灯光累计值与常住人口数的相关性(相关系数从0.7032提高至0.8026)。然后,本文用空间回归模型对上海市2013年常住人口进行回归,相对误差为10.57%,并对回归结果进行分乡(镇、街道)修正。实验结果表明,使用空间回归模型对常住人口回归可以取得较高的精度,且格网化结果能够弥补传统统计数据空间分辨率低的缺点,更加详细地刻画常住人口的圈层特征与真实分布情况。

DOI

[ Li X, Chen Z J, Wu J X, et al.Gridding methods of city permanent population based on night light data and spatial regression models[J]. Journal of Geo-information Science, 2017,19(10):1298-1305. ]

[13]
潘竟虎,李俊峰.基于夜间灯光影像的中国电力消耗量估算及时空动态[J].地理研究,2016,35(4):627-638.提出夜间灯光降饱和指数模型,以中国大陆为研究对象,基于DMSP/OLS夜间灯光数据、MODIS NDVI产品、基础地理信息数据及社会经济统计数据,构建电力消耗估算模型,定量估算了2000-2012年电力消耗量,并采用空间统计分析方法,从不同时间、空间角度对省级、地级和县级单元的电力消耗量变化趋势和空间集聚程度进行分析.结果表明:夜间灯光降饱和指数模型能较好地降低夜间灯光的数据饱和和溢出,其中MDNVI模型的效果最好.从县级尺度电力消耗变化趋势的显著性来看,无明显变化区域主要出现在青藏高原,迅猛增长型多数分布在京津冀、长三角、珠三角和中东部省会城市.

DOI

[ Pan J H, Li J F.Estimate and spatio-temporal dynamics of electricity consumption in China based on DMSP/OLS images[J], Geographical Research, 2016,35(4):627-638. ]

[14]
杨任飞,罗红霞,周盛,等.夜间灯光数据驱动的成渝城市群空间形成过程重建及分析[J].地球信息科学学报,2017,19(5):653-661.2016年4月发布的《成渝城市群发展规划》首次正式确定了成渝城市群的内涵和具体边界,重建成渝城市群的形成过程,有利于把握未来发展趋势,并合理优化与调整其发展过程。在重建技术方面,对DMSP/OLS夜间灯光数据传统的不变目标区域校正法加以改进,将成渝城市群2013年城市市区范围内的全部像元加入校正模型的拟合中,设计了统计数据的校正规则,再通过二分比较法较好地恢复了成渝城市群内各城市建成区的时序空间信息。提取面积与统计面积总体平均相对误差为-0.38%,利用高分辨率Google Earth图像验证的建成区提取准确率达到98.29%,相比其他研究结果,经方法改进后的提取结果精度高且稳定。在结果分析方面,基于提取结果展开对城市群建成区重心转移过程与城市聚合过程的深层次研究,剖析了城市群的内部格局与时空变化特征。分析表明,成渝城市群的聚合情况与《成渝城市群发展规划》高度吻合,城市群已进入快速发育阶段,随着区域差异的持续扩大,成都、重庆都市圈的核心地位逐渐形成,而重庆的发展态势稍好。

[ Yang R F, Luo H X, Zhou S, et al.Restoring and analyzing the space forming process of Chengdu-Chongqing urban agglomeration by using DMSP/OLS night-time light data[J]. Journal of Geo-information Science, 2017,19(5):653-661. ]

[15]
Zhao M, Cheng W, Zhou C H, et al.GDP spatialization and economic differences in South China based on NPP-VIIRS nighttime light imagery[J]. Remote Sensing, 2017,9(7):673-688.Accurate data on gross domestic product (GDP) at pixel level are needed to understand the dynamics of regional economies. GDP spatialization is the basis of quantitative analysis on economic diversities of different administrative divisions and areas with different natural or humanistic attributes. Data from the Visible Infrared Imaging Radiometer Suite (VIIRS), carried by the Suomi National Polar-orbiting Partnership (NPP) satellite, are capable of estimating GDP, but few studies have been conducted for mapping GDP at pixel level and further pattern analysis of economic differences in different regions using the VIIRS data. This paper produced a pixel-level (500 m 500 m) GDP map for South China in 2014 and quantitatively analyzed economic differences among diverse geomorphological types. Based on a regression analysis, the total nighttime light (TNL) of corrected VIIRS data were found to exhibit R2 values of 0.8935 and 0.9243 for prefecture GDP and county GDP, respectively. This demonstrated that TNL showed a more significant capability in reflecting economic status (R2 > 0.88) than other nighttime light indices (R2 < 0.52), and showed quadratic polynomial relationships with GDP rather than simple linear correlations at both prefecture and county levels. The corrected NPP-VIIRS data showed a better fit than the original data, and the estimation at the county level was better than at the prefecture level. The pixel-level GDP map indicated that: (a) economic development in coastal areas was higher than that in inland areas; (b) low altitude plains were the most developed areas, followed by low altitude platforms and low altitude hills; and (c) economic development in middle altitude areas, and low altitude hills and mountains remained to be strengthened.

DOI

[16]
Fan J F, Ma T, Zhou C H, et al.Comparative estimation of urban development in China's cities using socioeconomic and DMSP/OLS night light data[J]. Remote Sensing, 2014,6(8):7840-7856.China has been undergoing a remarkably rapid urbanization process in the last several decades. Urbanization is a complicated phenomenon involving imbalanced transformation processes, such as population migrations, economic advancements and human activity dynamics. It is important to evaluate the imbalances between transformation processes to support policy making in the realms of environmental management and urban planning. The Defense Meteorological Satellite Program Operational Linescan System (DMSP/OLS) nighttime lights time series imagery provides a consistent and timely measure to estimate socioeconomic dynamics and changes in human activity. In this study, we jointly compared the annual ranks of three variables: the population, the gross domestic product (GDP) and the sum of weighted DMSP/OLS nighttime lights to estimate spatial and temporal imbalances in the urbanization processes of 226 cities in China between 1994 and 2011. We used ternary plots and a Euclidean distance-based method to quantitatively estimate the spatial and temporal imbalances between cities and to classify diverse urban development patterns in China. Our results suggest that, from 1994 to 2011, the imbalances of urbanization processes observed in the eastern, western and middle cities decreased, respectively, by 35.26%, 29.04% and 25.84%; however, imbalances in the northeast increased by 33.29%. The average decrement in imbalances across all urbanization processes in the 226 cities was 17.58%. Cities in the eastern region displayed relatively strong attractions to population, more rapid economic development processes and lower imbalances between socioeconomic and anthropogenic dynamics than cities in other regions. Several types of urban development patterns can be identified by comparing the morphological characteristics of temporal ternary plots of the 226 cities in China. More than one third (35.40%) of the 226 cities presented balanced states during the period studied; however, the remainder showed alternative urban development patterns.

DOI

[17]
Marx A, Ziegler R.Analysis of panamanian DMSP/OLS nightlight corroborates suspicions of inaccurate fiscal data: A natural experiment examining the accuracy of GDP data[J]. Remote Sensing Applications: Society and Environment, 2017,8:99-104.Governments have incentives to misreport their economic productivity to advance their political goals. These incentives have long been understood, but the validity of government data has been difficult to estimate in the absence of viable external estimates. Using historic Defense Meteorological Satellite Program's Operational Linescan System nightlights imagery we corroborate reports that Panama's government data has been increasingly politicised since the handover of the Panama Canal on 31 December 1999. The Canal Handover represents a atural experiment in which the production of government data changed in Panama for reasons separate from the desire to manipulate that data. The amount of light a country produces at night, known as nightlight production, has been shown to strongly correlate with GDP. Using subnational Panamanian nightlight production from 1996 to 2012, we detect a significant divergence between the relationship of subnational reported GDP and nightlights before the Canal handover (when the U.S.A. was very involved in their statistical agencies) and the correlation after the handover (with no U.S. involvement). Our results indicate that between 2000 and 2012, Panama reported approximately 19% more GDP than what was expected by their nightlight production from 2000 to 2012, or a total of around 40 billion U.S. dollars. Our results suggest governments may engage in political manipulation of government statistics to improve the appearance of government performance. While indirect data can never definitely confirm economic phenomena, this analysis presents a unique research design and application of historic satellite imagery to corroborate reports of GDP misreporting.

DOI

[18]
袁涛. DMSP/OLS数据支持的贫困地区测度方法研究[D].北京:中国地质大学(北京),2013.

[ Yuan T.Monitoring methods for poor areas supported by DMSP/OLS Night-light imagery[D]. Beijing: China University of Geoscience (Beijing), 2013. ]

[19]
李佳洺,陆大道,徐成东.胡焕庸线两侧人口的空间分异性及其变化[J].地理学报,2017,72(1):148-160.胡焕庸线作为人地关系的重要地理大发现之一,揭示了中国人口分布东密西疏的重要特征,是人文与经济地理学对社会的重要贡献之一。本文采用地理探测器等定量方法,以人口普查数据为基础,对胡焕庸线两侧人口分布的分异性特征进行了深入讨论,并尝试解释中国人口分布特征变化的原因及其机制。结果表明:1胡焕庸线作为中国最重要的人口分界线仍基本保持稳定,但从空间统计学分异特征来看该分界线仍可进一步优化调整;2胡焕庸线两侧内部人口集聚模式发生着明显变化,东南半壁人口分布由改革开放之前和初期的相对均衡状态,转变为以长三角、珠三角等少数区域为中心的集聚模式;而西北半壁人口分布的集聚程度则趋于下降;3从人口空间分布的影响因素看,尽管总体上,经济发展类因素对于人口空间分布影响不断增强,但三大阶梯等自然地理本底条件依然对中国人口分布有着重要影响。

DOI

[ Li J M, Lu D D, Xu C D.Spatial heterogeneity and its changes of population on the two sides of Hu Line[J]. Acta Geographic Sinica, 2017,72(1):148-160. ]

[20]
曹子阳,吴志峰,匡耀求,等. DMSP/OLS夜间灯光影像中国区域的校正及应用[J].地球信息科学学报,2015,17(9):1092-1102.美国国防气象卫星搭载的业务型线扫描传感器(DMSP/OLS)获取的夜间灯光影像,可客观地反映人类开发建设活动强度,其广泛应用于城市遥感的多个领域。但该数据缺少星上的辐射校正,下载的原始影像数据集不能直接用于研究,需进行区域校正。长时间序列的DMSP/OLS夜间灯光影像数据集主要存在2个问题需在校正过程中解决:(1)原始影像数据集中的影像是非连续性的;(2)数据集中的每一期影像都存在着像元DN值饱和的现象。针对这2个问题,本文提出了一种不变目标区域法的影像校正方法,对提取出来的每一期中国区域的夜间灯光影像进行了校正,该校正方法包括相互校正、饱和校正和影像间的连续性校正。最后,为了检验校正方法的合理性与可靠性,本文将校正前后中国夜间灯光影像与GDP和电力消耗值,分别进行回归分析评价表明,校正后的影像更客观合理地反映区域经济发展的差异。

DOI

[ Cao Z Y, Wu Z F, Kuang, Y Q, et al.Correction of DMSP/OLS night-time light images and its application in China[J]. Journal of Geo-information Science, 2015,17(9):1092-1102. ]

[21]
Pandey P, Mandal V, Katiyar S, et al.Geospatial approach to assess the impact of nutrients on rice equivalent yield using MODIS Sensors' based MOD13Q1-NDVI data[J]. IEEE Sensors Journal, 2015,15(11):6108-6115.Crop productivity is a major concern all over the world to provide food security, resulting in the green revolution. It is noteworthy that the fertilizer implemented to farmland leads to more desirable cropping patterns. Utilization of agricultural land efficiently for the crop production requires the knowledge of the nutrient inconsistency. This paper has presented the power of geomatics, to retrieve the synoptic and substantial changes in cropping pattern. Results and interpretations lead to the evaluation of the contemporaneous cropping systems. After a major yield parameter scrutiny for crops (rice, wheat, sugarcane, and onion), the magnificent accelerations were suggested. Results demonstrated a correlation r2 value of 0.834 with the estimated crop yield and normalized difference vegetation index. The Rice Equivalent Yield (REY) is highest at the range of 17-21 t/ha in the North, central and southern lower part, lowest at the western part ranging from 7-12 t/ha, with some part with 12-14 t/ha, while the most of the eastern part of the study site has shown the REY values ranging from 14 to 17 t/ha. The surveyed information, such as pH, electical conductivity, and organic carbon of the soil specimen, was used to examine the spatial discrepancies of rice-based cropping system's productivity. Ultimately, the spatialtemporal maps of fertilization pattern, yield parameters (e.g., N, F, and K), and relational REY observation were illustrated using spatial interpolation.

DOI

[22]
卓莉,张晓帆,郑璟,等.基于EVI指数的DMSP/OLS夜间灯光数据去饱和方法[J].地理学报,2015,70(8):1339-1350.DMSP/OLS nighttime light (NTL) data has been widely applied to many studies on anthropogenic activities and their effects on the environment. Due to the limitations of the OLS sensor, NTL data suffers from saturation problem in the core of urban areas, which further influences researches based on nocturnal lights. The radiance calibrated nighttime light (RCNTL) products developed by the National Geophysical Data Center (NGDC) at NOAA partially solved the problem. However, they are only available for a very limited number of years. Recently, a vegetation adjusted NTL urban index (VANUI) has been developed based on the stylized fact that vegetation and urban surfaces are inversely correlated. Despite its simplicity of implementing and effectiveness in increasing variation to NTL data, VANUI does not perform well in some fast growing cities. In this paper, we proposed a new urban index, i.e., the Enhanced Vegetation Index (EVI) adjusted nighttime light index (EANTLI), which combined MODIS EVI with NTL to alleviate the saturation problem of NTL data. In order to evaluate the proposed EANTLI's capability in reducing NTL saturation, we first compared its spatial distributions in potential saturated areas (PSAs) of three metropolitan areas in China with that of the original NTL and VANUI, respectively. Then we randomly selected 30 latitudinal transects across these urban areas to verify EANTLI's similarity to the RCNTL. Finally, we tested EANTLI's effectiveness in assessing electric power consumption of 168 prefecture-level cities in China. Results from these experiments showed that EANTLI significantly increases spatial heterogeneity in the PSAs and effectively alleviates the NTL saturation problem. EANTLI's similarity to RCNTL is consistently higher than that of VANUI in the comparison of latitudinal transects. EANTLI also yields better results in the estimation of electric power consumption. In conclusion, the EANTLI can effectively reduce NTL saturation in urban centers and thus has great potential of wide range applications in the future.

DOI

[ Zhuo L, Zhang X F, Zheng J.An EVI-based method to reduce saturation of DMSP/OLS nighttime light data[J]. Acta Geographic Sinca, 2015,70(8):1339-1350. ]

[23]
Detecting spatiotemporal dynamics of global electric power consumption using DMSP-OLS nighttime stable light data[J]. Applied Energy, 2016,184(15):450-463.The rapid development of global industrialization and urbanization has resulted in a great deal of electric power consumption (EPC), which is closely related to economic growth, carbon emissions, and the long-term stability of global climate. This study attempts to detect spatiotemporal dynamics of global EPC using the Defense Meteorological Satellite Program Operational Linescan System (DMSP-OLS) nighttime stable light (NSL) data. The global NSL data from 1992 to 2013 were intercalibrated via a modified invariant region (MIR) method. The global EPC at 1 km resolution was then modeled using the intercalibrated NSL data to assess spatiotemporal dynamics of EPC from a global scale down to continental and national scales. The results showed that the MIR method not only reduced the saturated lighted pixels, but also improved the continuity and comparability of the NSL data. An accuracy assessment was undertaken and confined that the intercalibrated NSL data were relatively suitable and accurate for estimating EPC in the world. Spatiotemporal variations of EPC were mainly identified in Europe, North America, and Asia. Special attention should be paid to China where the high grade and high-growth type of EPC covered 0.409% and 1.041% of the total country area during the study period, respectively. The results of this study greatly enhance the understanding of spatiotemporal dynamics of global EPC at the multiple scales. They will provide a scientific evidence base for tracking spatiotemporal dynamics of global EPC.

DOI

[24]
Zhang Q L, Crystal, S, et al.The vegetation adjusted NTL urban index: A new approach to reduce saturation and increase variation in nighttime luminosity[J]. Remote Sensing of Environment, 2013,129(2):32-41.78 We develop a spectral index to reduce DMSP/OLS NTL saturation in core urban areas. 78 This index, VANUI, increases inter-urban variability in NTL values. 78 VANUI is based on underlying biophysical and urban characteristics. 78 VANUI is simple to calculate and intuitive to interpret. 78 VANUI may be useful for studies on urban energy use and urban structure.

DOI

[25]
邓刘洋,沈占锋,柯映明.城市建成区遥感影像边界提取与扩张分析[J].地球信息科学学报, 2018,20(7):996-1003.

[ Deng L Y, Shen Z F, Ke Y M.Built-up area extraction and urban expansion analysis based on remote sensing images[J]. Journal of Geo-information Science, 2018,20(7):996-1003. ]

[26]
Zhuo L, Zheng J, Zhang X, et al.An improved method of night-time light saturation reduction based on EVI[J]. International Journal of Remote Sensing, 2015,36(16):4114-4130.Defense Meteorological Satellite Program (DMSP) Operational Linescan System (OLS) night-time light (NTL) data have been widely applied to studies on anthropogenic activities and their interactions with the environment. Due to limitations of the OLS sensor, DMSP NTL data suffer from a saturation problem in central urban areas, which further affects studies based on nocturnal lights. Recently, the vegetation-adjusted NTL urban index (VANUI) has been developed based on the inverse correlation of vegetation and urban surfaces. Despite its simple implementation and ability to effectively increase variations in NTL data, VANUI does not perform well in certain rapidly growing cities. In this study, we propose a new index, denoted enhanced vegetation index (EVI)-adjusted NTL index (EANTLI), that was developed by reforming the VANUI algorithm and utilizing the EVI. Comparisons with radiance-calibrated NTL (RCNTL) and the new Visible Infrared Imager Radiometer Suite (VIIRS) data for 15 cities worldwide show that EANTLI reduces saturation in urban cores and mitigates the blooming effect in suburban areas. EANTLI similarity to RCNTL and VIIRS is consistently higher than VANUI similarity to RCNTL and VIIRS in both spatial distribution and latitudinal transects. EANTLI also yields better results in the estimation of electric power consumption of 166 Chinese prefecture-level cities. In conclusion, EANTLI can effectively reduce NTL saturation in urban centres, thus presenting great potential for wide-range applications.

DOI

[27]
吴洁璇. 开放数据支持下的城市建设用地利用效率评价方法研究[D].南京:南京大学,2016.

[ Wu J X.Study on evaluation method of city construction land use efficiency support by open data [D]. Nanjing: Nanjing University, 2016. ]

[28]
王欣,吴殿延,肖敏.产业发展与中国经济重心迁移[J].经济地理,2006,26(6):978-981.历史上中国的经济重心曾经不断地移动,产业的兴起及其空间拓展在其中扮演了关键性的角色。农业开发促成了中国古代第一个经济重心区域的形成和后来的几次移动。近代工业的登陆使东部沿海的内在优势得到有效发挥。建国以后现代工业的布局影响着经济重心的移动。改革开放以来,现代工业、服务业和知识经济带来了历史上最快速的经济重心转移。文章还发现,中国经济重心的迁移存在几个特殊的规律。

DOI

[ Wang X, Wu D Y, Xiao M.Industrial development and moving of Chinese economic barycenter[J]. Economical Geography, 2006,26(6):978-981. ]

[29]
Gong J.Clarifying the standard deviational ellipse[J]. Geographical Analysis, 2002,34(2):155-167.Abstract For a set of geographical units in the Cartesian coordinate system, the locus of the standard deviation of the x coordinates of the set forms a closed curve as the system is rotated about the origin. This curve, often referred to as “standard deviational ellipse” (SDE), is not in fact an ellipse. The actual shape of the curve has remained unclear since the issue was mentioned initially by Lefever in 1926. In the present paper this closed curve, referred to as “standard deviation curve” (SDC), is clarified mathematically, and some of its applications in spatial analysis are discussed. The shape of SDC changes from a single circle to double circles when the distribution of the set of geographical units changes from an even condition to a straight line. The shape of SDC is determined explicitly by the ratio of its minor axis to its major axis. This ratio, therefore, is a useful index to show to what extent the distribution of a set of geographical units is circular, or linear. In addition, the size and radius of SDC can be used to indicate the distribution density of geographical units. The major axis of SDC, whose angle is determined explicitly for the first time, indicates the major orientation of geographical units. A program has been developed to apply SDC to spatial analysis (mean center, major orientation, distribution density, circular condition, etc.). The program is available from jx_gong@hotmail.com . It is written in the MapBasic language, and runs under MapInfo.

DOI

[30]
李汝资,王文刚,宋玉祥.东北地区经济差异演变与空间格局[J].地域研究与开发,2013,32(4):28-32.以人均国内生产总值为测度区域经济差异的变量指标,运用标准差、标准差系数、相对发展率、泰尔指数定量分析1995年以来东北地区区域经济差异变化特征与区域经济空间格局。分析表明:东北地区经济发展绝对差异总体增大,相对差异呈明显的倒“U”型,但金融危机过后有进一步上升趋势;区域内部差异远大于各省区之间差异,各省区内部差异明显不同,黑、辽与吉、蒙东呈现出经济发展水平与区域差异水平匹配的“高高”、“低低”俱乐部发展趋势;经济水平呈现出显著的“T”字型空间格局,区域经济发展速度南北差异明显,辽中南城市群是东北地区经济发展的核心地。东北振兴战略实施对东北地区经济差异演变与空间格局的形成起到重要作用,主体功能区划将进一步促进东北地区经济的协调发展。

DOI

[ Li R Z, Wang W G, Song Y X.The economy disparity evolution and spatial pattern of northeast area in China[J]. Areal Research and Development, 2013,32(4):28-32,89. ]

Outlines

/