
Journal of Geo-information Science >
Time Series Monitoring and Comparative Analysis on Eco-environment Change in the Lower Reaches of the Tarim River
Received date: 2018-10-01
Request revised date: 2018-12-18
Online published: 2019-03-15
Supported by
National Key Research and Development Program of China, No.2017YFB0504204
National Natural Science Foundation of China, No.41671034, 41201460, U1178302.
Copyright
The lower reaches of the Tarim River is a region with fragile ecology and significant environmental problems in an arid area of Western China. The local ecological environment has experienced tremendous degradation over the decades, due to water resource deficits from human activities and climate change. In the year 2000, the Tarim River Basin Administration Bureau (TBAB) initiated the Ecological Water Conveyance Project (EWCP) in an attempt to restore the downstream ecosystem. By the end of 2017, 18 water delivery projects had been completed, totaling 6.3 billion m3. Understanding the effect of water delivery on the ecological environment in the lower reaches of the Tarim River is of environmental importance. This paper monitors and analyses regional environmental changes and ecological responses before and after water conveyance from surface water (lakes, rivers and wetlands), groundwater and vegetation cover, using multi-source remote sensing and long-term series data. Wetland information and updated maps were produced using thematic map plaque knowledge transfer technology. Regional wetlands mapping and area change statistics were then completed for the years 1990, 1995, 2000, 2005, 2010 and 2015. Finally, regional wetland and vegetation change characteristics were analyzed pre-EWCP period (before 2000) and post-EWCP (after 2000). Results indicate that: (1) Pre-EWCP period (1990-2000), the regional ecological environment in the lower reaches of the Tarim River continued to deteriorate (almost half of the swamp wetlands in the basin disappeared and the regional vegetation coverage decreased significantly). (2) Post-EWCP period (2000-2017), the regional ecological environment has been significantly improved. This was indicated by a “V” type reversal in the lakes and wetlands of the basin. In addition, the areas containing medium and sparse vegetation coverage had a significant increasing trend, and the ecological environment of wetland was gradually restored. Furthermore, the long-term dry and shut-off state of the downstream river channel has been changed. In particular, the Tail Lake (Taitema Lake) gradually regained its vitality after 30 years of becoming dry (area reached 147.87 km2 in Aug. 2017). This research showed that the EWCP played a key role in the rescue and control of the ecological environment in the lower reaches of the Tarim River and hence, the regional ecological environment is gradually recovering. These findings are critical for environmental effect assessments by the EWCP and future ecological restoration effort in the lower reaches of the Tarim River. They may also provide useful technical support and decision-making references for ecological engineering construction and performance evaluation.
ZHU Changming , LI Junli , SHEN Zhanfeng , SHEN Qian . Time Series Monitoring and Comparative Analysis on Eco-environment Change in the Lower Reaches of the Tarim River[J]. Journal of Geo-information Science, 2019 , 21(3) : 437 -444 . DOI: 10.12082/dqxxkx.2019.180523
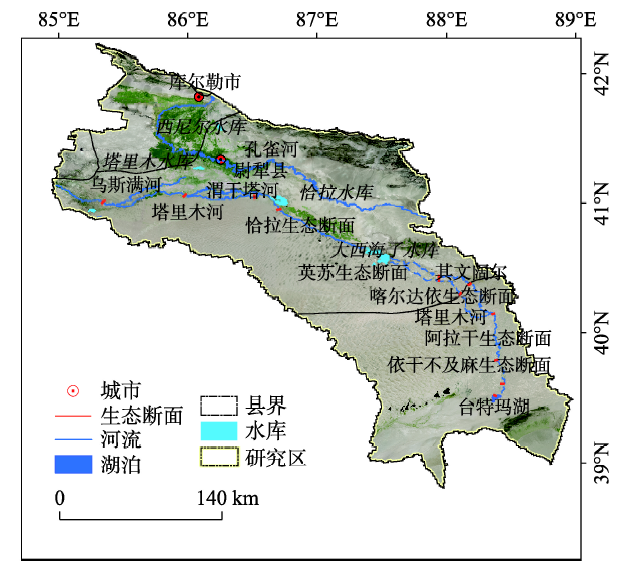
Fig. 1 Study area location图1 博斯腾湖以下的塔里木河研究区 |
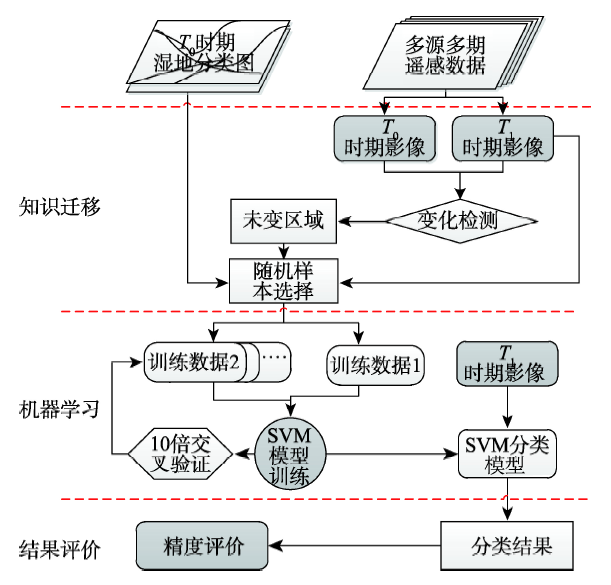
Fig. 2 Map of updated wetlands based on thematic knowledge transfer图2 基于专题图知识迁移的湿地图斑更新流程 |
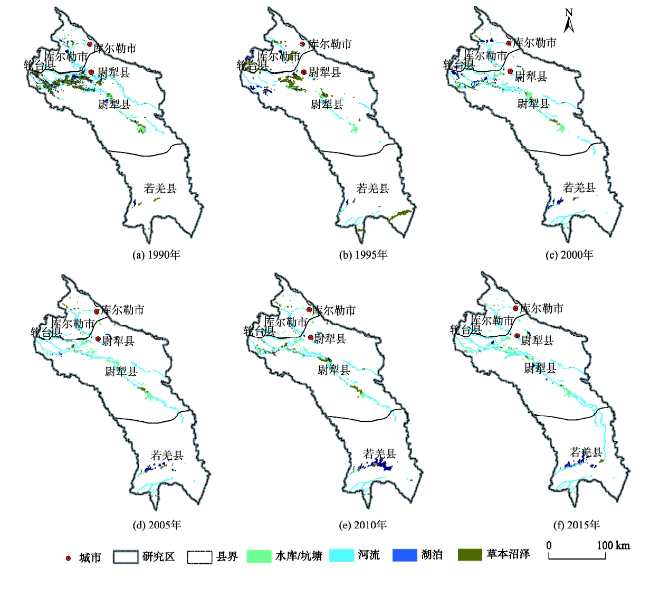
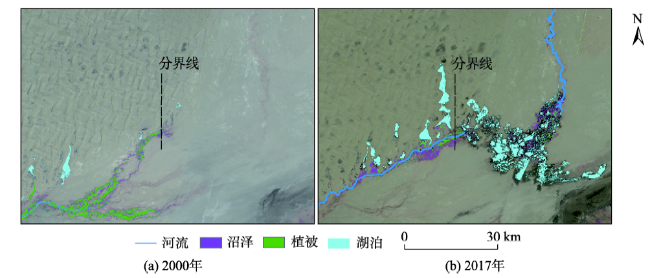
Fig. 3 Wetland maps over six time periods using remote sensing in the lower reaches of the Tarim River图3 塔里木河下游湿地分布遥感制图 |
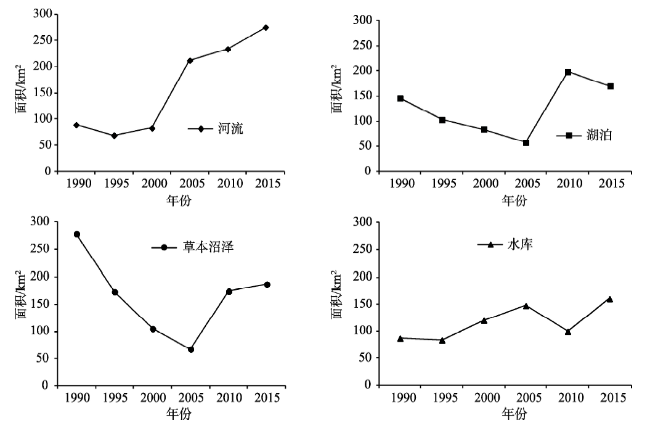
Fig. 4 Area changes of various wetlands in the lower reaches of Tarim river图4 塔里木河下游不同类型湿地面积变化曲线 |
Fig. 5 Change in water area of the Taitema Lake between 2000 and 2017图5 2000-2017年台特玛湖水域面积变化对比 |
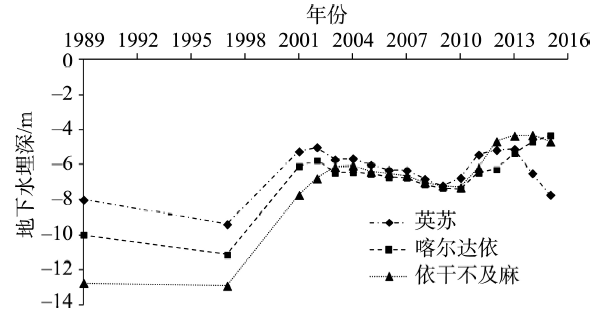
Fig. 6 Variation in groundwater depth at different depths图6 生态输水前后地下水位变化 |
Tab. 1 Dynamic change to the landscape in the lower reaches of the Tarim River表1 生态输水前后塔里木河下游流域地表覆被景观变化动态度 |
| 1990-2000年 | 2000-2015年 | ||||||||
|---|---|---|---|---|---|---|---|---|---|
| 水域面积 | 沼泽面积 | 低疏植被 | 中等植被 | 水域面积 | 沼泽面积 | 低疏植被 | 中等植被 | ||
| 变化值/km2 | -68.38 | -1528.87 | -11007.05 | -741.48 | 184.17 | 144.23 | 1513.50 | 317.93 | |
| 动态度/% | -2.90 | -5.35 | -5.54 | -6.33 | 11.01 | 1.09 | 1.71 | 7.40 | |
注:结合区域植被特征将流域干旱区的植被分为:低疏植被覆盖区(FVC 5%~20%)和中等植被覆盖区(FVC 20%~50%)。 |
The authors have declared that no competing interests exist.
| [1] |
[
|
| [2] |
|
| [3] |
[
|
| [4] |
[
|
| [5] |
|
| [6] |
|
| [7] |
[
|
| [8] |
[
|
| [9] |
[
|
| [10] |
[
|
| [11] |
[
|
| [12] |
[
|
| [13] |
[
|
| [14] |
[
|
| [15] |
http://www.gscloud.cn/
|
| [16] |
http://www.cresda.com/CN/
|
| [17] |
[
|
| [18] |
|
| [19] |
[
|
| [20] |
[
|
| [21] |
[
|
| [22] |
[
|
/
| 〈 |
|
〉 |