
Journal of Geo-information Science >
Mapping Paddy Rice in the Hainan Province Using both Google Earth Engine and Remote Sensing Images
Received date: 2018-08-30
Request revised date: 2018-12-24
Online published: 2019-06-15
Supported by
Science and Technology Service Network Initiative(STS), No.KFJ-STS-ZDTP-009
National Key R&D Program of China, No.2016YFA0600301, 2016YFA0600302
Strategic Priority Research Program of the Chinese Academy of Sciences(A), No.XDA19030201
National Natural Science Foundation of China, No.41561144013, 41701496
Copyright
Rice is one of the main grain crops in China and East Asia, including China. The annual yield of rice has a significant influence on domestic livelihood. Therefore, timely and accurate assessment of rice distribution information is crucial for forecasting rice yields and optimize the allocation of agricultural resources. Remote sensing (RS) images can provide time series surface spectral, and other electro-magnetic, dynamics over a large-scale land surface, which are commonly used for large-scale crop monitoring. However, routine rice classifying strategies provided by the RS images during key growth stages, require spectral patterns at high frequency. This method appears to be impractical within South China, as the number of high quality RS images are difficult to obtain due to cloud contamination caused by the hot and wet weather. A combination of various RS images of rice classification from multi-platforms provide an indirect way of reducing the revisit period in routine rice classification, thus enabling successful crop mapping in cloudy regions. However, this causes difficulty with data manipulation and storage, especially when conducting classification work at province or large area levels. To address these issues, this research utilizes Google Earth Engine (a cloud-based geospatial analysis platform running on the Google server)to collect online optic RS data and micro-wave RS data at diverse resolutions for rice mapping. A distribution map of paddy rice at 10-m spatial resolution in the Hainan Province in 2016 was made by using the combined methods of random forest (RF) classification and a pattern-matching strategy based on conjunct features extracted at monthly level and histogram value distribution. Results showed this method was suitable for rice mapping in Hainan and could show clear feature divergence between the different land surface cover types. Spatial distribution results corresponded well with the actual edges of the field, along with texture information. The rice classification result of the Hainan Province was validated using sample points captured on the ground and achieved overall accuracy of 93.2%, indicating reliability for practical application. Overall, the automatic rice classifying strategy was able to map paddy rice with high efficiency and sufficient accuracy in the Hainan Province, and could be applied to other vast areas.
TAN Shen , WU Bingfang , ZHANG Xin . Mapping Paddy Rice in the Hainan Province Using both Google Earth Engine and Remote Sensing Images[J]. Journal of Geo-information Science, 2019 , 21(6) : 937 -947 . DOI: 10.12082/dqxxkx.2019.180423.
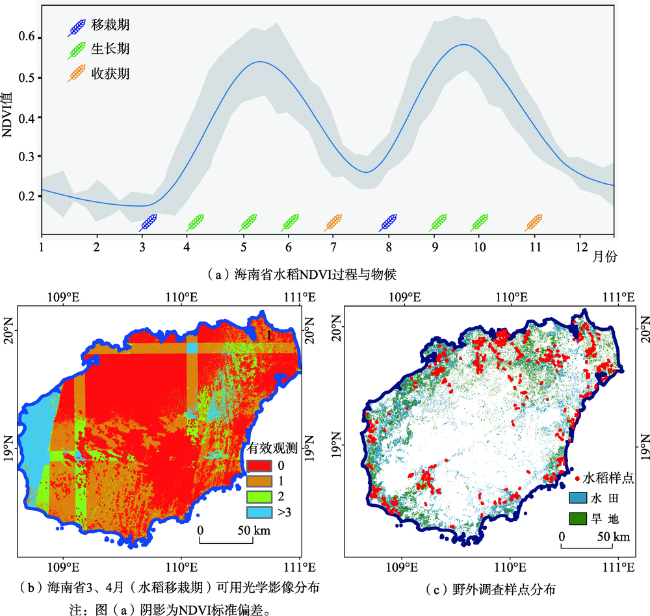
Fig. 1 Basic information of research area of Hainan Province图1 海南省水稻实验区基本信息 |
Tab. 1 Band informationof images employed in the research表1 分类所需遥感影像波段参数 |
| 传感器 | 波段 | 波长/nm | 分辨率/m | 数据量/景 | |
|---|---|---|---|---|---|
| Sentinel-2 MSI | B2 | Blue | 490 | 10 | 340 |
| B3 | Green | 560 | 10 | ||
| B4 | Red | 665 | 10 | ||
| B8 | Near-infrared | 842 | 10 | ||
| B11 | Short-wave infrared 1 | 1610 | 20 | ||
| B12 | Short-wave infrared 2 | 2190 | 20 | ||
| Landsat-8 OLI | B2 | Blue | 450~510 | 30 | 106 |
| B3 | Green | 530~590 | 30 | ||
| B4 | Red | 640~670 | 30 | ||
| B5 | Near-infrared | 850~880 | 30 | ||
| B6 | Short-wave infrared 1 | 1570~1650 | 30 | ||
| B7 | Short-wave infrared 2 | 2110~2290 | 30 | ||
| Sentinel-1 | VV | Dual-band crosspolarization, vertical transmission/horizontal receiver | 10 | 月合成 | |
| VH | 10 | ||||
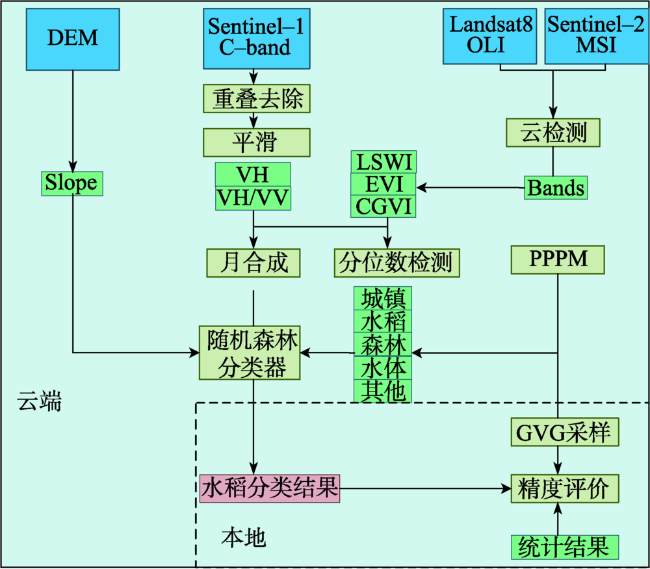
Fig. 2 Rice mapping based on GEE图2 基于GEE的水稻分类流程 |
Tab. 2 RS-based surface parameters表2 遥感地表参数计算公式 |
| 地表参数 | 计算方法 |
|---|---|
| NDVI | NDVI= |
| EVI | |
| LSWI | LSWI= |
| NDWI | |
| GCVI |
注:Red为传感器红光波段;Green为绿光波段;Blue为蓝光波段;NIR为近红外波段;SWIR为短波红外波段。 |
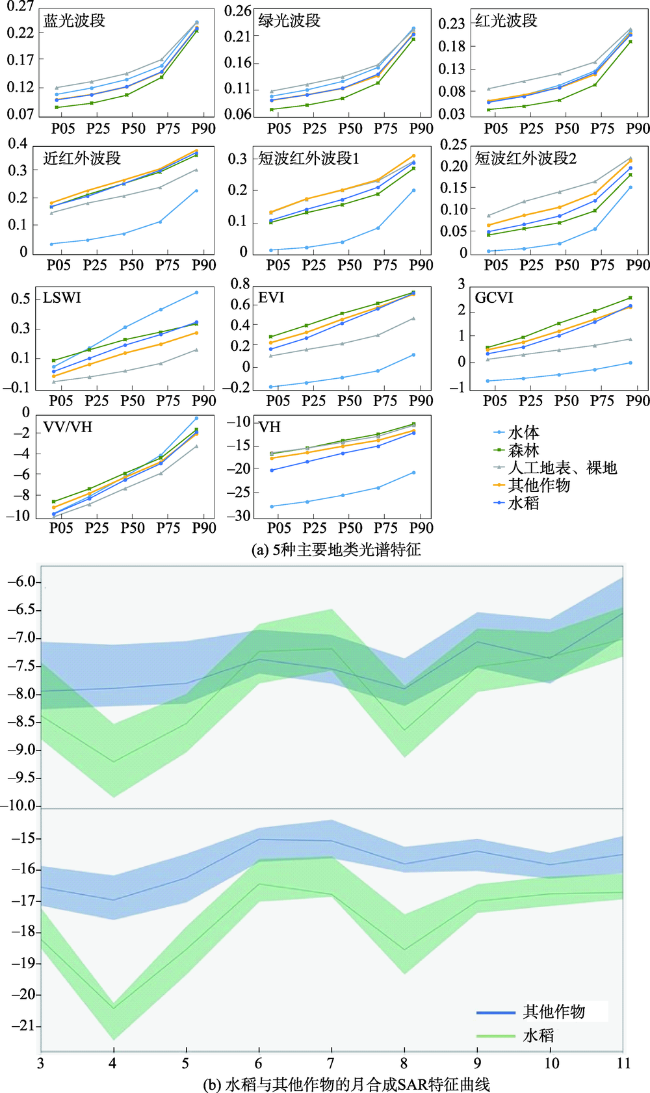
Fig. 3 Spectral pattern of main land cover types图3 主要地物光谱特征提取结果 |
Fig. 4 Rice maps of the HainanProvince and comparison of time-series SAR of rice and other crops图4 海南省水稻分类结果示意及局部分类结果与30 m土地利用产品对比 |
Tab. 3 Accuracy assessment of rice in Hainan Province表3 精度评价混淆矩阵 |
| 海南省水稻分类验证 | 验证样点 | 总计 | 用户 精度/% | ||
|---|---|---|---|---|---|
| 其他地类 | 水稻 | ||||
| 分类结果 | 其他地类 | 244 | 78 | 322 | 75.8 |
| 水稻 | 13 | 1005 | 1018 | 98.7 | |
| 总计 | 257 | 1083 | 1340 | ||
| 生产者精度/% | 94.9 | 92.7 | |||
| 总体精度/% | 93.2 | ||||
| FScore | 95.6 | ||||
The authors have declared that no competing interests exist.
| [1] |
|
| [2] |
|
| [3] |
|
| [4] |
|
| [5] |
|
| [6] |
|
| [7] |
|
| [8] |
|
| [9] |
|
| [10] |
|
| [11] |
[
|
| [12] |
|
| [13] |
|
| [14] |
|
| [15] |
|
| [16] |
|
| [17] |
|
| [18] |
|
| [19] |
|
| [20] |
|
| [21] |
[
|
| [22] |
|
| [23] |
|
| [24] |
|
| [25] |
|
| [26] |
|
| [27] |
[
|
| [28] |
|
| [29] |
[
|
| [30] |
|
| [31] |
|
| [32] |
|
| [33] |
|
| [34] |
|
| [35] |
|
| [36] |
|
| [37] |
|
| [38] |
|
| [39] |
|
| [40] |
|
| [41] |
|
| [42] |
|
| [43] |
|
| [44] |
|
| [45] |
[
|
| [46] |
[
|
| [47] |
[
|
| [48] |
[
|
/
| 〈 |
|
〉 |
