
Journal of Geo-information Science >
The Use of UAV Remote Sensing Technology to Identify Crop Stress: A Review
Received date: 2018-08-24
Request revised date: 2018-12-24
Online published: 2019-04-24
Supported by
National Key Research and Development Program of China, No.2016YFC0208202, 2017YFB0503005.
Copyright
Crop stress is an important factor restricting global agricultural development. Monitoring and understanding rapid, large-scale and real-time crop stress is of great significance for agricultural production. However, traditional methods of crop stress monitoring (such as fields surveys, physical and chemical detection, and satellite remote sensing), are strongly influenced by field and atmospheric conditions, temporal and spatial resolution, and labor costs. Rapid development of UAV platforms and various lightweight sensors, provide new solutions for various crop stress monitoring. These offer multiple advantages, primarily high frequency and speed. The introduction of various mainstream UAV platforms such as multi-rotor and fixed-wing, and sensors such as visible light digital camera, multispectral camera, hyperspectral camera, and thermal infrared camera has allowed for more efficient crop monitoring. This review explores the main biotic and abiotic stress types used by UAV remote sensing systems for crop monitoring. Biotic stressors mainly include miscellaneous grass stress, plant diseases, and insect pests stress. Abiotic stressors predominantly include water and nutrient stress. The application and technical methods of UAV remote sensing system monitoring of crop stress, based on spectral imaging and thermal infrared sensor technology are discussed. Sensitive bands and common vegetation indices used for crop stress monitoring are identified. Finally, key issues associated with UAV remote sensing and the future use of UAV remote sensing for crop stress monitoring are discussed. The advancement of UAV remote sensing technology, could contribute to improved identification and monitoring of crop stress in the near future.
HUANG Yaohuan , LI Zhonghua , ZHU Haitao . The Use of UAV Remote Sensing Technology to Identify Crop Stress: A Review[J]. Journal of Geo-information Science, 2019 , 21(4) : 512 -523 . DOI: 10.12082/dqxxkx.2019.180397
Tab. 1 UAV platform attributes表1 不同无人机平台属性 |
| 类型 | 载荷/kg | 飞行时间/min | 典型作业高度/m | 优点 | 缺点 |
|---|---|---|---|---|---|
| 降落伞 | ≈ 1.5 | 10~30 | >100 | 操作简单、成本低 | 抗风能力弱、载荷受限、不适合快速移动 |
| 飞艇 | >3.0 | ≈ 600 | >100 | 载荷大,垂直起降、空中悬停、姿态平稳、安全系数高 | 抗风能力弱、使用成本高、效率低、飞行速度慢 |
| 多旋翼无人机 | 0.8~8.0 | 8~120 | 50~5000 | 自动导航、定点悬停、定点起飞、降落、多载荷、转场方便、对起降场地要求低 | 飞行时间短、遥控电子信号易受外界干扰 |
| 固定翼无人机 | 1.0~10 | 30~240 | 50~5000 | 自动导航、航时长、多载荷、转场方便、速度快、效率高、抗风能力强 | 不能定点悬停、过快的飞行速度可能会影响拍摄的图像质量、起降场地要求较高 |
| 垂直起降固定翼无人机 | 1.0~15 | 30~240 | 50~5000 | 垂直起降、定点悬停、多载荷、速度快、转场方便、对起降场地要求低 | 耗油大,气动布局复杂 |
Tab. 2 Sensors type for UAV crop press monitoring表2 无人机作物胁迫监测常用传感器类型 |
| 传感器类型 | 作物胁迫应用 | 优点 | 缺点 | 参考文献 |
|---|---|---|---|---|
| 数码相机 | 可见外部伤害、生长状况 | 成本低、直观便捷 | 仅限于可见光波段能够监测的特征 | [12]-[18] |
| 多光谱相机 | 氮素胁迫、水分胁迫、病虫害胁迫 | 获取便捷、成本低、周期短 | 仅限于有限的几个波段 | [12]-[14]、[19]-[21] |
| 高光谱相机 | 各种作物胁迫 | 可以监测的作物胁迫类型比较多 | 图像处理程序繁杂、价格高昂 | [22]-[25] |
| 热红外相机 | 气孔导度、水分胁迫 | 非接触测量作物温度,方便快捷 | 受环境影响较大、较小的温度差异难以被监测、难以消除土壤影响 | [26]-[30] |
| LIDAR | 作物高度、生物量估测 | 丰富的点云信息 | 成本高、数据处理量大 | [31] |
| SAR | 数字控制喷雾器或肥料撒播机的使用率、生物量估测、作物倒伏 | 可以探测静止目标、可以测距 | 灵敏度受噪声吸收、背景噪音等的限制,采样率低于基于激光的传感器 | [32] |
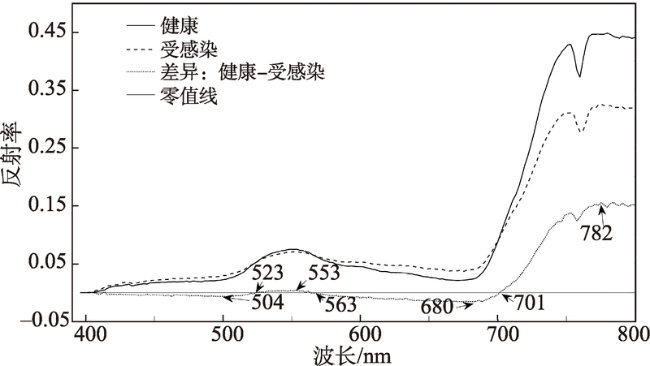
Fig. 1 Distribution of sensitive bands for optical remote sensing of crop stress图1 作物病虫害光学遥感探测敏感波段分布[22] |
Tab. 3 Common vegetation indices for crop stress detection表3 作物胁迫探测常用植被指数 |
| 指数名称 | 指数公式 | 胁迫类型 | 参考文献编号 |
|---|---|---|---|
| 归一化植被指数 | 病虫害、水分、杂草、氮素 | [13]、[41]、[52]-[55] | |
| 比值植被指数 | 病虫害 | [53] | |
| 过绿指数 | | 杂草胁迫 | [13] [50] |
| 归一化红绿差异指数 | 杂草胁迫 | [50] | |
| 叶绿素吸收反射转化指数和优化土壤调节指数的比值 | 水分胁迫 | [54] | |
| 红绿指数 | 病虫害胁迫 | [51] | |
| 红绿植被指数 | 病虫害胁迫 | [51] | |
| 过红指数 | 病虫害胁迫 | [17] | |
| 可见光大气阻抗植被指数 | 氮素胁迫 | [18] | |
| 蓝光标准化值 | 氮素胁迫 | [18] | |
| 比值光谱指数 | 氮素胁迫 | [25] | |
| 转化植被指数 | 病虫害胁迫 | [53] | |
| 光化学反射指数 | 水分胁迫 | [51] | |
| 标准化光化学指数 | 水分胁迫 | [51] | |
| 重归一化植被指数 | 水分胁迫 | [51] | |
| 修正叶绿素吸收指数 | 重金属胁迫 | [23] |
Tab. 4 Common water stress monitoring index表4 常用的水分胁迫监测指数 |
| 指数名称 | 公式 | 参考文献编号 |
|---|---|---|
| 植被水分胁迫指数 | [28]、[30]、[40]、[51]、[61] | |
| 气孔导度指数 | [54] | |
| 第二气孔导度指数 | [54] | |
| 非胁迫上限指数 | [61] | |
| 上层冠层阈值 | [61] | |
| 时间温度阈值 | [61] | |
| 整合非胁迫上限指数 | [61] | |
| 整合上层冠层阈值 | [61] |
注:Tcanopy代表冠层温度,Tdry和Twet分别代表气孔完全关闭和完全打开时的下边界和上边界温度,Tcritical代表作物临界温度,TcNS代表临近区域非胁迫作物的冠层温度,h代表一天的24 h。 |
The authors have declared that no competing interests exist.
| [1] |
[
|
| [2] |
|
| [3] |
[
|
| [4] |
[
|
| [5] |
[
|
| [6] |
[
|
| [7] |
[
|
| [8] |
[
|
| [9] |
|
| [10] |
|
| [11] |
|
| [12] |
|
| [13] |
|
| [14] |
|
| [15] |
[
|
| [16] |
[
|
| [17] |
|
| [18] |
[
|
| [19] |
|
| [20] |
|
| [21] |
|
| [22] |
|
| [23] |
[
|
| [24] |
|
| [25] |
[
|
| [26] |
|
| [27] |
|
| [28] |
|
| [29] |
|
| [30] |
|
| [31] |
[
|
| [32] |
[
|
| [33] |
|
| [34] |
|
| [35] |
[
|
| [36] |
[
|
| [37] |
[
|
| [38] |
|
| [39] |
|
| [40] |
|
| [41] |
|
| [42] |
|
| [43] |
[
|
| [44] |
|
| [45] |
[
|
| [46] |
[
|
| [47] |
|
| [48] |
|
| [49] |
|
| [50] |
|
| [51] |
|
| [52] |
|
| [53] |
|
| [54] |
|
| [55] |
|
| [56] |
|
| [57] |
|
| [58] |
|
| [59] |
|
| [60] |
|
| [61] |
|
| [62] |
|
| [63] |
|
/
| 〈 |
|
〉 |