
Journal of Geo-information Science >
Spatialization of Township-level Population based on Nighttime Light and Land Use Data in Shandong Province
Received date: 2018-09-29
Request revised date: 2019-02-25
Online published: 2019-05-25
Supported by
the Strategic Priority Research Program of the Chinese Academy of Sciences, No.XDA19040501
the Specific Informatization Scientific Research Science Program of the Chinese Academy of Sciences, No.XXH13505-07.
Copyright
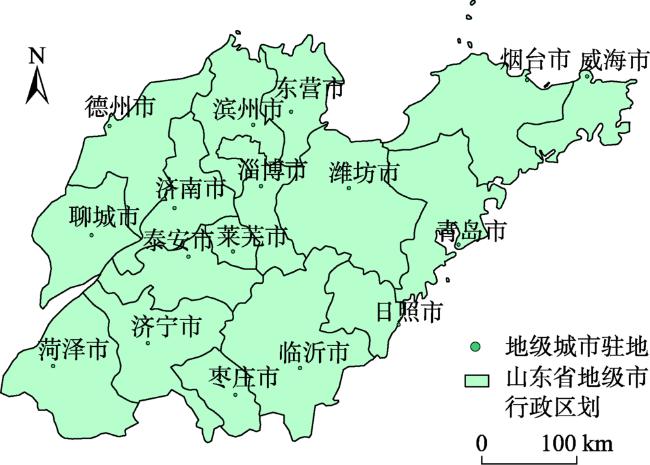
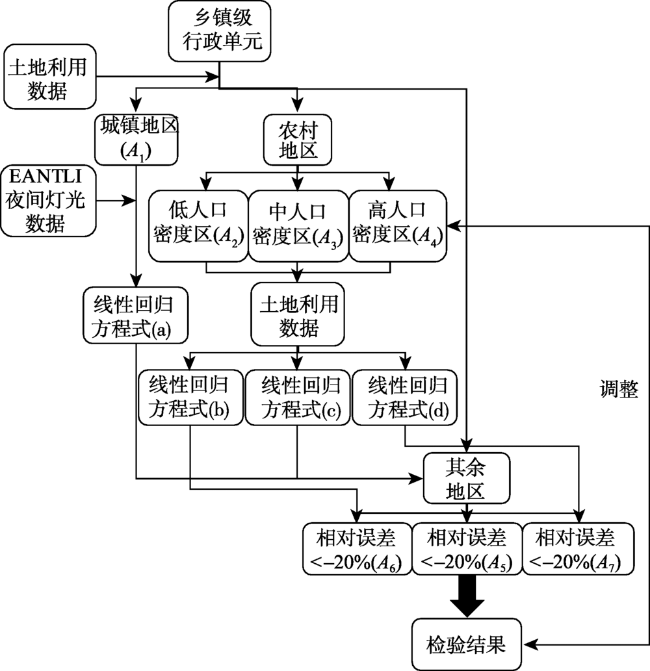
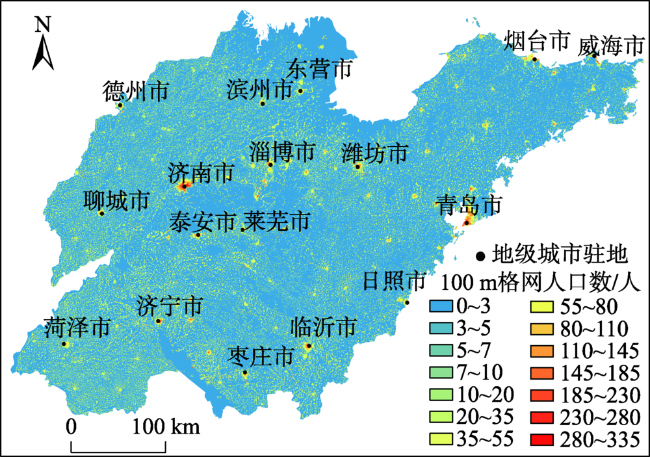
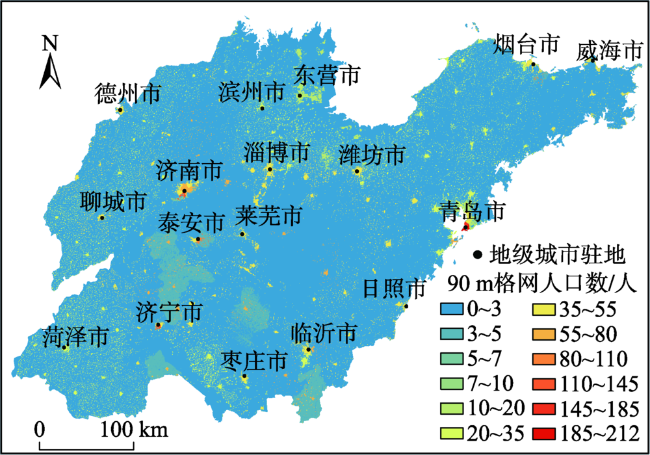
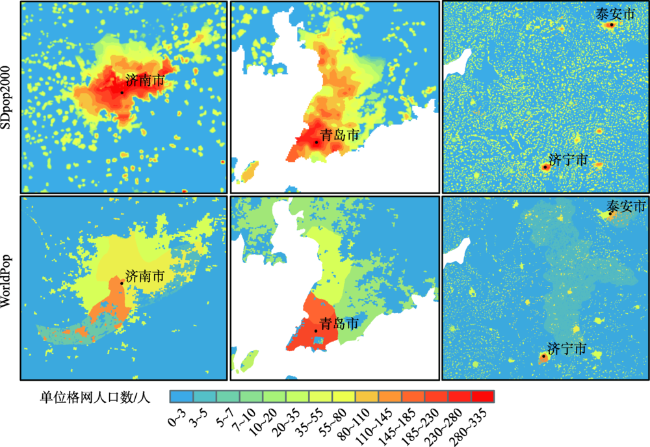
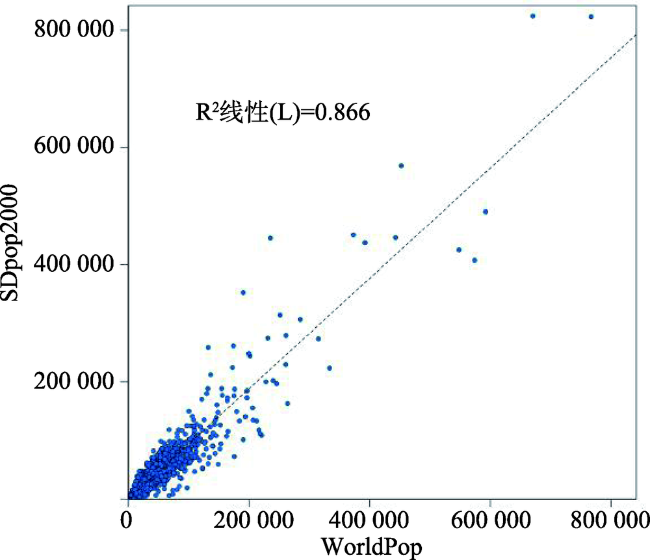
Gridded population data can be used to describe the actual spatial distribution of populations and is an effective way to achieve better integration of population data with natural, social, and economic factors. This study analyzed the demand of fine-scale gridded population data. Taking the densely populated Shandong Province in eastern China as an example, the spatialization method of township-level demographic data was investigated using nighttime satellite data and land use data fusion modeling. In this process, EVI was used to reduce saturation of DMSP/OLS nighttime satellite data to increase the difference of population distribution within the urban land. The urban and rural two-level partition method was used to avoid the shortcomings of nighttime data in the low radiance area of rural areas. The demographic values from the rest region were used to evaluate the modeling accuracy, and the results showed that 78% of the administrative units had an absolute relative error of less than 20%. Finally, based on the population data of the township-level which was first published in the fifth census in 2000, the gridded population data SDpop2000 at 100 m- resolution in Shandong Province was generated. The SDpop2000 was compared with the global WorldPop population data product with higher precision. The results showed that the correlation coefficient between SDpop2000 and WorldPop on the 10 km grid scale was as high as 0.93, and the population distribution of SDpop2000 was obviously more accurate than that of WorldPop in the central Shandong, southwestern Taian, southern Jining, southern Linyi, northern Zaozhuang, and the northern Shandong coastal areas. In addition, the SDpop2000 better described the population distribution trend in Shandong Province, which was denser in western Shandong and the plains of northern Shandong than in the mountainous hilly areas in the central and southern Shandong, the coast of northern Shandong, and the hilly area of Shandong Peninsula. Overall, the spatialization method of township-level population data developed in this study significantly improved spatialization precision and is suitable for township-level population spatialization.
WANG Mingming , WANG Juanle . Spatialization of Township-level Population based on Nighttime Light and Land Use Data in Shandong Province[J]. Journal of Geo-information Science, 2019 , 21(5) : 699 -709 . DOI: 10.12082/dqxxkx.2019.180497
Fig. 1 Map of study area (Shandong province)图1 山东省行政区划 |
Fig. 2 Flowchart of modeling and inspection based on urban and rural two-level partition图2 城乡二级分区建模和检验技术流程 |
Tab. 1 Results of partitioning and modeling表1 各地区分区和建模结果 |
| 分区 | 行政单元数/个 | 建模结果 | 方程拟合优度系数 | |
|---|---|---|---|---|
| 城镇地区 | 31 | 0.992 | ||
| 农村地区 | 181 | 0.778 | ||
| 724 | 0.763 | |||
| 181 | 0.838 | |||
| 其余地区 | 322 | — | — | |
| 177 | — | — | ||
| 210 | — | — | ||
Tab. 2 Correlation coefficients between demographic values of administrative units in each partition and various modeling elements表2 各建模区域行政单元人口统计值同各要素之间的相关性 |
| 分区 | 耕地 | 林地 | 草地 | 水系用地 | 未利用地 | 城镇用地 | 农村居民点 | 其他建设用地 | EANTLI | |
|---|---|---|---|---|---|---|---|---|---|---|
| 城镇地区 | 0.294 | 0.093 | 0.092 | 0.204 | 0 | 0.819** | 0 | -0.095 | 0.996** | |
| 农村地区 | 0.524** | 0.022 | -0.133 | -0.160* | -0.184* | 0 | 0.883** | -0.216** | 0.228** | |
| 0.635** | 0.015 | 0.09* | 0.025 | -0.027 | 0 | 0.873** | 0.034 | 0.279** | ||
| 0.595** | -0.227 | -0.068 | 0.053 | 0.045 | 0 | 0.915** | 0.112 | 0.143 | ||
注:*表示在0.05水平(双侧)上显著相关,**表示在0.01水平(双侧)上显著相关。 |
Fig. 3 Spatial distribution of population in Shandong Province in year 2000 with 100 m×100 m grids图3 山东省2000年100 m分辨率人口分布 |
Fig. 4 WorldPop of Shandong Province area in 2000图4 山东省2000年WorldPop成果 |
Fig. 5 Comparison of SDpop2000 and WorldPop in local areas图5 SDpop2000和WorldPop局部区域对比 |
Fig. 6 Scatter plots of population of SDpop2000 and WorldPop with 10 km×10 km grids图6 10 km网格内SDpop2000与WorldPop人口数散点图 |
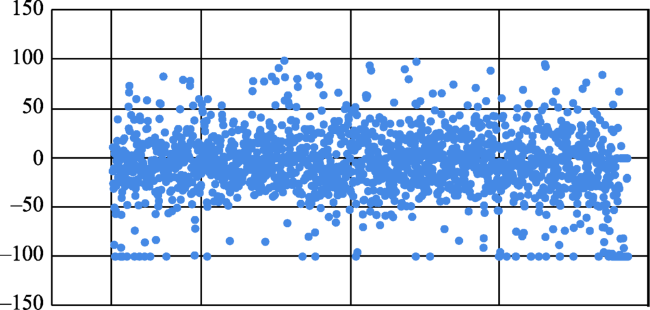
Fig. 7 Scatter plots of population relative errors between SDpop2000 and WorldPop with 10 km×10 km grids图7 10 km格网内SDpop2000与WorldPop的人口相对误差散点图 |
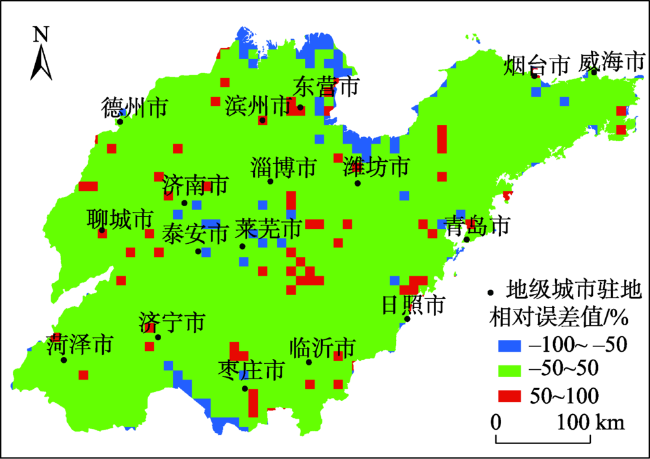
Fig. 8 Spatial distribution of population relative error between SDpop2000 and WorldPop with 10 km×10 km grids图8 10 km格网内SDpop2000与WorldPop人口相对误差的空间分布 |
The authors have declared that no competing interests exist.
| [1] |
[
|
| [2] |
[
|
| [3] |
|
| [4] |
|
| [5] |
[
|
| [6] |
[
|
| [7] |
|
| [8] |
|
| [9] |
[
|
| [10] |
|
| [11] |
[
|
| [12] |
|
| [13] |
[
|
| [14] |
[
|
| [15] |
[
|
| [16] |
|
| [17] |
[
|
| [18] |
|
| [19] |
[
|
| [20] |
[
|
| [21] |
[
|
| [22] |
[
|
| [23] |
|
| [24] |
中华人民共和国民政部.中华人民共和国行政区划简册[M].北京:中国地图出版社,2001.
[ Ministry of Civil Affairs of the People's Republic of China. The administrative divisions of the People's Republic of China[M]. Beijing: China Cartographic Publishing House, 2001. ]
|
| [25] |
国家统计局人口和社会科技统计司.中国乡、镇、街道人口资料[M].北京:中国统计出版社,2002.
[ Department of Population Social Science and Technology Statistics National Bureau of Statistics of China. China population by township[M]. Beijing: China Statistics Press, 2002. ]
|
| [26] |
NationalOceanic and Atmospheric Administration (NOAA) National Centers for Environmental Information. Version 4 DMSP-OLS nighttime lights time series [DB/OL]., 2018-08-12.
|
| [27] |
National Aeronautics and Space Administration (NASA) Level-1 and Atmosphere Archive & Distribution System (LAADS) Distributed Active Archive Center (DAAC). MOD13Q1 - MODIS/Terra vegetation indices 16-Day L3 global 250 m SIN Grid [DB/OL]. , 2018-08-12.
|
| [28] |
国家科技基础条件平台—国家地球系统科学数据共享服务平台.山东省100 m土地利用数据(2000年)[DB/OL]. ,2018-08-12.
[ National Earth System Science Data Sharing Infrastructure, National Science & Technology Infrastructure of China. Land use data of Shandong Province in 100 m(2000) [DB/OL]. , 2018-08-12. ]
|
| [29] |
WorldPop. Chinapopulation 2000 [DB/OL]. , 2018-08-12.
|
| [30] |
国家科技基础条件平台—国家地球系统科学数据共享服务平台.中国1:25万乡镇界限数据(2000年) [DB/OL]. ,2018-08-12.
[ National Earth System Science Data Sharing Infrastructure, National Science & Technology Infrastructure of China. China's 1:25 million township boundary data (2000) [DB/OL] , 2018-08-12. ]
|
/
| 〈 |
|
〉 |