
Journal of Geo-information Science >
Assessment of China's High-Temperature Hazards: Accounting for Spatial Agglomeration
Received date: 2018-11-14
Request revised date: 2019-02-25
Online published: 2019-06-15
Supported by
National Natural Science Foundation of China, No.41771537
Copyright
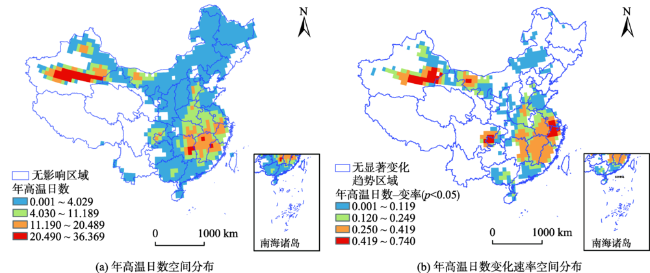
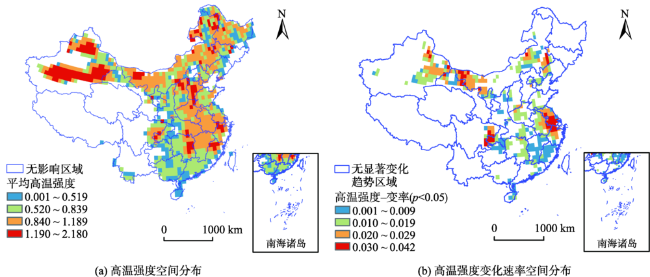
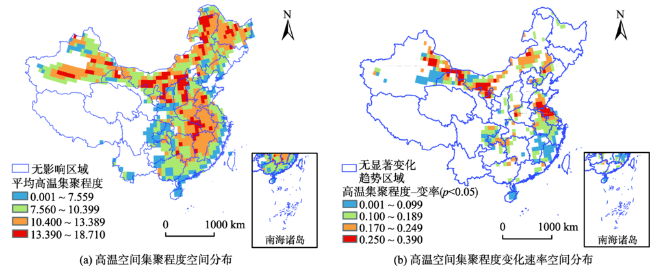
Hazardness assessment is the basis of high temperature hazard (HTH) research. The spatial aggregation of multiple extreme high temperature events will magnify the impacts of extreme events, which not only strengthen high temperature risk, but also increase the vulnerability of disaster-bearing bodies. Previous studies mainly use high temperature days and high temperature intensity to depict HTH, yet seldom consider the the spatial agglomeration of high temperature events. To address this gap, the HTH assessment in this paper integrates the traditional HTH assessment and the spatial agglomeration of high temperature events. In so doing, the evaluation of HTH is more comprehensive by accunting for the synergy effect of high temperature hazard agglomeration. Based on high temperature days, high temperature intensity, and high temperature spatial agglomeration, HTH in China from 1979 to 2017 was evaluated integratively. The spatial distribution characteristics of these indices were illustrated and their inter-annual variations were analyzed. Finally, areas with the highest integrative high temperature intensity and regions with simultaneous enhancement of the three indices were idenified separately. The results show that the strength of HTH in western and northeastern Inner Mongolia and northern Shanxi is underestimated due to the lack of consideration of high temperature spatial agglomeration, where the Grade 4 HTH is underestimated to be Grade 2 or 3. On the other hand, if HTH assessment considered only the number of high temperature days, the high temperature hazardness in most areas of Inner Mongolia, Heilongjiang, Shandong, and the northern part of western Shaxi would have been underestimated. This indicates that HTH assessment needs to account for the three indices simultaneouly. From the results of integrative assessment, for now, the most dangerous areas due to high temperature are located in southern Tianshan Mountains and eastern Hunan, where high temperature days are 20-36 days, high temperature intensity ranges from 1.190 ℃ to 2.180 ℃ and high temperature spatial agglomeration ranges from 13.390 to 18.710. From the results of inter-annual variations, all of the three indices significantly increased in the junction of Inner Mongolia and Gansu, Jiangsu, and the junction of Sichuan and Chongqing. These areas may become the most dangerous areas of high temperature hazards in the future, where from 1979 to 2017 the variability of high temperature days is 0.419-0.740 days/year, the variability of high temperature intensity is 0.30-0.42 ℃/10 years and the variability of high temperature spatial agglomeration is 0.250-0.390 per year. The proposed HTH assessment method is helpful to improve the accuracy of risk assessment of high temperature hazards, and the results of our trend analysis of these indices can help predict the high-risk areas. In addition, the method can identify the high-risk areas of each hazard factor and also the dominant factor of each high-risk area. It provides a scientific basis for targeted high temperature prevention and mitigation, as well as resource allocation over the whole China.
ZHANG Ting , CHENG Changxiu . Assessment of China's High-Temperature Hazards: Accounting for Spatial Agglomeration[J]. Journal of Geo-information Science, 2019 , 21(6) : 865 -874 . DOI: 10.12082/dqxxkx.2019.180580
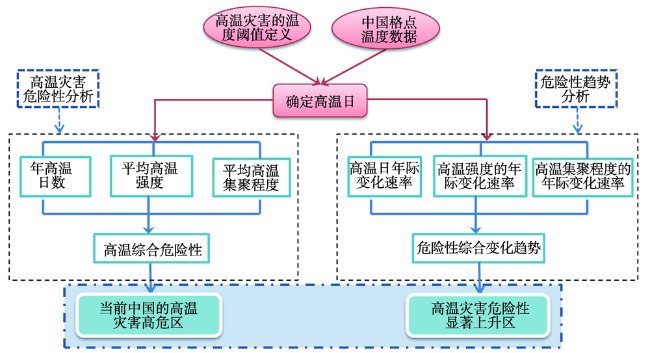
Fig. 1 Flowchart of the assessment and trend analysis of high-temperature hazards图1 高温灾害危险性评价与趋势分析流程 |
Fig. 2 Spatial distribution of annual high temperature days and change rate of the index from 1979 to 2017 in China图2 1979-2017年中国年高温日数及其变化速率的空间分布 |
Fig. 3 Spatial distribution of high temperature intensity and change rate of the index from 1979 to 2017 in China图3 1979-2017年中国高温强度及其变化速率的空间分布 |
Fig. 4 Spatial distribution of high temperature spatial aggregation degree and change rate of the index from 1979 to 2017 in China图4 1979-2017年中国高温空间集聚程度及其变化速率的空间分布 |
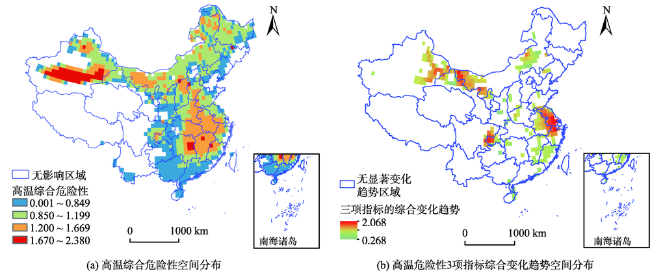
Fig. 5 Spatial distribution of integrative high temperature hazardness and integrative change trend of the indices from 1979 to 2017 in China图5 1979-2017年中国高温综合危险性及各指标的综合变化趋势的空间分布 |
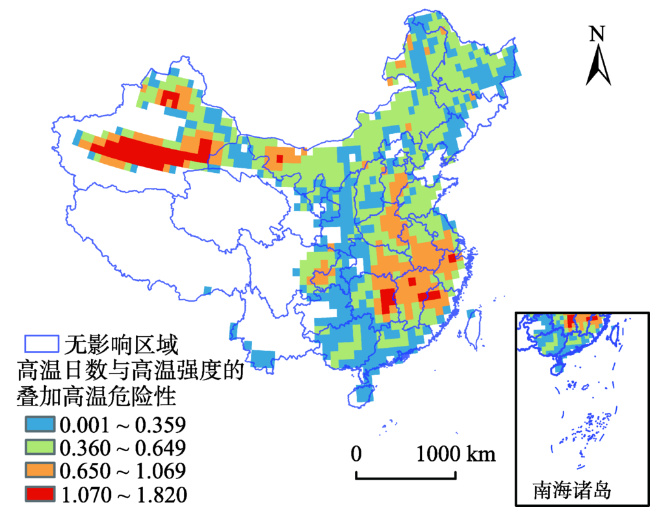
Fig. 6 Integrated hazardness of high temperature days and high temperature intensity degree from 1979 to 2017 in China图6 1979-2017年中国高温日数与高温强度的叠加高温危险性 |
The authors have declared that no competing interests exist.
| [1] |
|
| [2] |
|
| [3] |
|
| [4] |
|
| [5] |
IPCC.Climate Change 2007. Working group I contribution to the fourth assessment report of the intergovernmental panel on climate change [C]. Cambridge, UK and New York,USA: Cambridge University Press, 2007.
|
| [6] |
|
| [7] |
[
|
| [8] |
[
|
| [9] |
[
|
| [10] |
[
|
| [11] |
[
|
| [12] |
[
|
| [13] |
[
|
| [14] |
[
|
| [15] |
[
|
| [16] |
[
|
| [17] |
[
|
| [18] |
[
|
| [19] |
|
| [20] |
[
|
| [21] |
[
|
| [22] |
[
|
| [23] |
[
|
| [24] |
[
|
| [25] |
|
| [26] |
[
|
| [27] |
[
|
| [28] |
[
|
| [29] |
[
|
| [30] |
[
|
| [31] |
[
|
| [32] |
|
| [33] |
[
|
| [34] |
[
|
| [35] |
[
|
| [36] |
[
|
/
| 〈 |
|
〉 |