
Journal of Geo-information Science >
Accessibility of Public Service Facilities as Influenced by Public Transport Modes
Received date: 2018-07-13
Request revised date: 2019-03-10
Online published: 2019-07-25
Supported by
National Natural Science Foundation of China, No.41571377
Copyright
Spatial accessibility analysis is recognized as an efficient way to assess the convenience of residents in accessing public service facilities by different travel modes. To this end, analyzing the travel time between residents and public service facilities is essential part of accessibility analysis. However, most studies used rough estimates of travel distance/time by ArcGIS network analysis tools, especially for public transport modes. To calculate travel time more accurately, this study used Python language to develop a platform to extract the traffic trip data including travel times and distances based on the Baidu map navigation API (Application Program Interface) service. The nearest facility method and the cumulative opportunity cost and isochronal method were applied to measure and compare the disparity of accessibility to Nanjing's central business districts (CBDs), administrative service centers, large hospitals, railway stations, and airports in different public transportation scenarios (BTT and MTT). The results show that: ① A door-to-door approach in travel time calculations for public transport modes according to up-to-date schedules based on internet map service is more accurate and convenient compared with the traditional ArcGIS network method. ② The metro network system has obviously improved the accessibility from residential areas to urban public service facilities, especially the "corridors areas" along the metro lines or bus routes and the areas close to the important transportation facilities, such as metro stations. ③ In the MTT scenario, the changes of the accessibility from residential areas to CBDs were significantly concentrated in 0-30 minutes; the cumulative population and area within 30-minute time threshold are respectively 1.7 times and 2.2 times those of the BTT scenario. ④ The changes of the accessibility from the residential cells to the nearest railway station were significantly concentrated in 0-30 minutes and 30~60 minutes; the cumulative population and area within 30-minute time threshold were respectively 8.9 and 3.0 times those of the BTT scenario. The cumulative population and area within 60-minute time threshold were respectively 1.5 times and 1.9 times those of the BTT scenario. ⑤ The changes of the accessibility from residential cells to airports were significantly concentrated in 60~90 minutes and 90~120 minutes, and the cumulative population and area within 90-minute time threshold were respectively 12.6 and 6.6 times those of the bus scenario; the cumulative population and area within 120-minute time threshold were 2.0 and 3.6 times higher than in the BTT scenario. ⑥ The changes of the accessibility from residential cells to administrative centers and large hospitals were also available to promote at various time interval periods. In addition, this paper can obtain more complete and real route time access to urban service facilities for other modes of transportation (e.g., cars, electric vehicles, bicycles, walking), and also provides reference for further studies to promote the sustainable development of public transportation.
Key words: metro; bus; public service facilities; travel time; precise time calculation; accessibility; Nanjing
CHEN Jie , LI Ang , FU Zheng , LI Siqian , WANG Jiechen . Accessibility of Public Service Facilities as Influenced by Public Transport Modes[J]. Journal of Geo-information Science, 2019 , 21(7) : 983 -993 . DOI: 10.12082/dqxxkx.2019.180328
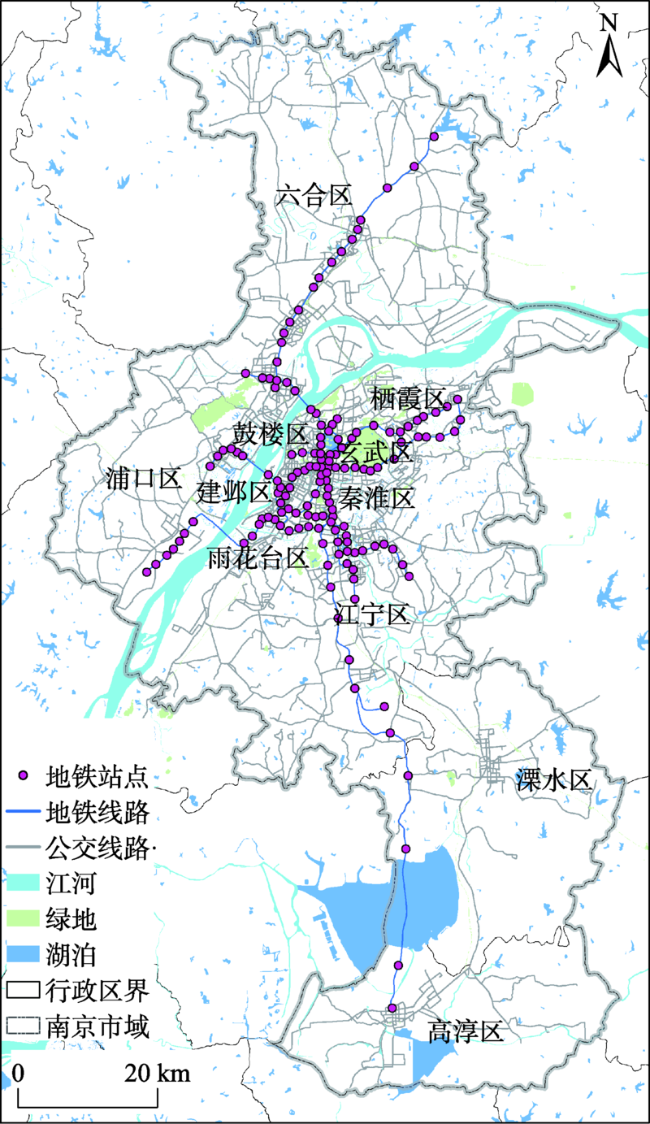
Fig. 1 Bus routes and Metro network of Nanjing City in 2017图1 2017年南京市地铁与公交网络 |
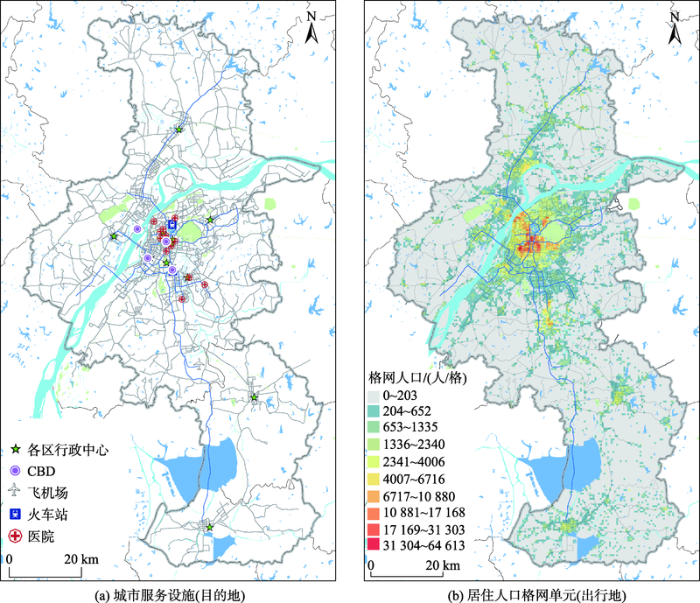
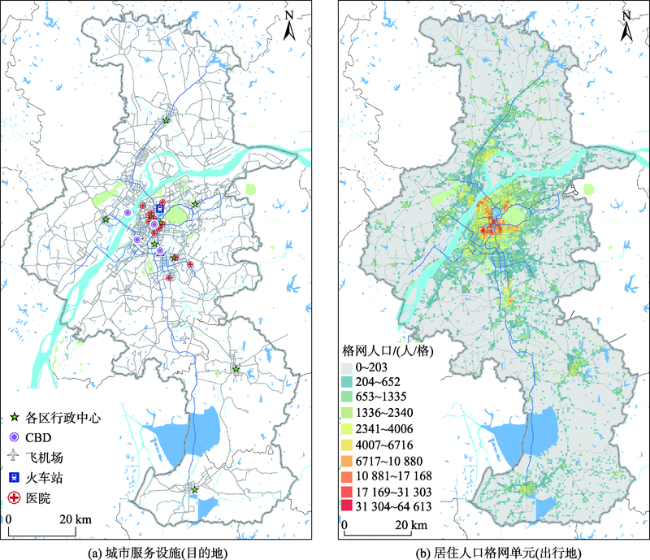
Fig. 2 Distribution of the origins (gridded population) and destinations (public service facilities) in Nanjing City in 2017图2 2017年南京市居住人口单元和城市服务设施空间分布 |
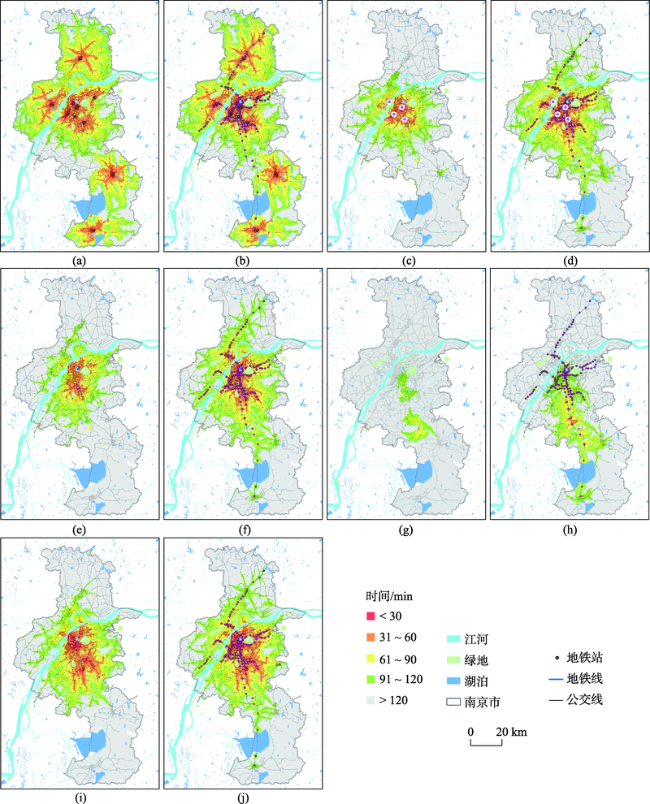
Fig. 3 Accessibility to administrator centers, CBDs, railway stations, airports, and hospitals from residential cells for the BTT and MTT scenarios in Nanjing City in 2017图3 2017年南京市BTT和MTT公交模式下居住单元至行政中心、CBDs、火车站、飞机场、医院的可达性 |
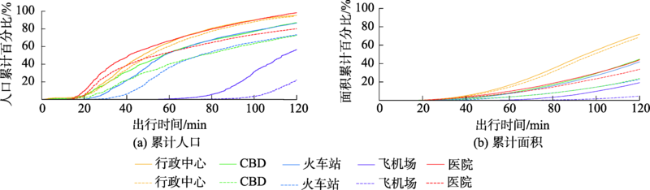
Fig. 4 Cumulative shares of residents and areas that can access the closet destination within a certain travel time threshold in Nanjing City in 2017图4 2017年南京市城市设施服务可达人口和面积累计曲线 |
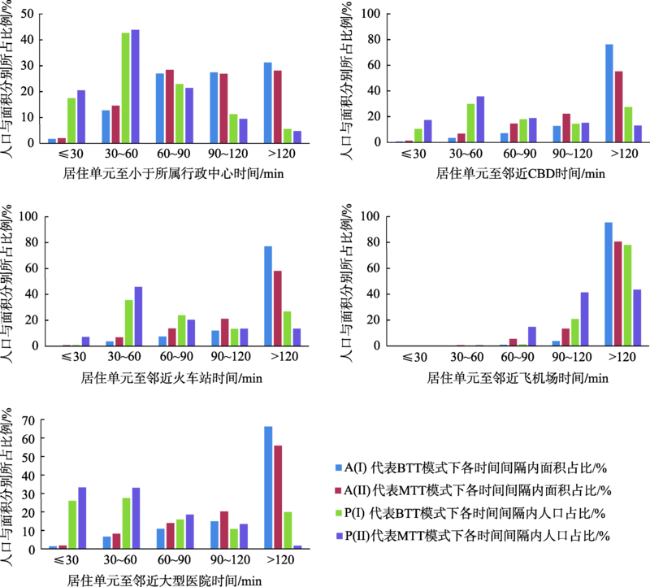
Fig. 5 Frequency distribution of the shares of accessibility (populations and areas) in accessing public service facilities in Nanjing City in 2017图5 2017年南京市格网单元分别至5类公共服务设施的可达性人口和面积频率分布 |
Tab. 1 Statistics of the accessibility to administrative centers, CBDs, railway stations, airports, and hospitals for the BTT and MTT scenarios in Nanjing City in 2017表1 2017年南京市BTT和MTT公交模式情景下居民至行政中心、CBDs、火车站、飞机场、医院可达性统计 |
| 间隔时段 | 行政中心 | CBD | 火车站 | 飞机场 | 医院 | ||||||||||||||||||||||||
|---|---|---|---|---|---|---|---|---|---|---|---|---|---|---|---|---|---|---|---|---|---|---|---|---|---|---|---|---|---|
| (累计时间) | Ⅰ | Ⅱ | Ⅰ | Ⅱ | Ⅰ | Ⅱ | Ⅰ | Ⅱ | Ⅰ | Ⅱ | |||||||||||||||||||
| /min | P | A | P | A | P | A | P | A | P | A | P | A | P | A | P | A | P | A | P | A | |||||||||
| ≤30 | 17.5 | 1.7 | 20.5 | 2.0 | 10.4 | 0.6 | 17.4 | 1.3 | 0.8 | 0.2 | 7.1 | 0.6 | 0.0 | 0.0 | 0.0 | 0.0 | 26 | 1.4 | 33.2 | 1.8 | |||||||||
| 30~60 | 42.7 | 12.7 | 43.9 | 14.6 | 29.8 | 3.3 | 35.7 | 6.7 | 35.5 | 3.5 | 45.7 | 6.8 | 0 | 0 | 0.6 | 0.5 | 27.5 | 6.6 | 33.1 | 8.2 | |||||||||
| 60~90 | 22.9 | 27.0 | 21.4 | 28.4 | 17.9 | 7.1 | 18.8 | 14.6 | 23.8 | 7.3 | 20.4 | 13.6 | 1.2 | 0.9 | 14.6 | 5.5 | 15.9 | 10.9 | 18.6 | 13.9 | |||||||||
| 90~120 | 11.3 | 27.4 | 9.5 | 26.9 | 14.5 | 12.8 | 15.1 | 22.2 | 13.2 | 11.9 | 13.4 | 21 | 20.8 | 3.7 | 41.3 | 13.3 | 10.7 | 14.9 | 13.4 | 20.2 | |||||||||
| >120 | 5.6 | 31.2 | 4.7 | 28.1 | 27.4 | 76.2 | 13.0 | 55.2 | 26.7 | 77.1 | 13.4 | 58 | 78 | 95.4 | 43.5 | 80.7 | 19.9 | 66.2 | 1.7 | 55.9 | |||||||||
注:I表示BTT模式;II表示MTT模式;P表示人口覆盖百分比/%;A表示面积覆盖百分比/%。 |
| [1] |
|
| [2] |
|
| [3] |
|
| [4] |
|
| [5] |
|
| [6] |
|
| [7] |
|
| [8] |
[
|
| [9] |
|
| [10] |
|
| [11] |
[
|
| [12] |
[
|
| [13] |
[
|
| [14] |
|
| [15] |
|
| [16] |
|
| [17] |
[
|
| [18] |
|
| [19] |
[
|
| [20] |
|
| [21] |
|
| [22] |
[
|
| [23] |
|
| [24] |
|
| [25] |
|
| [26] |
[
|
| [27] |
|
| [28] |
|
| [29] |
|
| [30] |
|
| [31] |
|
| [32] |
|
| [33] |
European Commission, Joint Research Centre (JRC) Dataset [DB/OL]. .
|
| [34] |
[
|
| [35] |
[
|
/
| 〈 |
|
〉 |