
Journal of Geo-information Science >
Downscaling Modeling of the GPM IMERG Precipitation Product and Comparative Analysis in the Fujian-Zhejiang-Jiangxi Region
Received date: 2018-11-26
Request revised date: 2019-05-24
Online published: 2019-10-29
Supported by
National Natural Science Foundation of China(41405107)
Natural Science Foundation of the Jiangsu Higher Education Institutions of China(14KJD170004)
Postgraduate Research & Practice Innovation Program of Jiangsu Province(KYCX18_1040)
Copyright
In view of present difficulties in providing high-precision precipitation information, this paper constructed three models for downscaling the GPM IMERG precipitation product, based on Geographically Weighted Regression (GWR) and two Ordinary Least Square (OLS) methods. Using these three models, the spatial distribution of precipitation in each month in 2015 was downscaled by integrating the original GPM IMERG product, the ground measured precipitation data, MOD05 water vapor data, and Vegetation index data. The resolution of the precipitation product was downscaled from 0.1° to 1km. Validation results showed that the goodness of the GWR-based model was 102.9% and 93.9%, higher than the goodness of the two OLS models. More specifically, the GWR model has exhibited better stability and less monthly variations. Of the two OLS models, the one that incorporated water vapor exhibited better model fitting goodness in eight months. Compared with the GPM precipitation product, the GWR-based downscaled product, in addition to increase the spatial resolution, decreased the relative error and root-mean-square error by 42% and 32%, respectively. Our findings suggest that the proposed GWR-based model has good potential in downscaling the GPM IMERG precipitation product.
SHI Lan , HE Qiquan , YANG Jiao , WAN Yibo . Downscaling Modeling of the GPM IMERG Precipitation Product and Comparative Analysis in the Fujian-Zhejiang-Jiangxi Region[J]. Journal of Geo-information Science, 2019 , 21(10) : 1642 -1652 . DOI: 10.12082/dqxxkx.2019.180603
表1 GPM原始数据与GPM融合数据精度指标Tab.1 Accuracy performances of the GPM raw data and GPM fusion data |
| 月份 | R | MRE/% | RMSE/mm | |||||
|---|---|---|---|---|---|---|---|---|
| 原始GPM | 融合GPM | 原始GPM | 融合GPM | 原始GPM | 融合GPM | |||
| 1 | 0.451 | 0.804 | 34.43 | 12.68 | 5.54 | 2.60 | ||
| 2 | 0.940 | 0.962 | 31.84 | 22.22 | 5.74 | 4.42 | ||
| 3 | 0.917 | 0.956 | 14.67 | 11.06 | 7.13 | 5.10 | ||
| 4 | 0.703 | 0.803 | 27.83 | 18.15 | 9.69 | 7.97 | ||
| 5 | 0.781 | 0.917 | 20.25 | 11.52 | 25.17 | 16.42 | ||
| 6 | 0.854 | 0.957 | 28.27 | 15.45 | 22.81 | 12.24 | ||
| 7 | 0.594 | 0.744 | 17.05 | 15.06 | 14.67 | 12.65 | ||
| 8 | 0.768 | 0.774 | 30.98 | 27.37 | 23.45 | 22.60 | ||
| 9 | 0.706 | 0.888 | 25.88 | 16.76 | 16.04 | 10.46 | ||
| 10 | 0.676 | 0.855 | 32.14 | 17.79 | 9.57 | 6.98 | ||
| 11 | 0.919 | 0.943 | 41.10 | 22.59 | 9.86 | 7.87 | ||
| 12 | 0.892 | 0.976 | 19.52 | 4.28 | 9.04 | 2.56 | ||
表2 3种模型拟合效果对比Tab. 2 Comparison of the three models' performances |
| 月份 | R2 | AIC | |||||
|---|---|---|---|---|---|---|---|
| OLS_NDVI模型 | OLS_PWV模型 | GWR_PWV模型 | OLS_NDVI模型 | OLS_PWV模型 | GWR_PWV模型 | ||
| 1 | 0.245 | 0.235 | 0.781 | 25 911.77 | 26 248.06 | 22 080.06 | |
| 2 | 0.766 | 0.762 | 0.946 | 30 974.77 | 31 291.86 | 26 339.71 | |
| 3 | 0.377 | 0.443 | 0.902 | 34 699.48 | 34 626.82 | 28 805.83 | |
| 4 | 0.385 | 0.391 | 0.816 | 32 379.88 | 31 632.09 | 28 647.43 | |
| 5 | 0.455 | 0.458 | 0.879 | 39 411.65 | 39 299.39 | 34 772.91 | |
| 6 | 0.373 | 0.370 | 0.912 | 40 366.09 | 40 744.17 | 34 126.50 | |
| 7 | 0.265 | 0.274 | 0.773 | 36 740.84 | 36 136.28 | 33 275.12 | |
| 8 | 0.536 | 0.548 | 0.794 | 37 655.52 | 36 931.75 | 35 307.04 | |
| 9 | 0.550 | 0.545 | 0.820 | 35 016.98 | 35 013.09 | 32 309.58 | |
| 10 | 0.229 | 0.231 | 0.817 | 31 590.47 | 31 875.78 | 27 092.22 | |
| 11 | 0.492 | 0.553 | 0.943 | 36 241.38 | 36 146.63 | 29 248.77 | |
| 12 | 0.349 | 0.446 | 0.806 | 33 279.96 | 33 033.82 | 29 497.57 | |
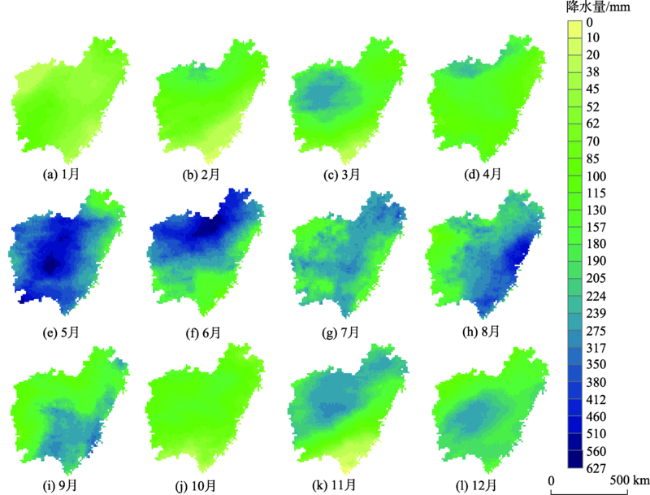
图5 2015年闽浙赣地区GPM各月降水空间分布Fig. 5 Spatial distribution of GPM monthly precipitation in the Fujian-Zhejiang-Jiangxi Region in 2015 |
表3 GPM原始数据与降尺度结果精度指标Tab. 3 Accuracy of the GPM raw data and GWR-based downscaledproduct |
| 月份 | R | MRE/% | RMSE/mm | ||||||||
|---|---|---|---|---|---|---|---|---|---|---|---|
| 原始GPM | 降尺度结果 | 原始GPM | 降尺度结果 | 原始GPM | 降尺度结果 | 原始GPM | 降尺度结果 | ||||
| 1 | 0.451 | 0.812 | 34.43 | 13.01 | 19.19 | 8.90 | -0.609 | 0.654 | |||
| 2 | 0.940 | 0.958 | 31.84 | 22.78 | 19.88 | 15.80 | 0.866 | 0.916 | |||
| 3 | 0.917 | 0.966 | 14.67 | 10.03 | 24.71 | 15.48 | 0.829 | 0.933 | |||
| 4 | 0.703 | 0.849 | 27.83 | 16.86 | 33.57 | 24.04 | 0.448 | 0.717 | |||
| 5 | 0.781 | 0.908 | 20.25 | 11.89 | 87.18 | 59.54 | 0.601 | 0.814 | |||
| 6 | 0.854 | 0.962 | 28.27 | 14.97 | 79.02 | 40.01 | 0.699 | 0.923 | |||
| 7 | 0.594 | 0.769 | 17.05 | 13.30 | 50.81 | 41.08 | 0.335 | 0.565 | |||
| 8 | 0.768 | 0.801 | 30.98 | 24.15 | 81.24 | 75.94 | 0.557 | 0.613 | |||
| 9 | 0.706 | 0.879 | 25.88 | 16.48 | 55.58 | 37.40 | 0.492 | 0.770 | |||
| 10 | 0.676 | 0.856 | 32.14 | 16.52 | 33.15 | 24.44 | 0.431 | 0.691 | |||
| 11 | 0.919 | 0.931 | 41.10 | 21.11 | 34.15 | 29.70 | 0.823 | 0.866 | |||
| 12 | 0.892 | 0.974 | 19.52 | 4.56 | 31.30 | 9.25 | 0.406 | 0.948 | |||
| [1] |
谈戈, 夏军, 李新 . 无资料地区水文预报研究的方法与出路[J]. 冰川冻土, 2004,26(2):192-196.
[
|
| [2] |
|
| [3] |
|
| [4] |
唐国强, 万玮, 曾子悦 , 等. 全球降水测量(GPM)计划及其最新进展综述[J]. 遥感技术与应用, 2015,30(4):607-615.
[
|
| [5] |
刘元波, 傅巧妮, 宋平 , 等. 卫星遥感反演降水研究综述[J]. 地球科学进展, 2011,26(11):1162-1172.
[
|
| [6] |
|
| [7] |
刘永和, 郭维栋, 冯锦明 , 等. 气象资料的统计降尺度方法综述[J]. 地球科学进展, 2011,26(8):837-847.
[
|
| [8] |
|
| [9] |
|
| [10] |
邵颖 . 中国区域TRMM产品降尺度方法研究[D]. 南京:南京信息工程大学, 2015.
[
|
| [11] |
覃文忠, 王建梅, 刘妙龙 . 地理加权回归分析空间数据的空间非平稳性[J]. 辽宁师范大学学报(自然科学版), 2005,28(4):476-479.
[
|
| [12] |
|
| [13] |
|
| [14] |
刘小婵, 张洪岩, 赵建军 , 等. 东北地区TRMM数据降尺度的GWR模型分析[J]. 地球信息科学学报, 2015,17(9):1055-1062.
[
|
| [15] |
曾昭昭, 王晓峰, 任亮 . 基于GWR模型的陕西秦巴山区TRMM降水数据降尺度研究[J]. 干旱区地理, 2017,40(1):26-36.
[
|
| [16] |
赵娜, 焦毅蒙 . 基于TRMM降水数据的空间降尺度模拟[J]. 地球信息科学学报, 2018,20(10):1388-1395.
[
|
| [17] |
金晓龙, 邵华, 张弛 , 等. GPM卫星降水数据在天山山区的适用性分析[J]. 自然资源学报, 2016,31(12):2074-2085.
[
|
| [18] |
陈晓宏, 钟睿达, 王兆礼, 等. 新一代GPM IMERG卫星遥感降水数据在中国南方地区的精度及水文效用评估[J]. 水利学报, 2017,48(10):1147-1156.
[
|
| [19] |
魏志明, 岳官印, 李家 , 等. GPM与TRMM降水数据在海河流域的精度对比研究[J]. 水土保持通报, 2017,37(2):171-176.
[
|
| [20] |
|
| [21] |
|
| [22] |
姜红涛 , 塔西甫拉提·特依拜,阿尔达克·克里木,等.艾比湖流域NDVI变化及其与降水、温度的关系[J]. 中国沙漠, 2014,34(6):1678-1684.
[
|
| [23] |
马新平, 尚可政, 李佳耘 , 等. 1981-2010年中国西北地区东部大气可降水量的时空变化特征[J]. 中国沙漠, 2015,35(2):448-455.
[
|
| [24] |
任菊章, 肖子牛, 张万诚 , 等. 西南地区可降水量分布及其与纵向岭谷区降水的关系[J]. 气象科学, 2013,33(4):442-448.
[
|
| [25] |
余永江 . 福州市空中水汽资源分布特征及其与降水的关系[J]. 水利科技, 2013(3):9-10.
[
|
| [26] |
谭璐璐 . 基于水汽因子的中国中东部区域TRMM降水产品降尺度研究[D]. 南京:南京信息工程大学, 2017.
[
|
| [27] |
|
| [28] |
|
| [29] |
|
| [30] |
|
| [31] |
|
| [32] |
|
| [33] |
江志红, 卢尧, 丁裕国 . 基于时空结构指标的中国融合降水资料质量评估[J]. 气象学报, 2013,71(5):891-900.
[
|
| [34] |
|
/
| 〈 |
|
〉 |