
Journal of Geo-information Science >
Hotspot Prediction of Public Property Crime based on Spatial Differentiation of Crime and Built Environment
Received date: 2019-07-05
Request revised date: 2019-10-08
Online published: 2019-12-11
Supported by
National Key R&D Program of China(No.2018YFB0505500)
National Key R&D Program of China(No.2018YFB0505503)
Key Program of National Natural Science Foundation of China(No.41531178)
Key Project of Science and Technology Program of Guangzhou City, China(No.201804020016)
Research Team Program of Natural Science Foundation of Guangdong Province, China(No.2014A030312010)
Copyright
Machine learning is the mainstream method for crime hotspot prediction. As a popular machine learning algorithm, the random forest algorithm is widely used in the construction of crime hotspot prediction models because of its ability of handling sparse data, and reliable predictive capability and accuracy. A number of studies use multi-source data representing the geographical environment and built environment to train and construct crime hotspot prediction models. Some are theory-driven, while others more data-driven. Most crime prediction models are global models, by constructing a single model for the entire study area. These models do not fully consider the spatial variations of crime and the built environment, as well as the varying relationship between crimes and the built environment. This paper aims to fill in this gap, using public property crime as an example to demonstrate that crime prediction models can be improved by incorporating the aforementioned spatial variations and spatially varying relationship. Firstly, according to the distribution of historical crime events and the distribution of past crime hotspots, the research area was divided into four subareas: stable high-heat grids, high-heat grids, even-hot grids, and non-hot grids. Then, according to the social disorganization theory, routine activity theory, and crime pattern theory, the three covariates including the urban village, the road network, and POI (catering, entertainment and shopping malls as crime attractors and generators) were used as the covariates representing the surrounding built environment. The random forest prediction model also used historical crime data for training and validation. Different models were created for the whole study area and each of the four subareas. The results of 26 bi-week crime hotspot prediction experiments in 2017 were compared, showing that, after adding the three covariates representing the built environment, the prediction accuracy of the entire study area, stable high-heat grids, and high-heat grids were all improved. More importantly, the subarea models were substantially more accurate than the whole model. These findings strongly endorse that incorporating spatial differentiation of crime and the built environment plays a critical role in improving the performance of the prediction models. The majority of the hotspots coincide with commercial facilities that serve as crime generators or attractors. Thus, crime prevention and control should target urban villages and the areas where road densities are high. Further, the differences in subarea based models also suggest any crime fighting strategies should be adjusted to fit each local subarea, to achieve the greatest efficiency.
LIU Lin , JI Jiakai , SONG Guangwen , LIAO Weiwei , YU Hongjie , LIU Wenjuan . Hotspot Prediction of Public Property Crime based on Spatial Differentiation of Crime and Built Environment[J]. Journal of Geo-information Science, 2019 , 21(11) : 1655 -1668 . DOI: 10.12082/dqxxkx.2019.190358
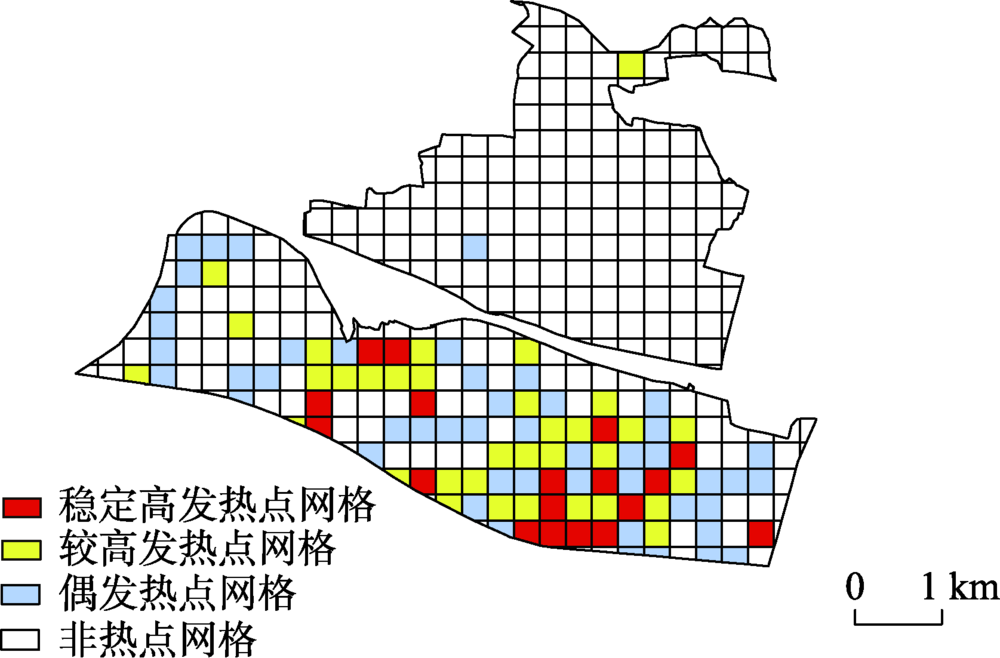
图3 研究区网格历史案发频数分类结果Fig. 3 Grid classification by historical crime events in the study area |
表1 2014-2017年研究区分类网格案件数量Tab. 1 Number of classified grid cases in the study area during 2014-2017 |
| 类别 | 稳定高发热点网格 | 较高发热点网格 | 偶发热点网格 | 非热点网格 |
|---|---|---|---|---|
| 网格总数/个 | 18 | 34 | 48 | 269 |
| 实际热点网格平均数/个 | 10 | 14 | 13 | 18 |
| 案件数平均值/件 | 16.346 | 19.577 | 17.077 | 22 |
| 案件数标准差/件 | 5.411 | 5.147 | 6.099 | 7.054 |
表2 2017.12.17-2017.12.30犯罪热点预测实验说明Tab. 2 Description of the crime hotspot prediction experiment (2017.12.17-2017.12.30) |
| 周期性 | 邻近性 | |
|---|---|---|
| 训练数据集 (2017.12.03-12.16) | 2014.12.03-12.16 2015.12.03-12.16 2016.12.03-12.16 | 2017.10.08-10.21 2017.10.22-11.04 2017.11.05-11.18 2017.11.19-12.02 (建成环境变量) |
| 输入热点/非热点分类标签 | ||
| 待预测数据集 (2017.12.17-12.30) | 2014.12.17-12.30 2015.12.17-12.30 2016.12.17-12.30 | 2017.10.22-11.04 2017.11.05-11.18 2017.11.19-12.02 2017.12.03-12.16 (建成环境变量) |
| 输出热点/非热点分类标签 | ||
表3 2017年研究区犯罪热点预测实验结果Tab. 3 Results of the crime hotspot prediction experiment in the study area in 2017 |
| 网格命中率 | 案件命中率 | PAI | ||||||
|---|---|---|---|---|---|---|---|---|
| 模型A | 模型B | 模型A | 模型B | 模型A | 模型B | |||
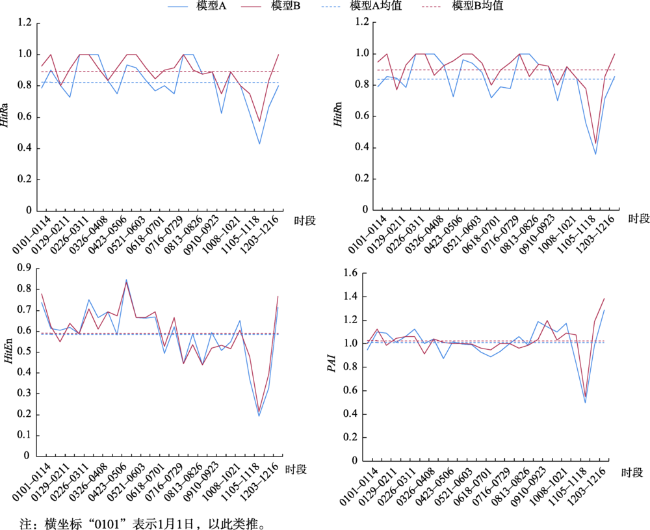
| 平均值 | 0.454 | 0.466 | 0.503 | 0.523 | 3.395 | 3.534 | ||
| 标准差 | 0.075 | 0.074 | 0.086 | 0.084 | 0.548 | 0.598 | ||
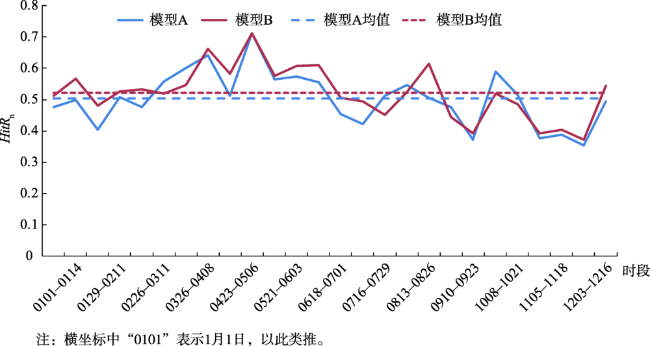
图4 2017年研究区犯罪热点预测结果(网格命中率)Fig. 4 Graph of crime hotspot prediction experiment in the study area in 2017 ̶ Hit Rate of Grid |
图5 2017年研究区犯罪热点预测结果(案件命中率)Fig. 5 Graph of crime hotspot prediction experiment in the study area in 2017 (Hit Rate of Case) |
表4 2017年四类网格预测实验结果Tab. 4 Results of crime hotspot prediction experiment for four kinds of grids in 2017 |
| 网格命中率 | 案件命中率 | 案件命中效率 | PAI | ||||||||
|---|---|---|---|---|---|---|---|---|---|---|---|
| 模型A | 模型B | 模型A | 模型B | 模型A | 模型B | 模型A | 模型B | ||||
| 稳定高发热点网格 | 0.823 | 0.890 | 0.839 | 0.897 | 0.584 | 0.591 | 1.010 | 1.025 | |||
| 较高发热点网格 | 0.604 | 0.635 | 0.629 | 0.677 | 0.472 | 0.473 | 1.179 | 1.187 | |||
| 偶发热点网格 | 0.360 | 0.335 | 0.395 | 0.373 | 0.438 | 0.424 | 1.684 | 1.564 | |||
| 非热点网格 | 0.184 | 0.176 | 0.231 | 0.223 | 0.417 | 0.495 | 6.906 | 8.426 | |||
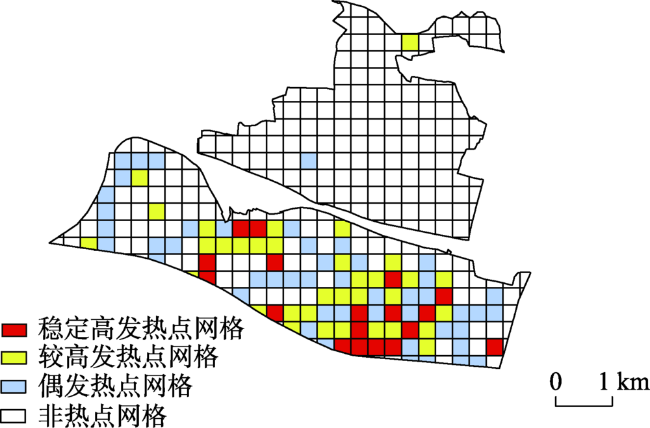
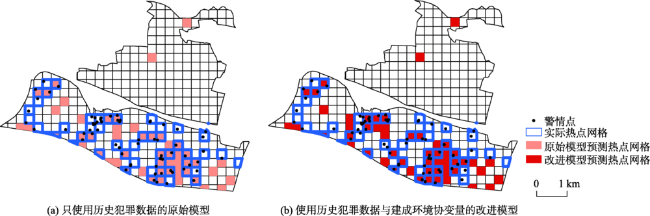
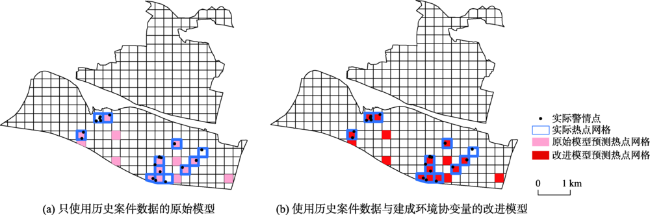
图8 2017年4月23日-2017年5月6日研究区整体预测结果对比Fig. 8 Comparison of prediction results of the overall study area during 04/23/2017 and 05/06/2017 |
| [1] |
|
| [2] |
|
| [3] |
|
| [4] |
李卫红, 闻磊, 陈业滨 . 改进的GA-BP神经网络模型在财产犯罪预测中的应用[J]. 武汉大学学报·信息科学版, 2017,42(8):1110-1116.
[
|
| [5] |
|
| [6] |
马慧娟, 高小红, 谷晓天 . 随机森林方法支持的复杂地形区土地利用/土地覆被分类研究[J]. 地球信息科学学报, 2019,21(3):359-371.
[
|
| [7] |
卢睿, 李林瑛 . 基于随机森林的犯罪预测模型[J].中国刑警学院学报, 2019(3):108-112.
[
|
| [8] |
|
| [9] |
|
| [10] |
王雨晨, 过仲阳, 王媛媛 . 基于随机森林的犯罪风险预测模型研究[J].华东师范大学学报(自然科学版), 2017(4):89-96.
[
|
| [11] |
孙菲菲, 曹卓, 肖晓雷 . 基于随机森林的分类器在犯罪预测中的应用研究[J]. 情报杂志, 2014,33(10):148-152.
[
|
| [12] |
|
| [13] |
|
| [14] |
|
| [15] |
|
| [16] |
周东平 . 西方环境犯罪学:理论、实践及借鉴意义[J].厦门大学学报(哲学社会科学版), 2014(3):20-28.
[
|
| [17] |
|
| [18] |
|
| [19] |
|
| [20] |
段炼, 党兰学, 胡涛 , 等. 融合历史犯罪数据的疑犯社会活动位置预测[J]. 地球信息科学学报, 2018,20(7):929-938.
[
|
| [21] |
|
| [22] |
|
| [23] |
|
| [24] |
|
| [25] |
|
| [26] |
|
| [27] |
杨刚斌, 柳林, 何深静 , 等. 广州门禁小区入室盗窃受害率与内部环境分析[J]. 人文地理, 2016,31(3):45-51.
[
|
| [28] |
柳林, 杜方叶, 肖露子 , 等. 不同类型道路密度对公共空间盗窃犯罪率的影响——基于ZG市的实证研究[J]. 人文地理. 2017,32(6):32-38.
[
|
| [29] |
宋广文, 肖露子, 周素红 , 等. 居民日常活动对扒窃警情时空格局的影响[J]. 地理学报, 2017,72(2):356-367.
[
|
| [30] |
孙兆瑞 . 长春市城乡结合部建筑外环境防卫安全设计研究[D]. 长春:吉林建筑大学, 2017.
[
|
| [31] |
|
| [32] |
柳林, 刘文娟, 廖薇薇 , 等. 基于随机森林和时空核密度方法的不同周期犯罪热点预测对比[J]. 地理科学进展, 2018,37(6):761-771.
[
|
| [33] |
|
| [34] |
|
| [35] |
|
| [36] |
徐冲, 柳林, 周素红 , 等. DP半岛街头抢劫案件的临近重复发生模式[J]. 地理研究, 2015,34(2):384-394.
[
|
/
| 〈 |
|
〉 |


