
Journal of Geo-information Science >
Spatiotemporal Evolution and Situation Analysis of Global Terrorist Attacks
Received date: 2019-07-19
Request revised date: 2019-09-01
Online published: 2019-12-11
Copyright
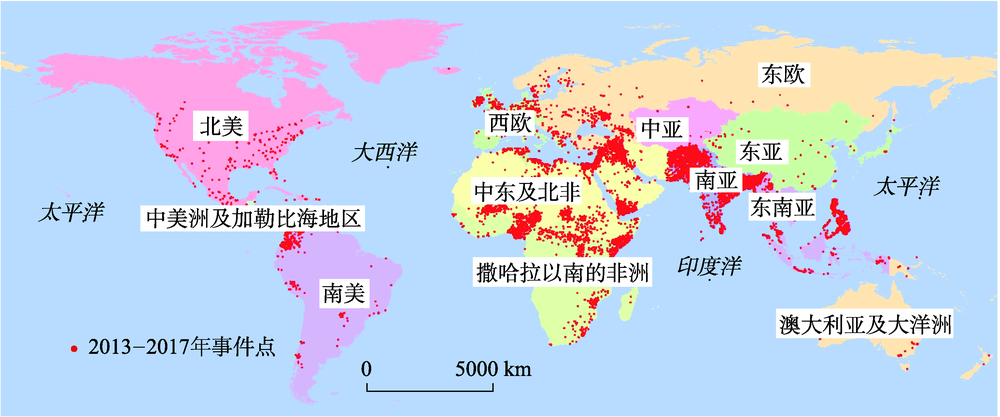
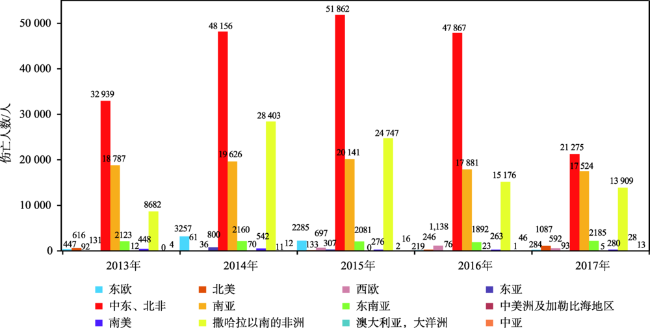
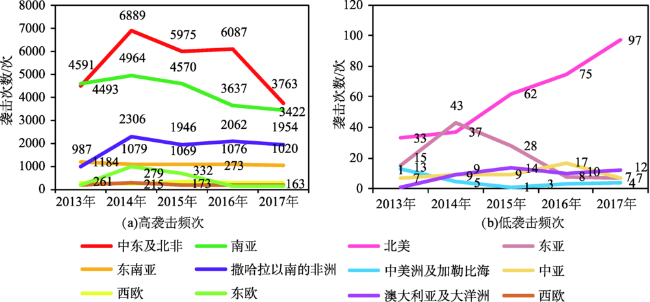
Terrorist attack is violent and destructive, resulting in casualties and property losses; it also involves social unrests, causing significant psychological pressure and hindering normal economic development. The data of this paper came from the global terrorism database, spanning from 2013 to 2017. GIS technology and the statistical theory were used to process and analyze the data of global terrorist attacks, and to analyze the spatial evolution of global terrorist attacks and the overall situation. The attributes selected for the data processing include latitude and longitude, regional information, casualties, etc., which were used for the hotspot analysis of casualties, hierarchical clustering of regional event frequency, and the time and space of global terrorist attacks. The evolution characteristics and situation were analyzed and studied. The spatial distribution and changes of the global high-injury hotspots in the five years were discussed, and the frequency of attacks in different regions was counted and the severity of incidents was classified. Specifically, based on the number of casualties, we used the ArcGIS software to draw the 2013-2017 casualty hotspot map and cold spot map to analyze the spatial trend of terrorism, and used the SPSS software to draw hierarchical clustering pedigree maps for regions of different severity levels. Results show: (1) In the 5 years, the number of casualties reached 202 099 in 2014, and then decreased year by year; the frequency of attacks showed a jagged pattern of “maniac-governance-convergence-no governance-again mania”. (2) The Middle East and North Africa regions were the main sources of terrorist attacks and also the hot spots with high casualties. The average annual casualties accounted for about 49% of the world's total, and the frequency of incidents accounted for about 40%, while the number of casualties in South Asia wass about 22.8%, the attack frequency was about 31.1%, followed by sub-Saharan Africa. By contrast, Southeast Asia, Western Europe, Eastern Europe, and South America were the emerging areas of active terrorism. (3) Global terrorism in general centered on the border area of the Middle East, North Africa, and sub-Saharan Africa, and gradually spreaded to South Asia, Southeast Asia, and Western Europe. Our findings can inform the decision-makers of anti-terrorism organizations to help enhance global security.
WANG Chengcong , LIU Yajing , LIU Mingyue . Spatiotemporal Evolution and Situation Analysis of Global Terrorist Attacks[J]. Journal of Geo-information Science, 2019 , 21(11) : 1710 -1720 . DOI: 10.12082/dqxxkx.2019.190384
图1 2013-2017年全球恐怖袭击事件空间分布注:该图基于国家测绘地理信息局标准地图服务网站下载的审图号为GS(2016)2271号的标准地图制作,底图无修改。 Fig. 1 Spatial distribution of the terrorist attacks during 2013 to 2017 |
表1 2013-2017年全球不同地区恐怖袭击事件发生次数统计Tab. 1 Numbers of terrorist attacks in different regions from 2013 to 2017 |
| 地区 | 2013年 | 2014年 | 2015年 | 2016年 | 2017年 |
|---|---|---|---|---|---|
| 东欧 | 164 | 958 | 681 | 134 | 110 |
| 北美 | 33 | 37 | 62 | 75 | 97 |
| 西欧 | 261 | 215 | 332 | 273 | 291 |
| 东亚 | 15 | 43 | 28 | 8 | 7 |
| 中东及北非 | 4493 | 6889 | 5975 | 6087 | 3763 |
| 南亚 | 4591 | 4964 | 4570 | 3637 | 3422 |
| 东南亚 | 1184 | 1079 | 1069 | 1076 | 1020 |
| 中美洲及加勒比海地区 | 13 | 5 | 1 | 3 | 4 |
| 南美 | 178 | 279 | 173 | 153 | 163 |
| 撒哈拉以南的非洲 | 987 | 2306 | 1946 | 2062 | 1954 |
| 澳大利亚及大洋洲 | 1 | 9 | 14 | 10 | 12 |
| 中亚 | 7 | 9 | 9 | 17 | 7 |
表2 热点分析等级判断表Tab. 2 Statistical reference for hotspot analysis |
| z得分 | p值 | 置信度/% |
|---|---|---|
| <-1.65或>1.65 | <0.10 | 90 |
| <-1.96或>1.96 | <0.05 | 95 |
| <-2.58或>2.58 | <0.01 | 99 |
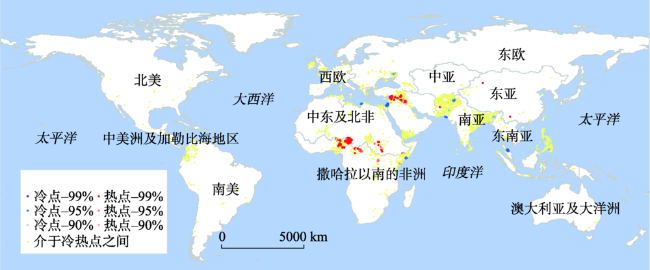
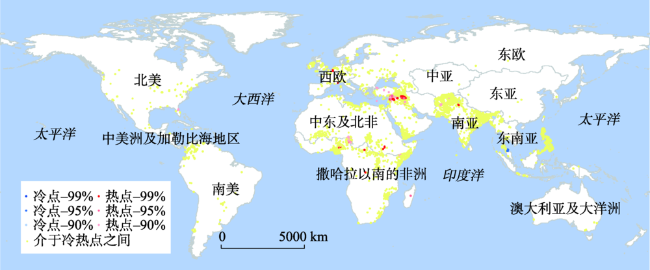
图4 2013年恐怖袭击事件伤亡人数热点分布注:该图基于国家测绘地理信息局标准地图服务网站下载的审图号为GS(2016)2271 号的标准地图制作,底图无修改。图中红色越深代表高死亡率聚集越集中,蓝色越深表示死亡率越低。 Fig. 4 Hotspots of casualties in the terrorist attacks in 2013 |
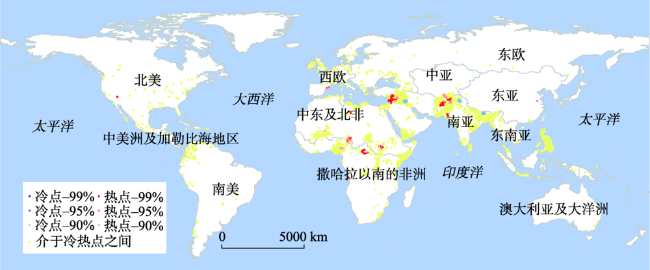
图5 2014年恐怖袭击事件伤亡人数热点分布注:该图基于国家测绘地理信息局标准地图服务网站下载的审图号为GS(2016)2271 号的标准地图制作,底图无修改。图中红色越深代表高死亡率聚集越集中,蓝色越深表示死亡率越低。 Fig. 5 Hotspots of casualties in the terrorist attacks in 2014 |
图6 2015年恐怖袭击事件伤亡人数热点分布注:该图基于国家测绘地理信息局标准地图服务网站下载的审图号为GS(2016)2271号的标准地图制作,底图无修改。图中红色越深代表高死亡率聚集越集中,蓝色越深表示死亡率越低。 Fig. 6 Hotspots of casualties in the terrorist attacks in 2015 |
图7 2016年恐怖袭击事件伤亡人数热点分布注:该图基于国家测绘地理信息局标准地图服务网站下载的审图号为GS(2016)2271号的标准地图制作,底图无修改。图中红色越深代表高死亡率聚集越集中,蓝色越深表示死亡率越低。 Fig. 7 Hotspots of casualties in the terrorist attacks in 2016 |
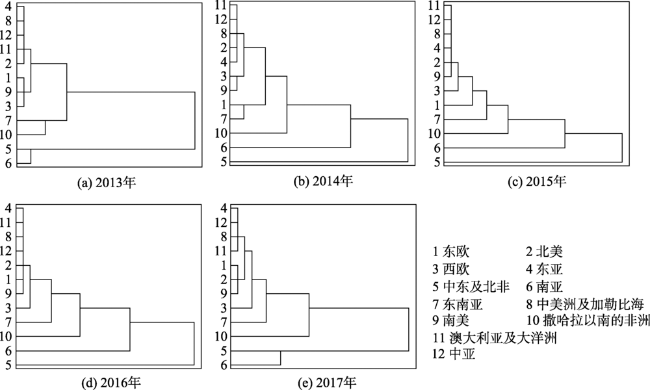
图9 2013-2017年恐怖袭击事件频次层次聚类Fig. 9 Clustering of the different regions ofhe world based on terrorist attack frequency from 2013 to 2017 |
表3 2013-2017年全球不同区域恐怖袭击层次聚类分层结果Tab. 3 Clustering results of the different regions of the world based on terrorist attacks from 2013 to2017 |
| 等级 | 2013年 | 2014年 | 2015年 | 2016年 | 2017年 |
|---|---|---|---|---|---|
| 最严重的地区 | 南亚 | 中东及北非 | 中东及北非 | 中东及北非 | 中东及北非 |
| 严重地区 | 中东及北非 | 南亚 | 南亚 | 南亚 | 南亚 |
| 较严重地区 | 撒哈拉以南的非洲 | 撒哈拉以南的非洲 | 撒哈拉以南的非洲 | 撒哈拉以南的非洲 | 撒哈拉以南的非洲 |
| 较不严重地区 | 东南亚 | 东南亚、东欧 | 东南亚 | 东南亚 | 东南亚 |
| 不严重地区 | 西欧、南美、东欧 | 南美、西欧 | 东欧 | 西欧 | 西欧 |
| 较轻微地区 | 北美、澳大利亚及大洋洲、中亚、中美洲及加勒比海、东亚 | 东亚、北美、中美洲及加勒比地区、中亚、澳大利亚及大洋洲 | 西欧、南美、北美、东亚、中美洲及加勒比海、中亚、澳大利亚及大洋洲 | 南美、东欧、北美、中亚、中美洲及加勒比海、澳大利亚及大洋洲、东亚 | 南美、北美、东欧、澳大利亚及大洋洲、中美洲及加勒比海、中亚、东亚 |
| [1] |
严帅, 李伟陈, 陈庆鸿 . 当前国际反恐战略态势[J].国际研究参考, 2019(3):45-51.
[
|
| [2] |
宋汀, 曹伟 . 2018年上半年国际恐怖主义态势报告[J]. 中国信息安全, 2018(9):86-90.
[
|
| [3] |
罗国强, 赵睿 . 总体安全观下“一带一路”的和平与安全问题及其法制构建[J].人文杂志, 2016(9):50-59.
[
|
| [4] |
李国辉 . 全球恐怖袭击时空演变及风险分析研究[D]. 北京:中国科学技术大学, 2014.
[
|
| [5] |
郝蒙蒙, 陈帅, 江东 , 等. 中南半岛恐怖袭击事件时空演变特征分析[J]. 科技导报, 2018,36(3):62-69.
[
|
| [6] |
|
| [7] |
李益斌 . 欧洲恐怖主义的新态势及原因分析[J]. 情报杂志, 2018,37(3):55-63.
[
|
| [8] |
|
| [9] |
隋晓妍 . 我国恐怖袭击时空变化特征与影响因素研究[D]. 大连:大连理工大学, 2017.
[
|
| [10] |
朱艳丽, 靖常峰, 伏家云 , 等. 时空立方体的抢劫案件时空特征挖掘与分析[J]. 测绘科学, 2019,44(9):132-138,145.
[
|
| [11] |
张家栋 . 世界恐怖主义的主要特征与发展趋势[J].国际观察, 2011(5):8-15.
[
|
| [12] |
|
| [13] |
周松青 . 全球恐怖主义数据库及对中国反恐数据库建设的启示[J]. 情报杂志, 2016,35(9):6-11.
[
|
| [14] |
章小童, 阮建海 . 国内反恐情报研究结构特征与研究热点分析[J]. 情报杂志, 2016,35(8):31-36,24.
[
|
| [15] |
刘子义, 蔡中祥, 刘宏建 , 等. 恐怖主义研究热点与前沿可视化分析[J].世界地理研究, 2016(6):28-37.
[
|
| [16] |
王杏芝 . 全球恐怖主义治理:恐怖分子“去极端化”改造的视角[D]. 北京:外交学院, 2018.
[
|
| [17] |
张将星 . 1970-2013年全球恐怖主义活动的特征分析——兼论“9·11”事件前后时段比较[J]. 同济大学学报(社会科学版), 2016,27(2):48-57.
[
|
| [18] |
|
| [19] |
刘明辉 . 基于K-means聚类分析的民航系统恐怖主义风险评估[J]. 数据分析与知识发现, 2018,2(10):21-26.
[
|
| [20] |
吴笛, 杜云艳, 易嘉伟 , 等. 基于密度的轨迹时空聚类分析[J]. 地球信息科学学报, 2015,17(10):1162-1171.
[
|
| [21] |
杨小兵 . 聚类分析中若干关键技术的研究[D]. 杭州:浙江大学. 2005.
[
|
| [22] |
吴文浩, 吴升 . 多时间尺度密度聚类算法的案事件分析应用[J]. 地球信息科学学报, 2015,17(7):837-845.
[
|
| [23] |
刘磊 . 基于k-means的自适应聚类算法研究[D]. 北京:北京邮电大学, 2009.
[
|
| [24] |
余红楚, 方志祥, 陆锋 , 等. 重要经济发展区域间海运网络时空演变特性分析[J]. 地球信息科学学报, 2018,20(5):582-592.
[
|
| [25] |
刘子义 . 恐怖组织及其活动的时空特征研究[D]. 郑州:信息工程大学, 2017.
[
|
| [26] |
程日能, 傅秀芬 . 可视数据挖掘技术在警务信息系统的研究与应用[J]. 现代计算机(专业版), 2010(12):84-87.
[
|
| [27] |
|
| [28] |
|
| [29] |
熊理然, 刘保强, 武友德 , 等. 2010-2015年中东北非政局变动中的“政治性民意势力”及其影响[J]. 地理科学进展, 2019,38(6):930-940.
[
|
| [30] |
周婷 . 阿富汗抗苏战争与恐怖主义的扩散[D]. 济南:山东师范大学, 2016.
[
|
| [31] |
王世达 . 南亚恐怖主义及反恐形势[J].印度洋经济体研究, 2015(5):61-78,158.
[
|
| [32] |
刘中民, 赵跃晨 . “伊斯兰国”在撒哈拉以南非洲地区的渗透及其影响因素分析[J]. 国际展望, 2018,10(2):112-133,157.
[
|
/
| 〈 |
|
〉 |


