
Journal of Geo-information Science >
Spatio-temporal Evolution of the AIDS Pattern in China
Received date: 2019-04-28
Request revised date: 2019-06-28
Online published: 2020-04-13
Supported by
National Key Research and Development Program of China(2016YFB0502300)
Copyright
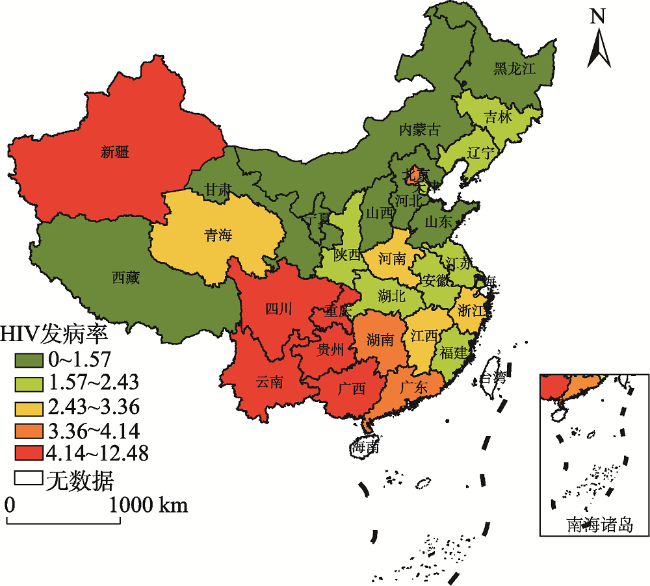
AIDS is an infectious fatal disease caused by HIV, which is class B in infectious disease in China. Since the first case of AIDS reported in 1985, AIDS has been rampant in China. Exploring the spatial pattern of AIDS and its spatiotemporal evolution characteristics will help improve AIDS prevention and control. In this study, we adopted GIS spatial statistical methods to analyze the provincial incidence data of AIDS in China from 1997 to 2016. First, we used spatial autocorrelation technology to detect the spatial pattern of the AIDS epidemic. Then, we explored the spatiotemporal evolution process by using the centroid transferring curve model. Results show that: (1) The epidemic of AIDS in China has strong spatial dependence at the provincial scale. From 1997 to 2016, the global spatial correlation of AIDS increased, and is likely to further increase. The development and diffusion process of the AIDS accorded with the first law of geography. (2) The AIDS epidemic in China showed a general pattern of "high in the south, low in the north, and random in the middle." The regions where local spatial autocorrelation occurred could be divided into two areas: the northern low-low clusters represented by Inner Mongolia and the southern high-high clusters represented by Guangxi. The cold spots area of AIDS in the north experienced fluctuations and increased slightly, and extended to the northeast and central China. The hot spots area in the south had a growing trend. (3) The overall prevalence of the AIDS epidemic has been expanding from 1997 to 2016 gradually, with obvious regional differences. In the process of diffusion, thespatial pattern of AIDS became increasingly unbalanced. Our findings suggest that, to achieve regional synergy and precise control of AIDS in the future, in addition to the traditional prevention methods, we should focus more on the spatiotemporal patterns of AIDS diffusion. Also, it is necessary to strengthen the control of hot spots in the epidemic and the direction of high-risk transmission. The present study demonstrates the importance and reliability of the spatial statistical analysis methods in improving medical and health services, and could be used as a scientific reference for the work of AIDS prevention and control in China. In future studies, we should scale down the research unit when more detailed data is available.

ZHANG Yongshu , YANG Zhenkai , ZI Lu , CAO Yibing , YU Hang . Spatio-temporal Evolution of the AIDS Pattern in China[J]. Journal of Geo-information Science, 2020 , 22(2) : 198 -206 . DOI: 10.12082/dqxxkx.2020.190199
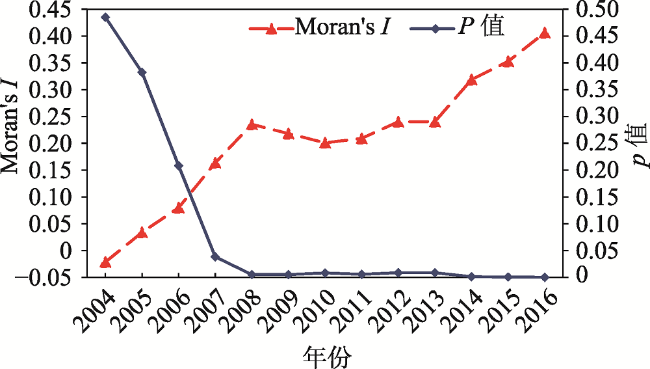
表1 1997—2016年中国艾滋病发病率的全局Moran's I计算结果Tab. 1 Calculation results of global Moran's I of AIDS incidence rate in China from 1997 to 2016 |
| 年份 | Moran's I | p 值 | 年份 | Moran's I | p 值 |
|---|---|---|---|---|---|
| 1997 | 0.0660 | 0.3579 | 2007 | 0.1636 | 0.0383 |
| 1998 | -0.0424 | 0.4171 | 2008 | 0.2353 | 0.0051 |
| 1999 | 0.0183 | 0.4781 | 2009 | 0.2181 | 0.0051 |
| 2000 | -0.0487 | 0.3902 | 2010 | 0.2009 | 0.0081 |
| 2001 | -0.0430 | 0.4331 | 2011 | 0.2091 | 0.0057 |
| 2002 | -0.0343 | 0.4202 | 2012 | 0.2402 | 0.0086 |
| 2003 | 0.0369 | 0.3420 | 2013 | 0.2402 | 0.0086 |
| 2004 | -0.0213 | 0.4451 | 2014 | 0.3187 | 0.0013 |
| 2005 | 0.0339 | 0.3821 | 2015 | 0.3526 | 0.0006 |
| 2006 | 0.0800 | 0.2082 | 2016 | 0.4061 | 0.0001 |
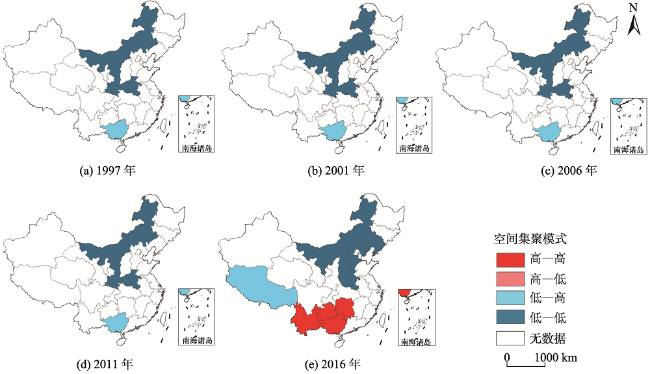
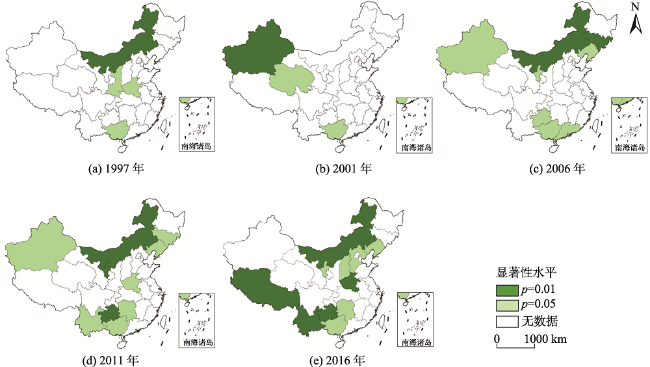
图3 1997—2016年中国艾滋病发病率分布LISA集聚图注:由于数据获取困难,本次研究不包括台湾、香港、澳门和海南。该图基于国家测绘地理信息局标准地图服务网站下载的审图号为GS(2019)1825的标准地图制作,底图无修改。 Fig. 3 LISA cluster maps of the distribution of AIDS incidence rate in China from 1997 to 2016 |
表2 1997—2016年中国艾滋病发病率4种空间关联模式对应的区域Tab. 2 Regions of the four spatial association modes of AIDS incidence rate in China from 1997 to 2016 |
| 年份 | 低—低 | 低—高 | 高—低 | 高—高 |
|---|---|---|---|---|
| 1997 | 内蒙古—陕西—河南 | 广西 | ||
| 2001 | 新疆—青海 | 广西 | ||
| 2006 | 内蒙古—吉林—辽宁—宁夏 | 贵州 | 新疆 | 广西—广东 |
| 2011 | 内蒙古—吉林—辽宁—宁夏 | 湖南—贵州 | 新疆—河南 | 云南—广西 |
| 2016 | 内蒙古—辽宁—河北—山西—宁夏—河南 | 西藏 | 湖南—云南—贵州—广西 |
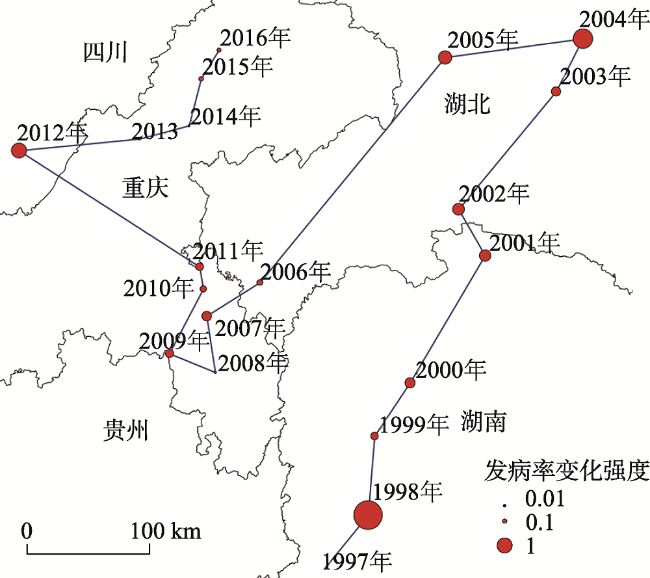
表3 1997—2016年中国艾滋病发病率重心轨迹迁移计算结果Tab. 3 Calculation results of the centroid movement path method of AIDS incidence rate in China from 1997 to 2016 |
| 年份 | 属性阶段观测值 | 属性变化强度 | 重心转移距离/km | 重心转移方向 |
|---|---|---|---|---|
| 1997 | 0.0025 | |||
| 1998 | 0.0120 | 3.80 | 57.44 | 东北50.67 |
| 1999 | 0.0151 | 0.26 | 65.61 | 东北85.33 |
| 2000 | 0.0222 | 0.47 | 52.71 | 东北56.53 |
| 2001 | 0.0350 | 0.58 | 122.01 | 东北59.42 |
| 2002 | 0.0588 | 0.68 | 43.94 | 东南60.19 |
| 2003 | 0.0849 | 0.44 | 126.12 | 东北50.35 |
| 2004 | 0.2349 | 1.77 | 49.07 | 东北63.28 |
| 2005 | 0.4324 | 0.84 | 114.86 | 西南7.76 |
| 2006 | 0.5102 | 0.18 | 240.65 | 西南50.59 |
| 2007 | 0.7400 | 0.45 | 51.99 | 西南32.22 |
| 2008 | 0.7613 | 0.03 | 46.87 | 东南81.17 |
| 2009 | 1.0001 | 0.31 | 40.82 | 西北22.07 |
| 2010 | 1.1974 | 0.20 | 60.16 | 东北62.28 |
| 2011 | 1.5251 | 0.27 | 18.58 | 西北79.92 |
| 2012 | 3.1120 | 1.04 | 177.27 | 西北32.77 |
| 2013 | 3.2230 | 0.04 | 100.26 | 东北5.64 |
| 2014 | 3.3313 | 0.03 | 42.20 | 东北14.79 |
| 2015 | 3.6940 | 0.11 | 39.81 | 东北75.76 |
| 2016 | 3.9656 | 0.07 | 28.11 | 东北58.47 |
| [1] |
李太生, 王福生, 高福 . 中国艾滋病诊疗指南(2018版)[J]. 协和医学杂志, 2019,10(1):31-52.
[
|
| [2] |
杨尧, 李功权 . 中国近年艾滋病空间分布及影响因素分析[J]. 中国艾滋病性病, 2018,24(12):1208-1211.
[
|
| [3] |
|
| [4] |
|
| [5] |
陈江平, 张兰兰, 余远剑 . 利用空间自相关的中国内陆甲型H1N1流感疫情分析[J]. 武汉大学学报·信息科学版, 2011,36(11):1363-1366.
[
|
| [6] |
陈斐, 杜道生 . 空间统计分析与GIS在区域经济分析中的应用[J]. 武汉大学学报·信息科学版, 2002,27(4):391-396.
[
|
| [7] |
范新生, 应龙根 . 中国SARS疫情的探索性空间数据分析[J]. 地球科学进展, 2005,20(3):282-291.
[
|
| [8] |
曹志冬, 曾大军, 王全意 . 北京市甲型H1N1早期流行的特征与时空演变模式[J]. 地理学报, 2010,65(3):361-368.
[
|
| [9] |
宁文艳, 鲁亮, 任红艳 . 2004-2013年间中国登革热疫情时空变化分析[J]. 地球信息科学学报, 2015,17(5):614-621.
[
|
| [10] |
陈翼, 李光强, 邓敏 . 疟疾发病的空间格局和时空演化分析[J]. 地理信息世界, 2010,8(5):42-47.
[
|
| [11] |
曹磊, 刘峰, 闫云 . 2010-2015年陕西省手足口病时空聚集性分析[J]. 公共卫生与预防医学, 2017,28(6):56-59.
[
|
| [12] |
翟卫欣, 程承旗 . 一种空间权重矩阵的优化方法[J]. 武汉大学学报·信息科学版, 2017,42(6):731-736.
[
|
| [13] |
李媛媛, 徐成东, 肖革新 . 京津唐地区细菌性痢疾社会经济影响时空分析[J]. 地球信息科学学报, 2016,18(12):1615-1623.
[
|
| [14] |
徐旳, 柯文前, 陈培阳 . 基于ESDA的河南艾滋病空间格局[J]. 地理研究, 2013,32(7):1199-1208.
[
|
| [15] |
王莹 . 2013年中国HIV/AIDS空间分布及主要社会经济影响因素[D]. 郑州:郑州大学, 2016.
[
|
| [16] |
|
| [17] |
|
| [18] |
|
| [19] |
曹志冬, 王劲峰, 高一鸽 . 广州SARS流行的空间风险因子与空间相关性特征[J]. 地理学报, 2008,63(9):981-993.
[
|
| [20] |
李光强, 曾绍琴, 邓敏 . 重心转移曲线在时空演化模式表达中的应用[J]. 武汉大学学报·信息科学版, 2013,38(8):940-944.
[
|
| [21] |
张英慧, 高星, 王伟 . 中国省域煤矿事故时空分异特征及影响因素研究[J]. 地球信息科学学报, 2018,20(3):311-320.
[
|
| [22] |
付强, 诸云强, 孙九林 . 中国畜禽养殖的空间格局与重心曲线特征分析[J]. 地理学报, 2012,67(10):1383-1398.
[
|
| [23] |
梅林, 郭艳花, 陈妍 . 吉林省人口老龄化时空分异特征及成因[J]. 地理科学进展, 2018,37(3):352-362.
[
|
/
| 〈 |
|
〉 |